Methods and compositions for therapeutic drug monitoring and dosing by point of care pharmacokinetic profiling

a pharmacokinetic profiling and drug monitoring technology, applied in the field of methods and compositions for monitoring and dosing of therapeutic drugs, can solve the problems of pd biomarker testing not pd component is often neglected, and incomplete understanding of pk is now hampering pd biomarker testing from reaching its full potential, so as to increase the individual's dosage, enhance efficacy, and reduce the effect of dosag

Inactive Publication Date: 2014-11-27
AUTOTELIC
View PDF4 Cites 5 Cited by
  • Summary
  • Abstract
  • Description
  • Claims
  • Application Information

AI Technical Summary

Benefits of technology

[0010]In certain embodiments, samples collected at various times from the individual through point-of-care or point-of-use by self-sampling are obtained by a laboratory. The laboratory then tests the samples to quantitate the drug of interest and, based on the results, constructs a pharmacokinetic profile. The results of the pharmacokinetic profile may be presented, optionally along with recommendations to increase the individual's dosage of the drug in order to enhance efficacy or to reduce the dosage in order to reduce risk of toxicity.

Problems solved by technology

However, the PK component is often neglected.
Incomplete understanding of PK is now hampering PD biomarker testing from reaching its full potential.
However, no matter how sensitive a disease is to a drug, an individual with the disease will not respond if the individual does not receive enough of the drug.
However, personalized dosing has been typically a hit or miss process.
Scientific research and publications exploring dose adjustment are not geared toward matching dose to individual patients.
This method is error-prone, time consuming, expensive, highly subjective, and unduly increases the doctor-patient contact time.
Furthermore, patients are at risk for unnecessary toxicity from exposure to high levels of drug, or for receiving suboptimal or ineffective levels of treatment from insufficient levels of drug.

Method used


Image

  • Methods and compositions for therapeutic drug monitoring and dosing by point of care pharmacokinetic profiling
  • Methods and compositions for therapeutic drug monitoring and dosing by point of care pharmacokinetic profiling
  • Methods and compositions for therapeutic drug monitoring and dosing by point of care pharmacokinetic profiling

Examples


example 1

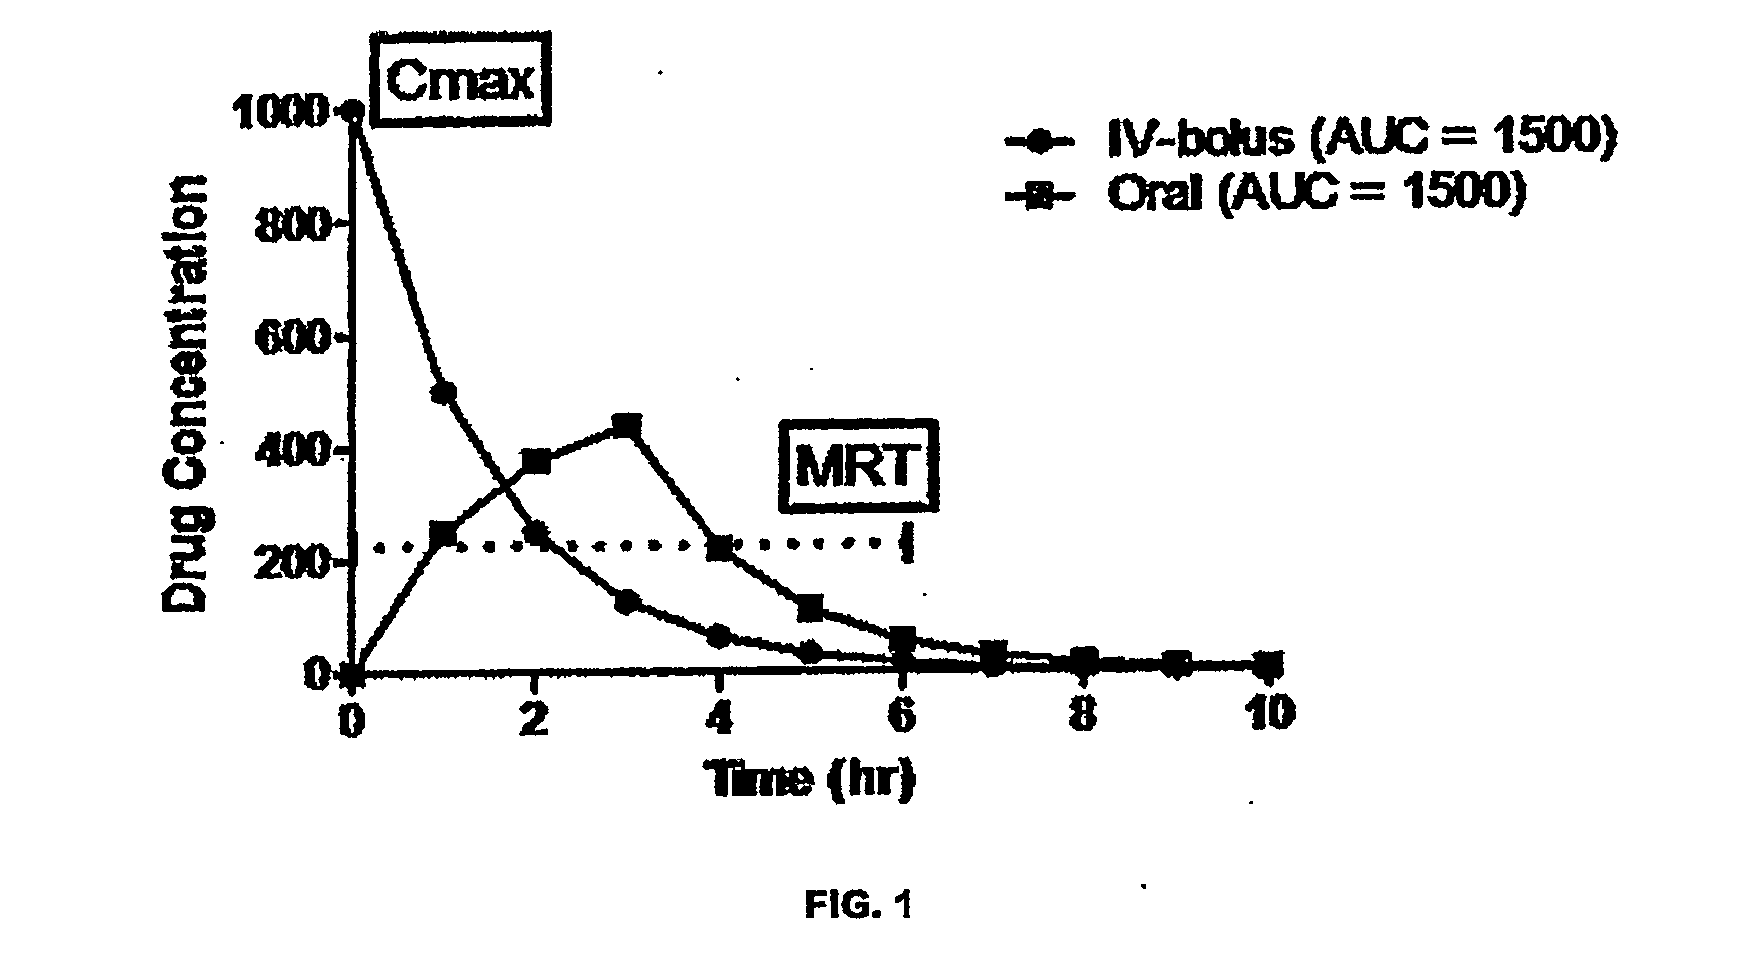
[0061]Theoretical PK profiles are shown in FIG. 1. As shown in FIG. 1, the PK profile has two principal components—the uptake portion of the curve immediately after administration and the decay / clearance part of the curve after maximum blood concentration (Cmax). This theme varied from immediate Cmax with bolus administration to delayed Cmax with oral administration. In between are intravenous infusion, intranasal, intrabuccal, intramuscular, intraperitoneal, etc. The three main characteristics of PK profile are: Cmax (maximum blood concentration), Mean Residence Time (MRT), and AUC (Area Under Curve). AUC is commonly used to indicate blood exposure. However, two curves with similar AUCs, as depicted in FIG. 1, can have very different profiles. The intravenous bolus dosing exhibits high initial blood concentration as define by Cmax=Dose / blood volume. The oral dosing exhibits long residence time of the drug due to delayed absorption. Pharmaceutical development normally relies on expe...

example 2

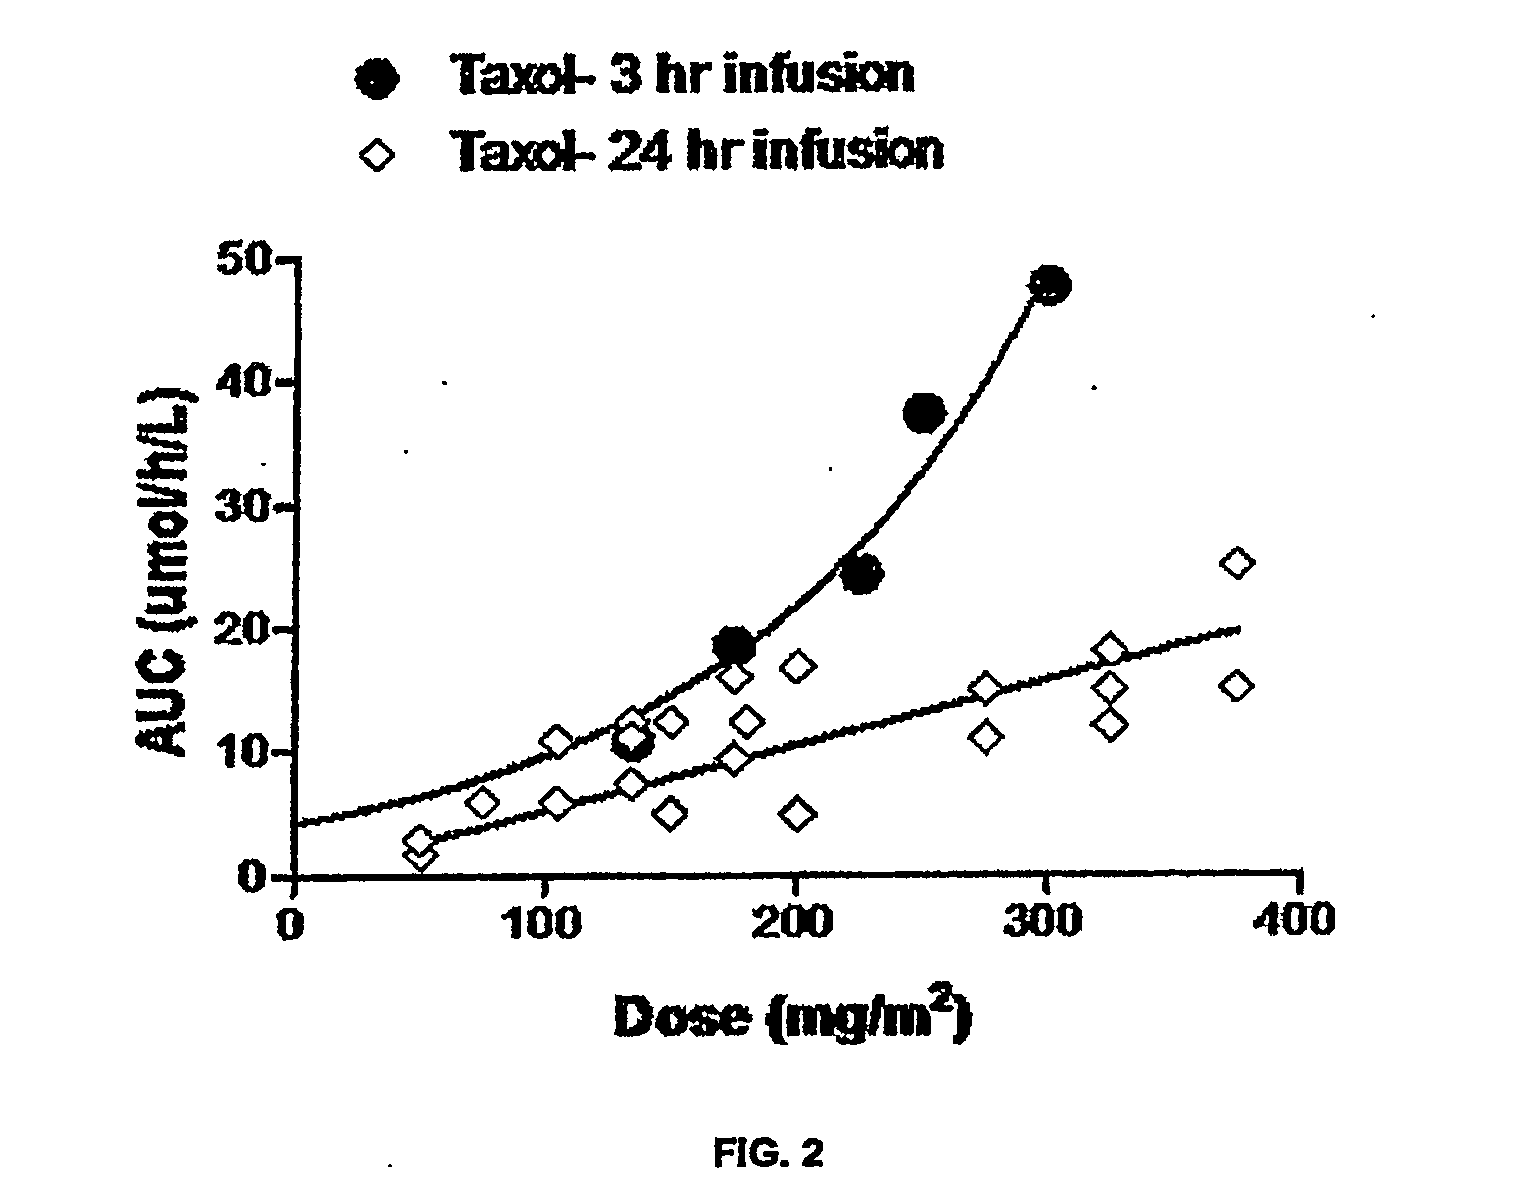
[0062]To demonstrate that simply changing the intake of drug would change the PK profile, we examined PK profile of Taxol dosed at 3 hr. infusion rate and a slower 24 hr. infusion rate using published pharmacokinetic data for Taxol (Ohtsu T, Sasaki Y, Tamura T, Miyata Y, Nakanomyo H, Nishiwaki Y, Saijo N. (1995) Clinical pharmacokinetics and pharmacodynamics of paclitaxel: a 3-hour infusion versus a 24-hour infusion. Clin Cancer Res. 1:599-606.; Wiemik P H, Schwartz E L, Einzig A, Strauman J J, Lipton R B, Dutcher J R (1987) Phase I trial of taxol given as a 24-hour infusion every 21 days: responses observed in metastatic melanoma. J Clin Oncol. 5:1232-9.; Tamura T, Sasaki Y, Eguchi K, Shinkai T, Ohe Y, Nishio M, Kunikane H, Arioka H, Karato A, Omatsu H, et al. (1994) Phase I and pharmacokinetic study of paclitaxel by 24-hour intravenous infusion. Jpn J Cancer Res. 85:1057-62.; Tamura T, Sasaki Y, Nishiwaki Y, Saijo N. (1995) Phase I study of paclitaxel by three-hour infusion: hypot...

example 3

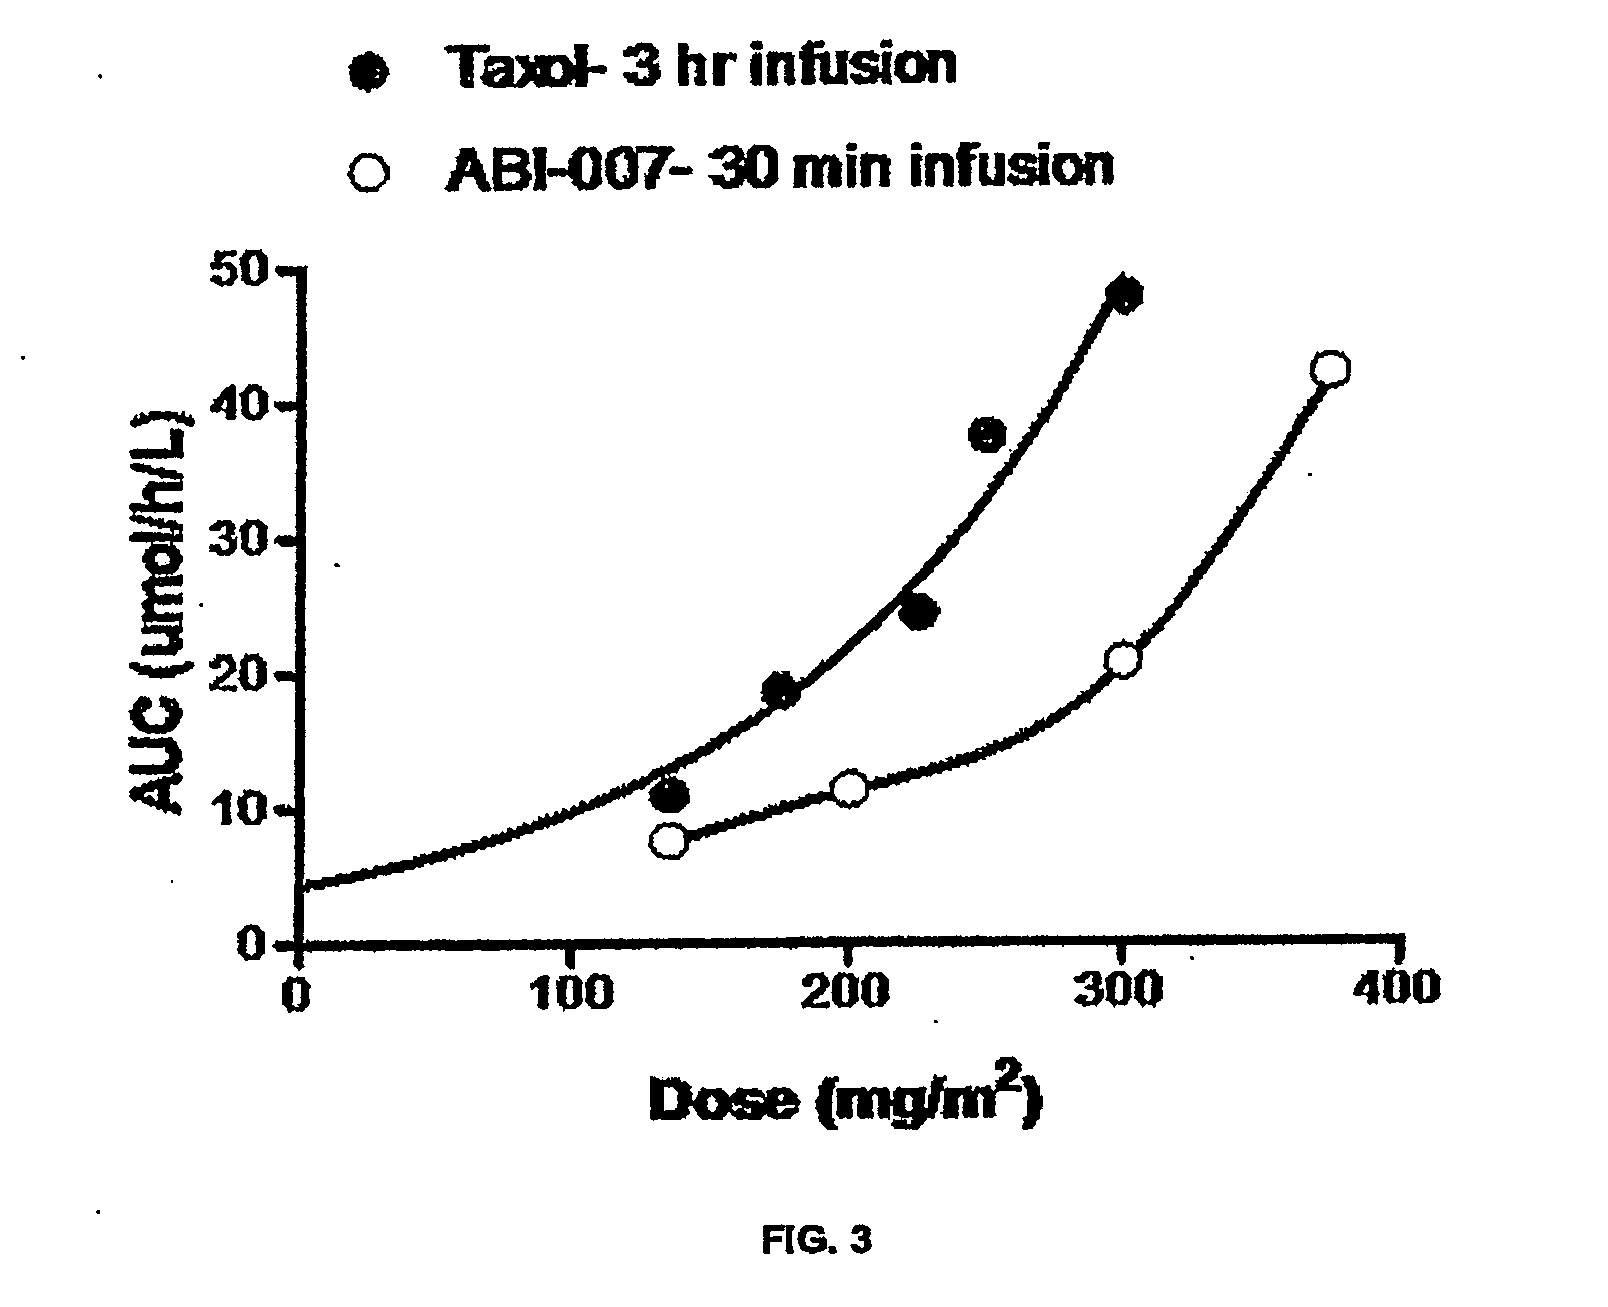
[0063]To demonstrate that an increase in tissue distribution rate and therefore a decrease in the rate of drug accumulation in blood would alter the PK profile, we examined the PK profile of Abraxane versus Taxol. As shown in FIG. 3, paclitaxel formulated as Abraxane (ABI-007) exhibited lower AUC than paclitaxel formulated as Taxol (Cremophor EL). The increase in AUC with faster uptake / infusion (30 min infusion for Abraxane versus 3 hr infusion for Taxol) was not observed. Abraxane® (albumin-bound paclitaxel, Abraxis BioSciences)—FDA approval in 2005 for metastatic breast cancer. It is known that Abraxane formulation resulted in faster tissue penetration—a property that is known to varied from individual to individual dependent on their level of paclitaxel binding proteins and others. This again exemplified that PK profiling—the use of totality of PK data—is more suitable for therapeutic drug monitoring. We found the same with other Cremophor free formulation such as Genexol (FIG. 4...


PUM

PropertyMeasurementUnit
timeaaaaaaaaaa
timeaaaaaaaaaa
timeaaaaaaaaaa

Abstract

Disclosed are methods and kits for pharmacokinetic profiling employing point-of-care or point of service self-sampling and allowing for dosage adjustments based on the pharmacokinetic profiles.

Description

CROSS-REFERENCE TO RELATED APPLICATIONS[0001]This US non-provisional application claims the benefit of PCT / US2012 / 039993 which claims the benefit of priority to U.S. Provisional Applications Nos. 61 / 491,268, filed May 30, 2011, 61 / 514,488, filed Aug. 3, 2011, 61 / 526,950, filed Aug. 24, 2011, 61 / 533,250, filed Sep. 11, 2011, 61 / 577,008, filed Jan. 3, 2012, 61 / 606,371, filed Mar. 3, 2012, 61 / 615,312, filed Mar. 25, 2012, and 61 / 635,730, filed Apr. 19, 2012, each of which is incorporated by reference in its entirety.BACKGROUND OF THE INVENTION[0002]Personalized medicine as it applies to tailoring treatment of an individual patient with therapeutic agents has a pharmacokinetics (PK) component where drug dose is optimized to the patient and a pharmacodynamics (PD) component where the treatment modality is matched to the patient. The treatment modality requires the understanding of the mechanism of action and mechanism of resistance. The identification of PD biomarkers has been the focus ...

Claims


Application Information

Patent Timeline
Patent Type & Authority Applications(United States)
IPC IPC(8): G01N33/94G01N33/53
CPCG01N33/5308G01N33/94G01N33/558A61K31/337G01N33/54388
Inventor TRIEU, VUONG NGOC
Owner AUTOTELIC
Why Eureka
Try Eureka