
System and method to manage diabetes based on glucose median, glucose variability, and hypoglycemic risk

a diabetes and median technology, applied in the field of system and method to manage diabetes based on glucose median, glucose variability, and hypoglycemic risk, can solve the problem that decision-making based on those reports and analyses can still be a challeng

Active Publication Date: 2014-11-27
ABBOTT DIABETES CARE INC
View PDF0 Cites 92 Cited by
  • Summary
  • Abstract
  • Description
  • Claims
  • Application Information

AI Technical Summary

Benefits of technology

The present invention provides a system and method for analyzing glucose data to determine patterns and create a glucose report for treatment purposes. The system includes a memory with a glucose data processing program and a processor to analyze the data and produce a display. The processor identifies the glucose data as falling within one of three categories, likelihood of low glucose, likelihood of average glucose, or likelihood of high glucose levels. The system then calculates a glucose control measure based on the likelihood of each category, which can include suggestions for controlling an insulin pump or other glucose-lowering medications. The technical effects include providing a tool for healthcare professionals to better understand and manage diabetic patients' glucose levels, as well as offering a way for patients to better understand and control their own diabetes.

Problems solved by technology

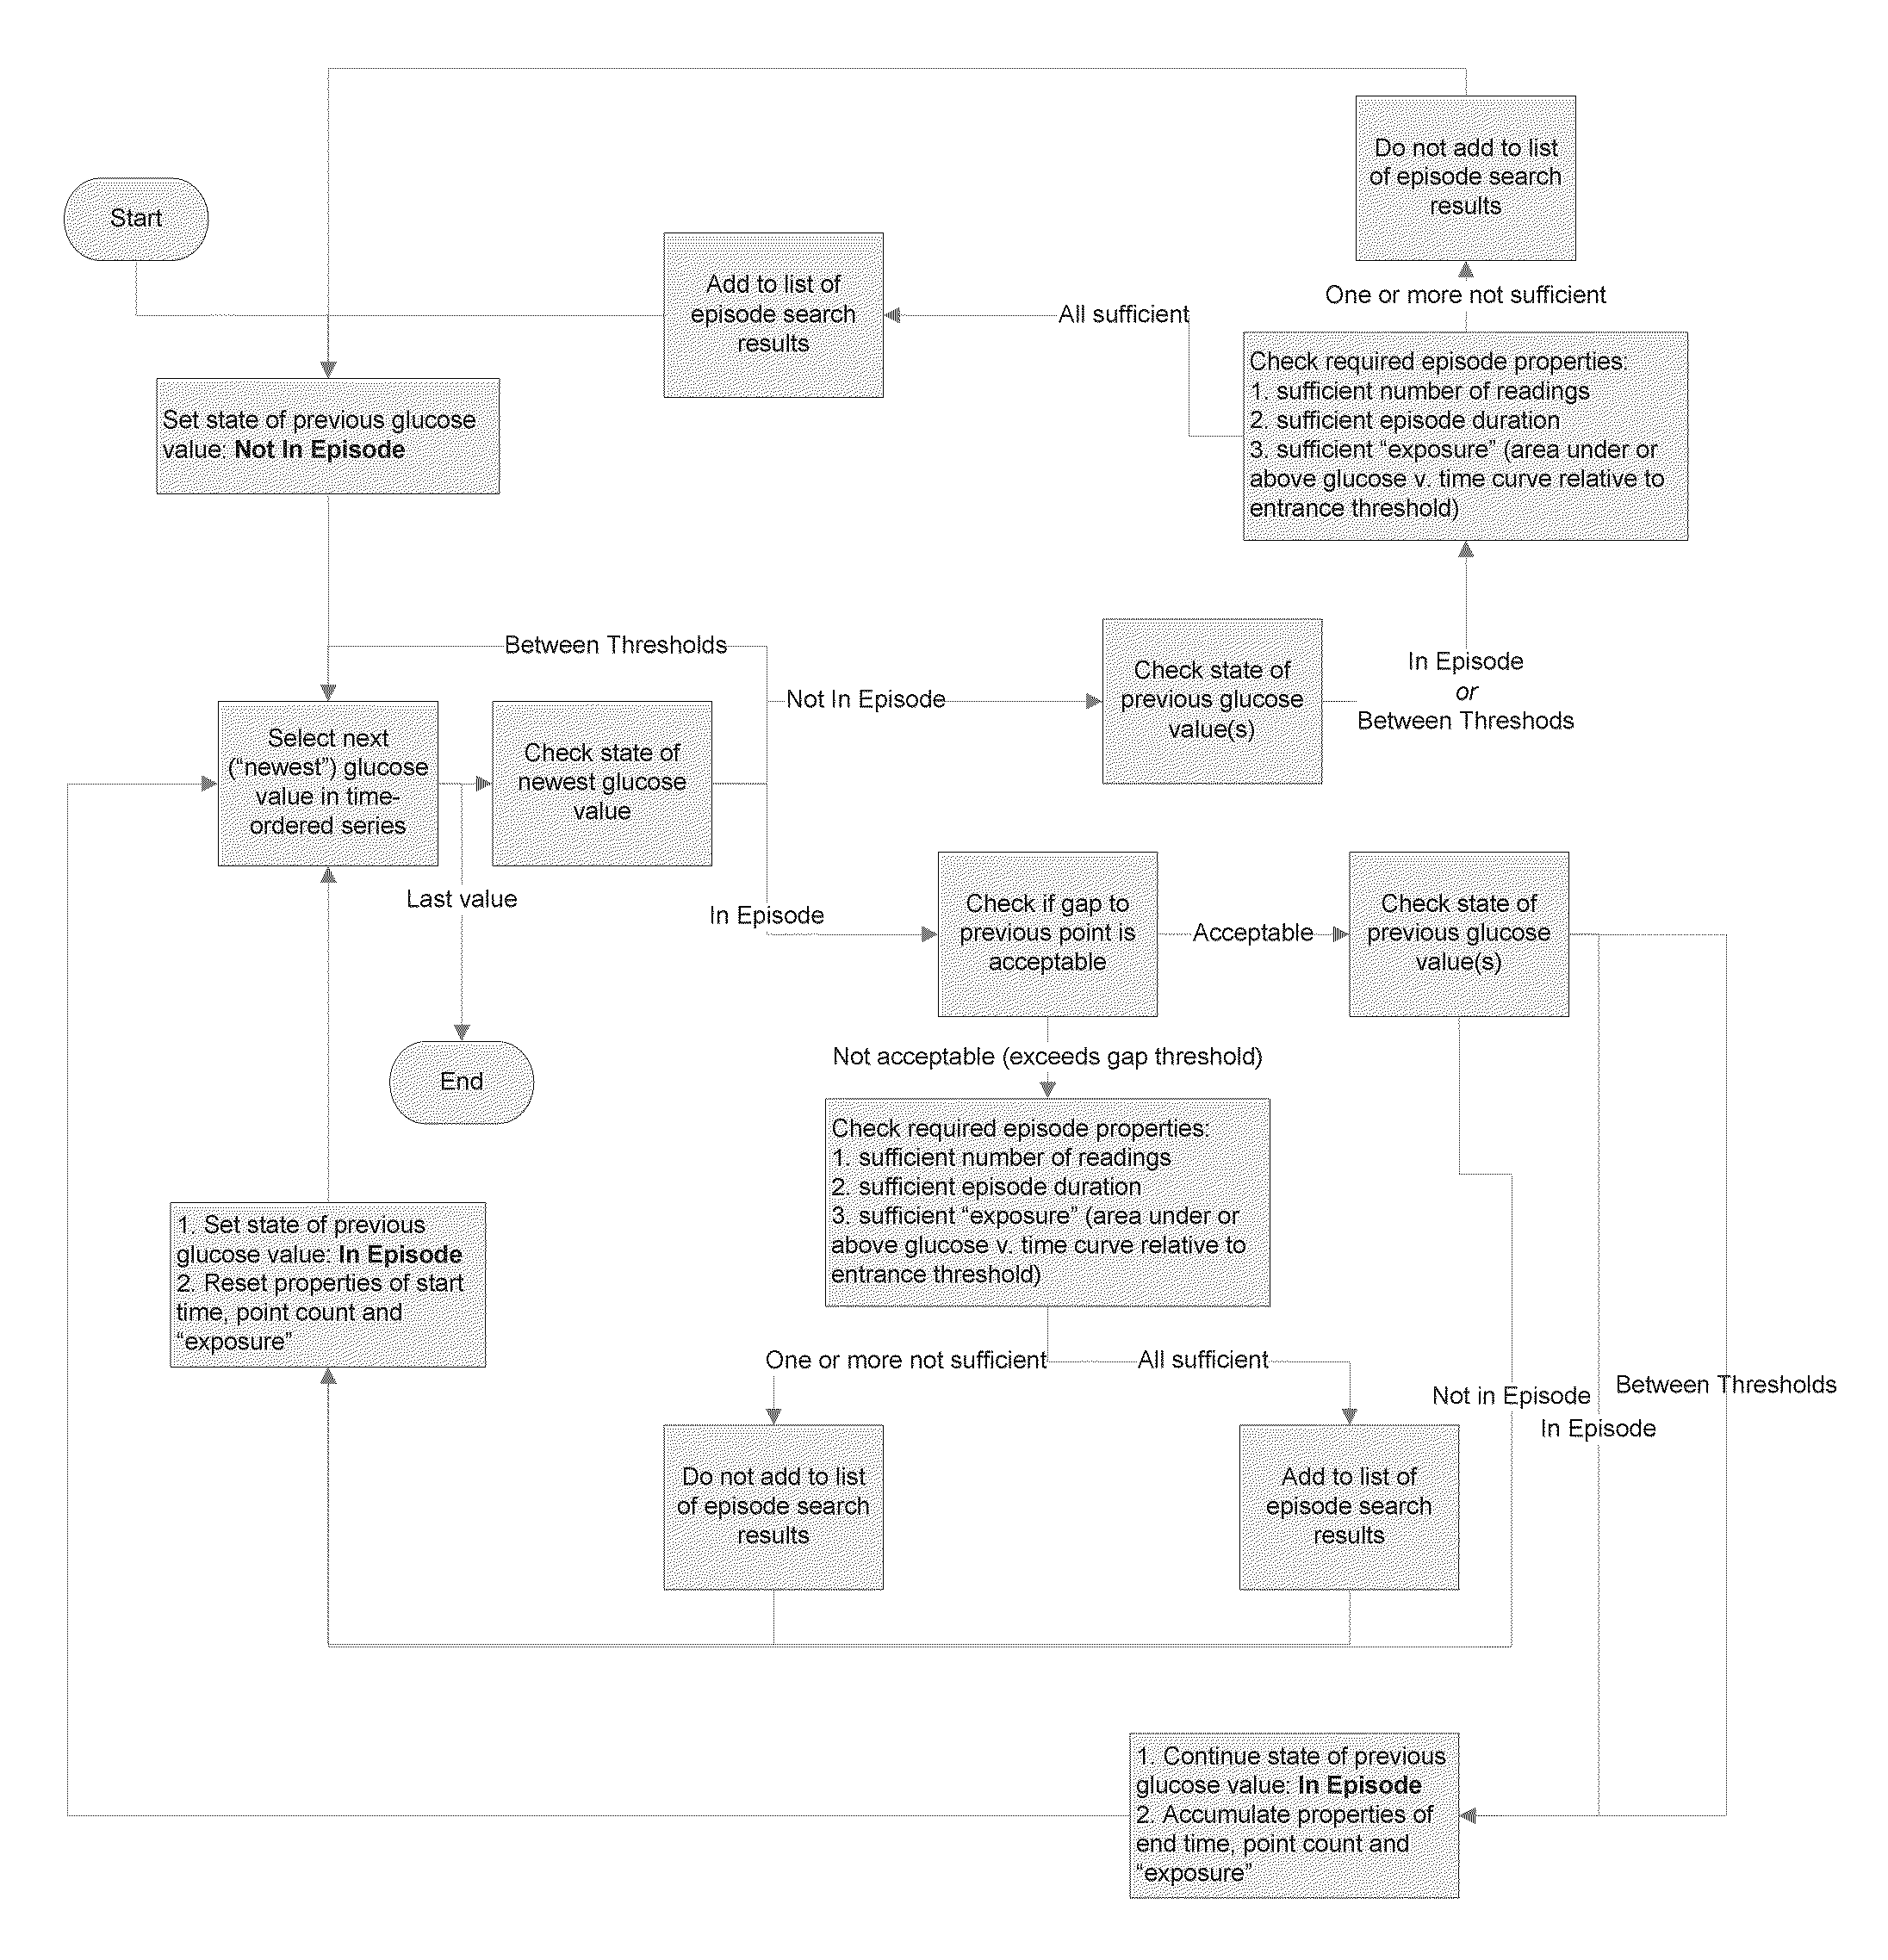
However, a challenge inherent to analysis of this influx of data is to represent it in a clinically meaningful manner that enables efficient clinical action.
Although present glucose reports have provided a way to analyze the influx of data from CGM, decision-making based on those reports and analyses can still be a challenge.

Method used


Image

  • System and method to manage diabetes based on glucose median, glucose variability, and hypoglycemic risk
  • System and method to manage diabetes based on glucose median, glucose variability, and hypoglycemic risk
  • System and method to manage diabetes based on glucose median, glucose variability, and hypoglycemic risk

Examples


first embodiment

[0206]The advantage of using the MTT is that it not only provides the direction of the titration (increase or decrease) but also amount of the titration, in the form of desired glucose median change. Since the glucose for different diabetes patients responds differently for a given change in insulin dosage, the MTT cannot be used directly to drive titration amount. Another aspect of this invention is that the titration algorithm will learn how a change in insulin affects the median glucose for a specific patient, and will use this measured affect to convert the MTT to a specific insulin change amount. In the first embodiment, the first titration amount may be preset to correspond to a conservative value defined by predetermined patient information such as patient weight or known insulin sensitivity, or it may be defined as a conservative value based on a worse case physiological model of a patient (that is, the most insulin sensitive). For a subsequent titration, the insulin titrati...

second embodiment

[0212]In the second embodiment, estimation of the ITS value for the next titration period is obtained from the moving average of N past computed ITS values:

γ ^ ( k + 1 ) := 1 N ∑ j = k - N k γ ( j ) , ...

second third embodiment

[0214]In the second third embodiment, the estimation of the ITS value for the next titration period is obtained from the projected straight line Least-Squares (LS) Error fit of N past computed ITS values (FIG. 37). In other words, the next insulin dose is calculated by using Eqn. 4, where the next ITS value is determined by the projected LS error fit as illustrated in FIG. 37, and the next MTT is determined by the control grid.

Using MTT to Provide Fixed Step Dose Changes


PUM

PropertyMeasurementUnit
start timeaaaaaaaaaa
timeaaaaaaaaaa
distanceaaaaaaaaaa

Abstract

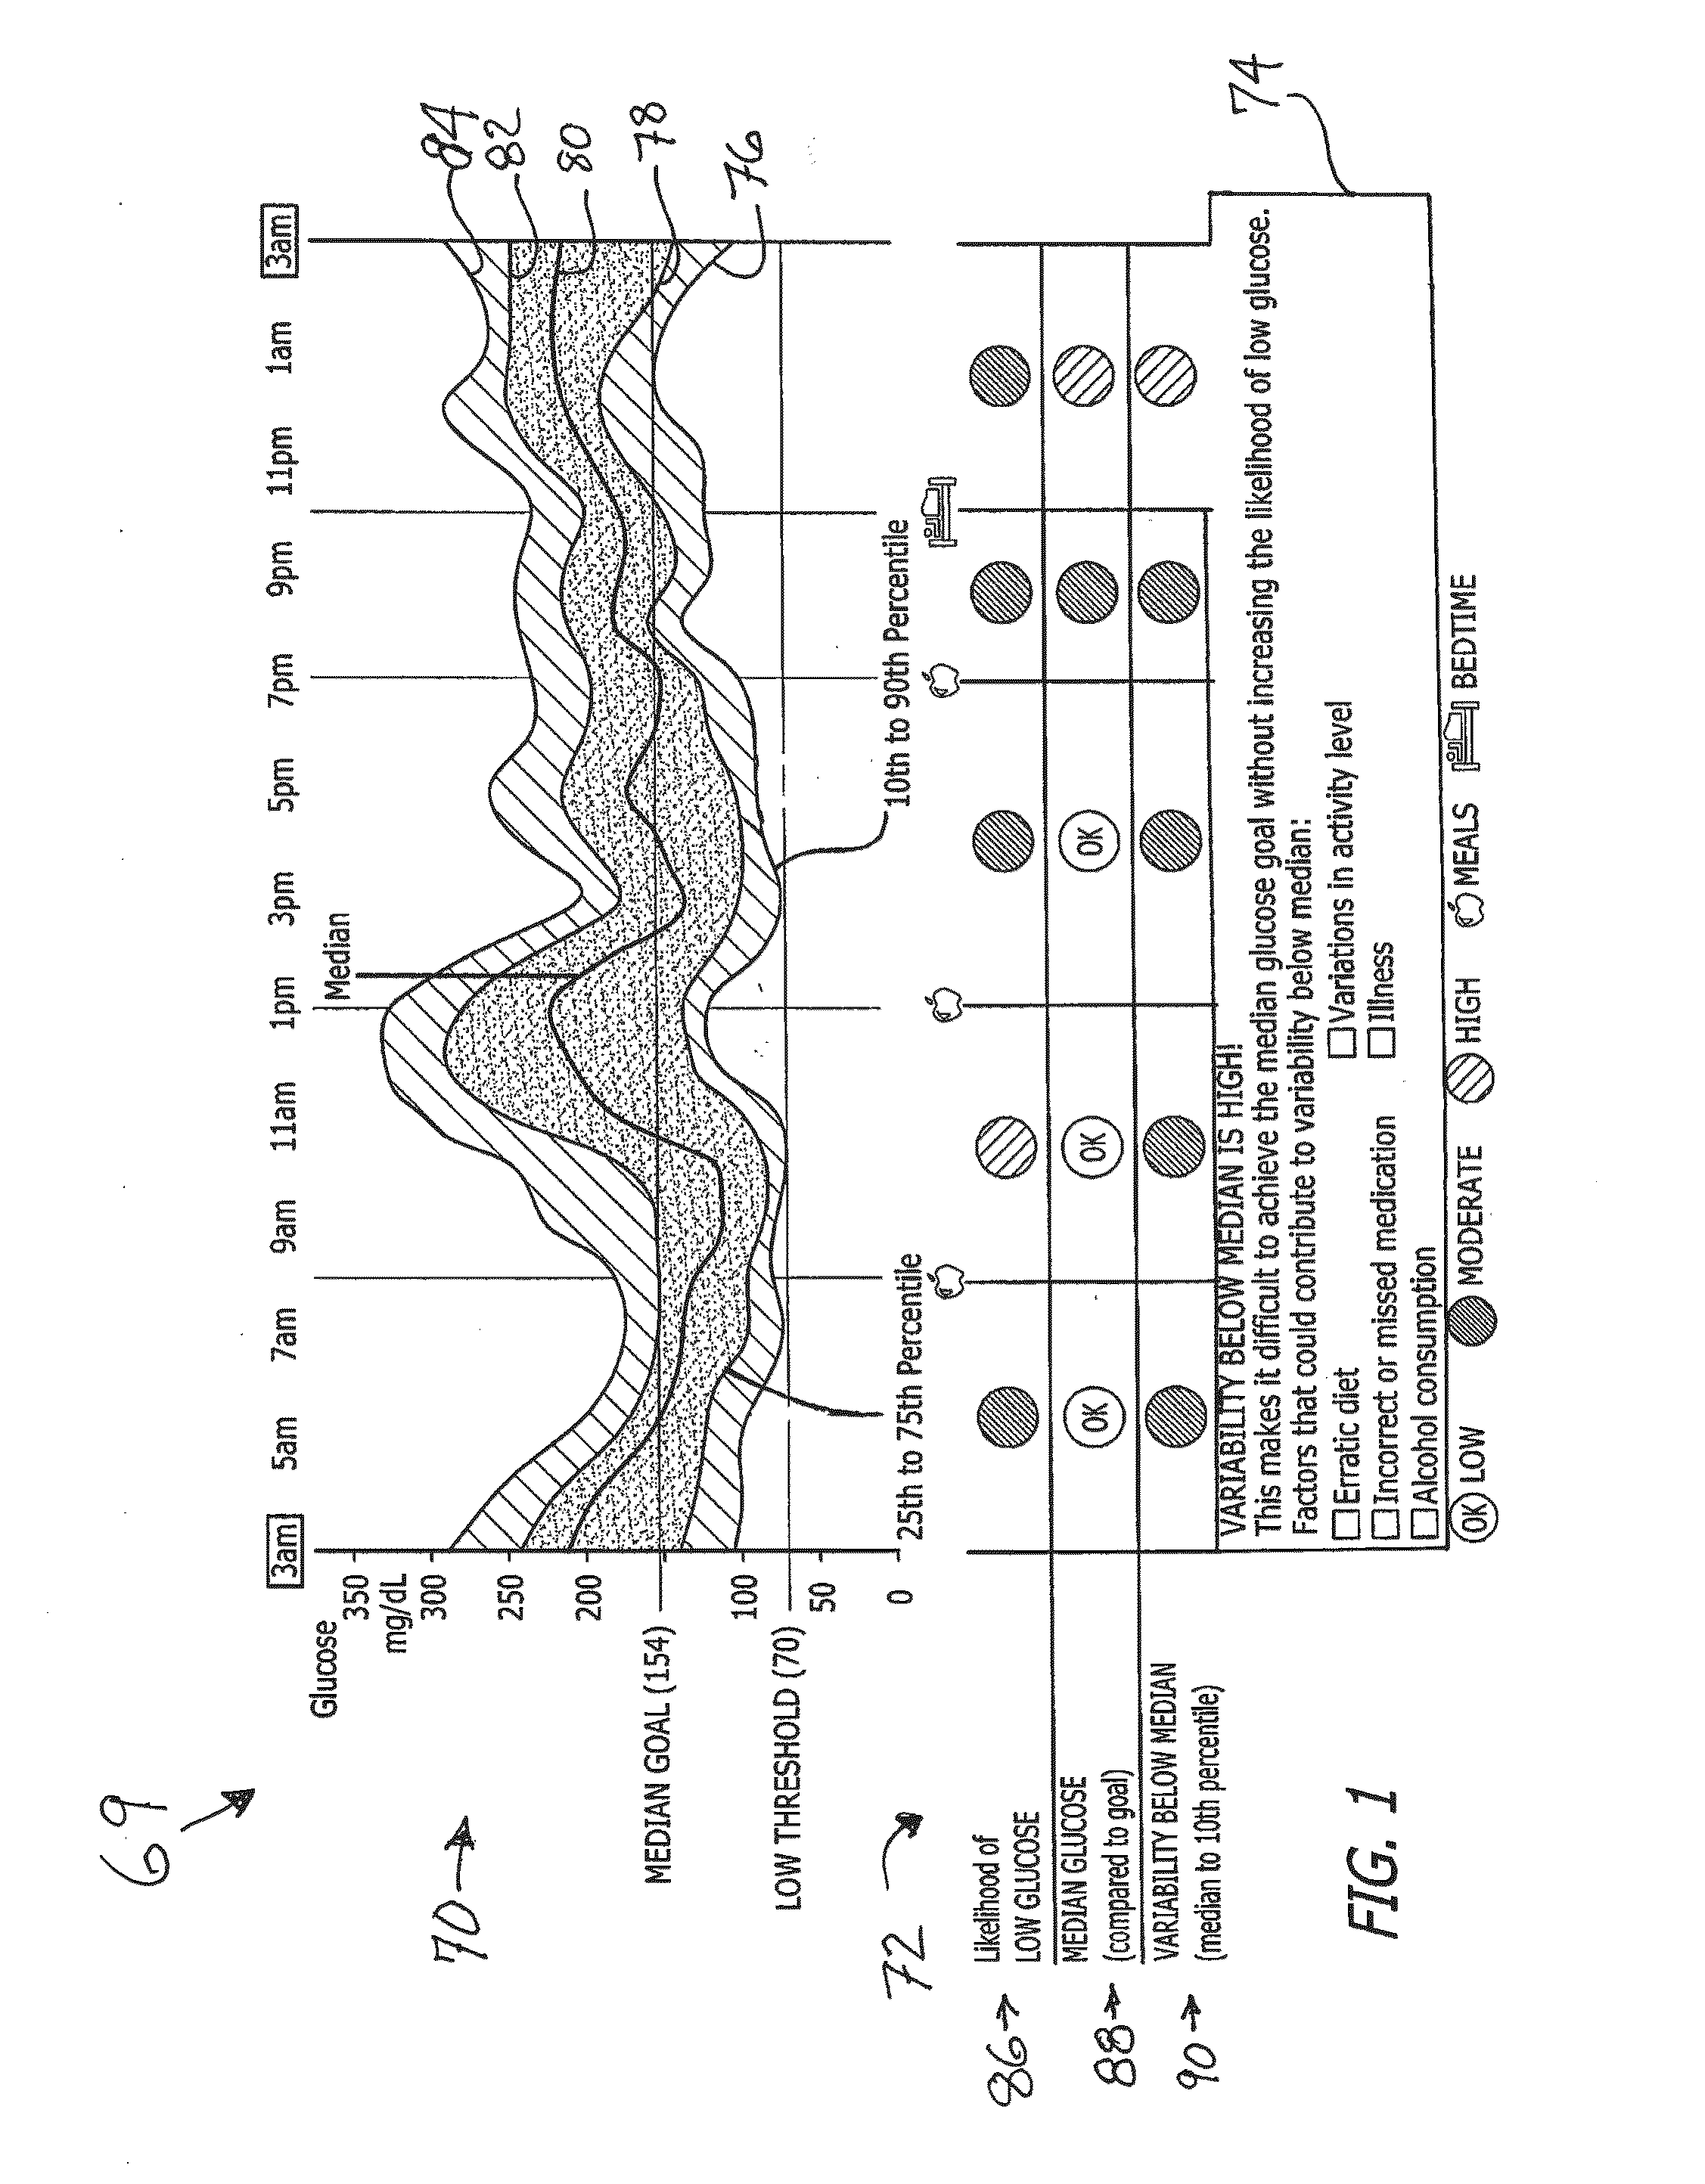
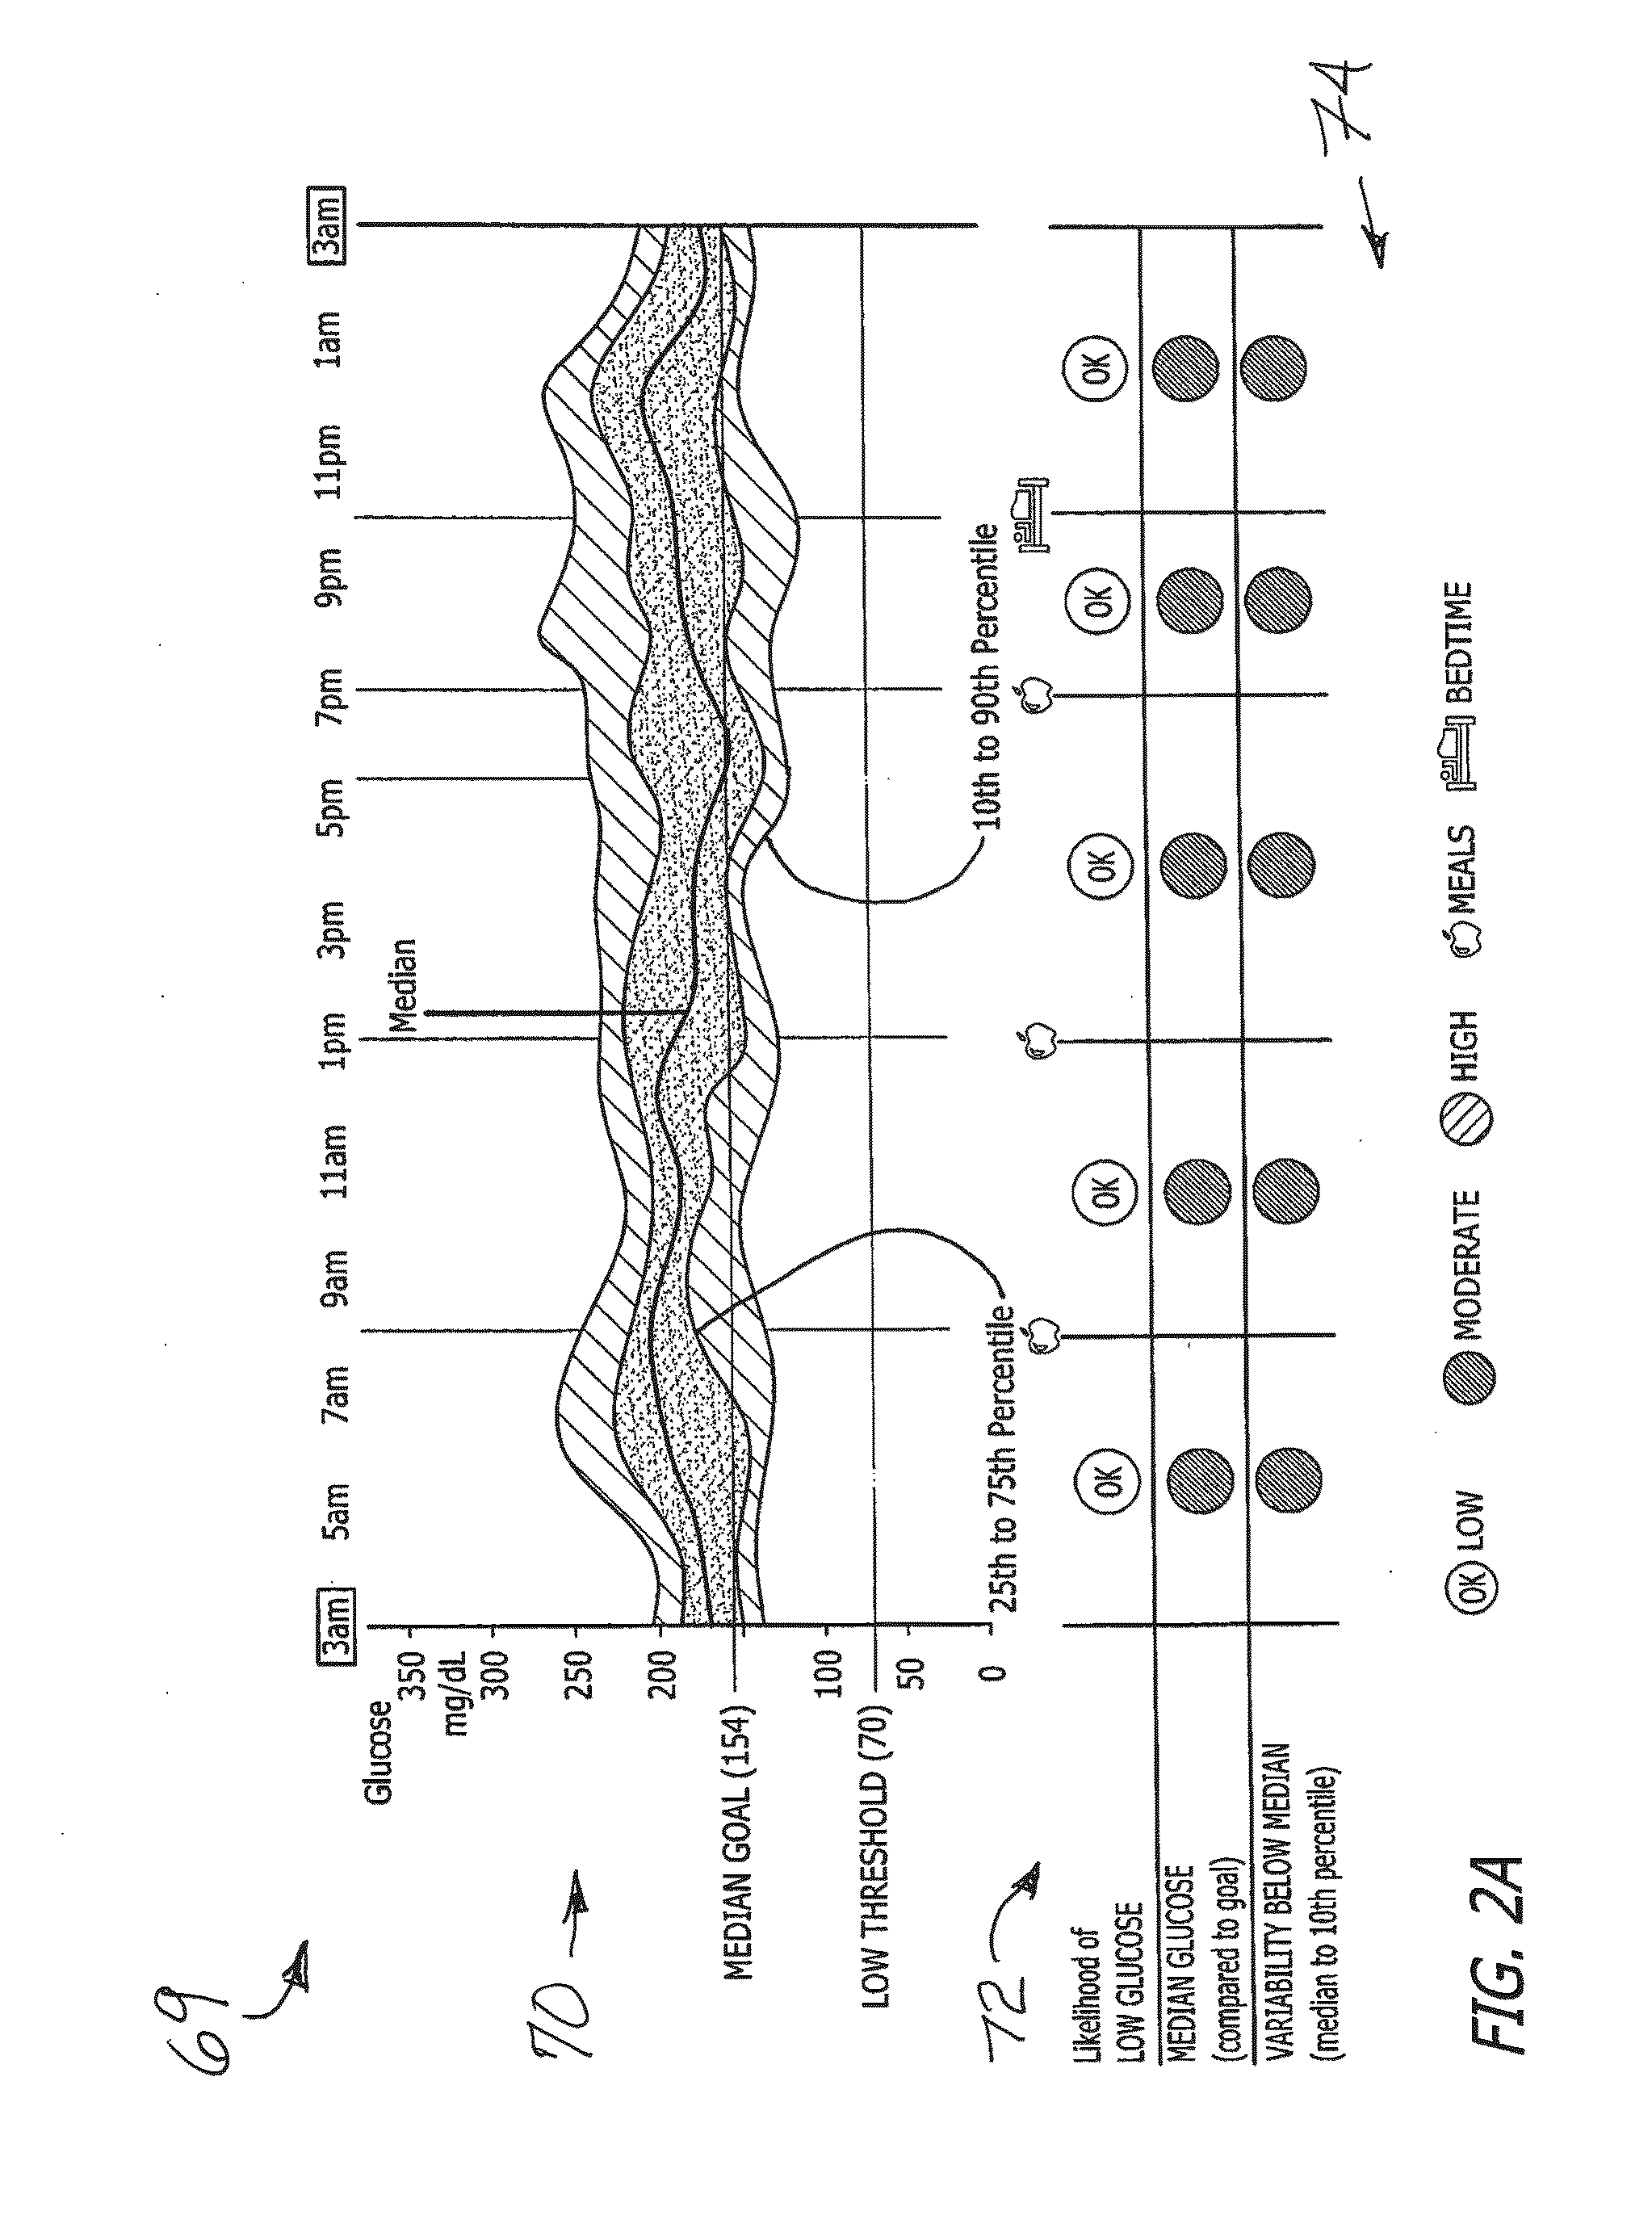
A system and method provides a glucose report for determining glycemic risk based on an ambulatory glucose profile of glucose data over a time period, a glucose control assessment based on median and variability of glucose, and indicators of high glucose variability. Time of day periods are shown at which glucose levels can be seen. A median glucose goal and a low glucose line provide coupled with glucose variability provide a view into effects that raising or lowering the median goal would have. Likelihood of low glucose, median glucose compared to goal, and variability of glucose below median provide probabilities based on glucose data. Patterns can be seen and provide guidance for treatment.

Description

CROSS-REFERENCES TO RELATED APPLICATIONS[0001]This application claims the benefit of provisional application 61 / 922,765, filed Dec. 31, 2013, and of provisional application 61 / 799,139, filed Mar. 15, 2013, incorporated herein by reference.BACKGROUND[0002]Achieving euglycemia can be hampered by episodes of hypoglycemia and glucose variability which can now be tracked by continuous glucose monitoring (“CGM”). CGM devices have been shown to be clinically accurate in recording hypoglycemia, and can be used to assess diurnal patterns of glycemia. However, a challenge inherent to analysis of this influx of data is to represent it in a clinically meaningful manner that enables efficient clinical action. There is a need for glucose reports that can provide standardized, efficient output to effectively guide therapeutic decision making. Key benefits of glucose reports include a consistent view of glucose trends and patterns over the day, and showing the detail that A1C cannot. The identifica...

Claims


Application Information

Patent Timeline
Patent Type & Authority Applications(United States)
IPC IPC(8): A61B5/00G06F19/00G01N33/66A61B5/145G16H50/30
CPCA61B5/7275A61B5/14532A61B5/7282G01N33/66A61B5/4848G06F19/34A61B5/742A61B5/746A61B5/4836G16H50/30G16H15/00G16Z99/00G16H20/10
Inventor BUDIMAN, ERWIN S.HAYTER, GARY A.DONIGER, KENNETH J.DUNN, TIMOTHY C.CROUTHER, NATHAN C.BERMAN, GLENN H.WOLPERT, HOWARD A.
Owner ABBOTT DIABETES CARE INC
Learn More