METHOD OF DETERMINATION OF RISK OF 2 HOUR BLOOD GLUCOSE EQUAL TO OR GREATER THAN 140 mg/Dl

a blood glucose and risk technology, applied in the field of clinical diagnostics, can solve the problems of complicated and laborious mathematical calculations that need to be performed, and achieve the effect of improving clinical outcomes

Active Publication Date: 2015-01-22
TRUE HEALTH IP LLC
View PDF3 Cites 2 Cited by
  • Summary
  • Abstract
  • Description
  • Claims
  • Application Information

AI Technical Summary

Benefits of technology

[0008]The embodiments of this invention provide a diagnostic tool to clinicians that enable the prediction of likelihood of impaired glucose tolerance as defined by a 2-hour OGTT blood glucose level of ≧140 mg / dL. An algorithm is used herein based on a combination of 3 or more specific classes of analytes, each with a distinct and different physiological role in the complex interplay of factors that determine normal or abnormal glucose tolerance. This algorithm has a clinical utility in identifying, in a single fasting sample, individuals who are highly likely to have an abnormally high 2-hour glucose if an OGTT were to be performed, and thus can serve as a proxy or replacement for the OGTT measurement. This algorithm also enables reclassification of NGT to IGT, and IGT to NGT, thus enabling correct assessment of glucose tolerance and risk of cardiodiabetic disease and comorbidities. The diagnostic tool therefore enables healthcare professionals to select treatment protocols for optimal therapeutic intervention and improved clinical outcomes.

Problems solved by technology

Most OGTTs and CLIX scoring require a patient to remain in the doctor's office for 2 hours post dose, and most clinicians only test baseline samples and compare to the testing at the 2 hour time point, not the labor-intensive additional blood draws for 3-5 times during the 2-hour period necessary for the CLIX scoring, due to labor and cost constraints.
Moreover, complicated and laborious mathematical calculations need to be performed in order to optimize detection of at-risk individuals with these techniques.

Method used


Image

  • METHOD OF DETERMINATION OF RISK OF 2 HOUR BLOOD GLUCOSE EQUAL TO OR GREATER THAN 140 mg/Dl
  • METHOD OF DETERMINATION OF RISK OF 2 HOUR BLOOD GLUCOSE EQUAL TO OR GREATER THAN 140 mg/Dl
  • METHOD OF DETERMINATION OF RISK OF 2 HOUR BLOOD GLUCOSE EQUAL TO OR GREATER THAN 140 mg/Dl

Examples


example 1

Clinical Study and Statistical Models

Clinical Study

[0102]The clinical study included 219 subjects who had not been diagnosed with diabetes, but with one or more of the following clinical indications: obesity, history of first-degree family members with diabetes, and presence of one or more components of the metabolic syndrome including impaired fasting glucose.

[0103]The subjects underwent a 75 g oral glucose tolerance test (OGTT) and fasting blood collection to evaluate risk of diabetes between March 2012 and May 2013 at several outpatient centers across the US (Madison, Wis.; Jackson, Miss.; Montgomery, Ala.; Charleston, S.C.; Seattle, Wash.; and Salt Lake City, Utah). The clinical indications for testing Patients who tested positive for Anti-GAD autoantibody (titer >5 IU / ml) were excluded from this study regardless of T1DM or LADA status. The study protocol was approved by Copernicus Group IRB (NC).

[0104]Samples were sent by overnight courier to Health Diagnostic Laboratory, Inc. ...

example 2

Predicting the Likelihood of Impaired Glucose Tolerance (IGT) Through Combining the Biomarkers of Free Fatty Acid (FFA), C-Peptide, Alpha Hydroxybutyrate (AHB), Ferritin, Linoleoyl-GPC (LGPC), and Adiponectin

[0111]In this example, the OGTT fasting score was calculated combining the measured values for free fatty acid [mmol / L], C-peptide [ng / mL], alpha hydroxybutyrate [μg / mL], ferritin [ng / mL], linoleoyl-GPC [μg / mL], and adiponectin [μg / mL] from a patient sample.

[0112]The samples had previously been analyzed for the values of the area under the curve (AUC) for C-peptide and free fatty acid respectively, which, when multiplied together, strongly correlated with the IGT determined by a 2-hour OGTT.

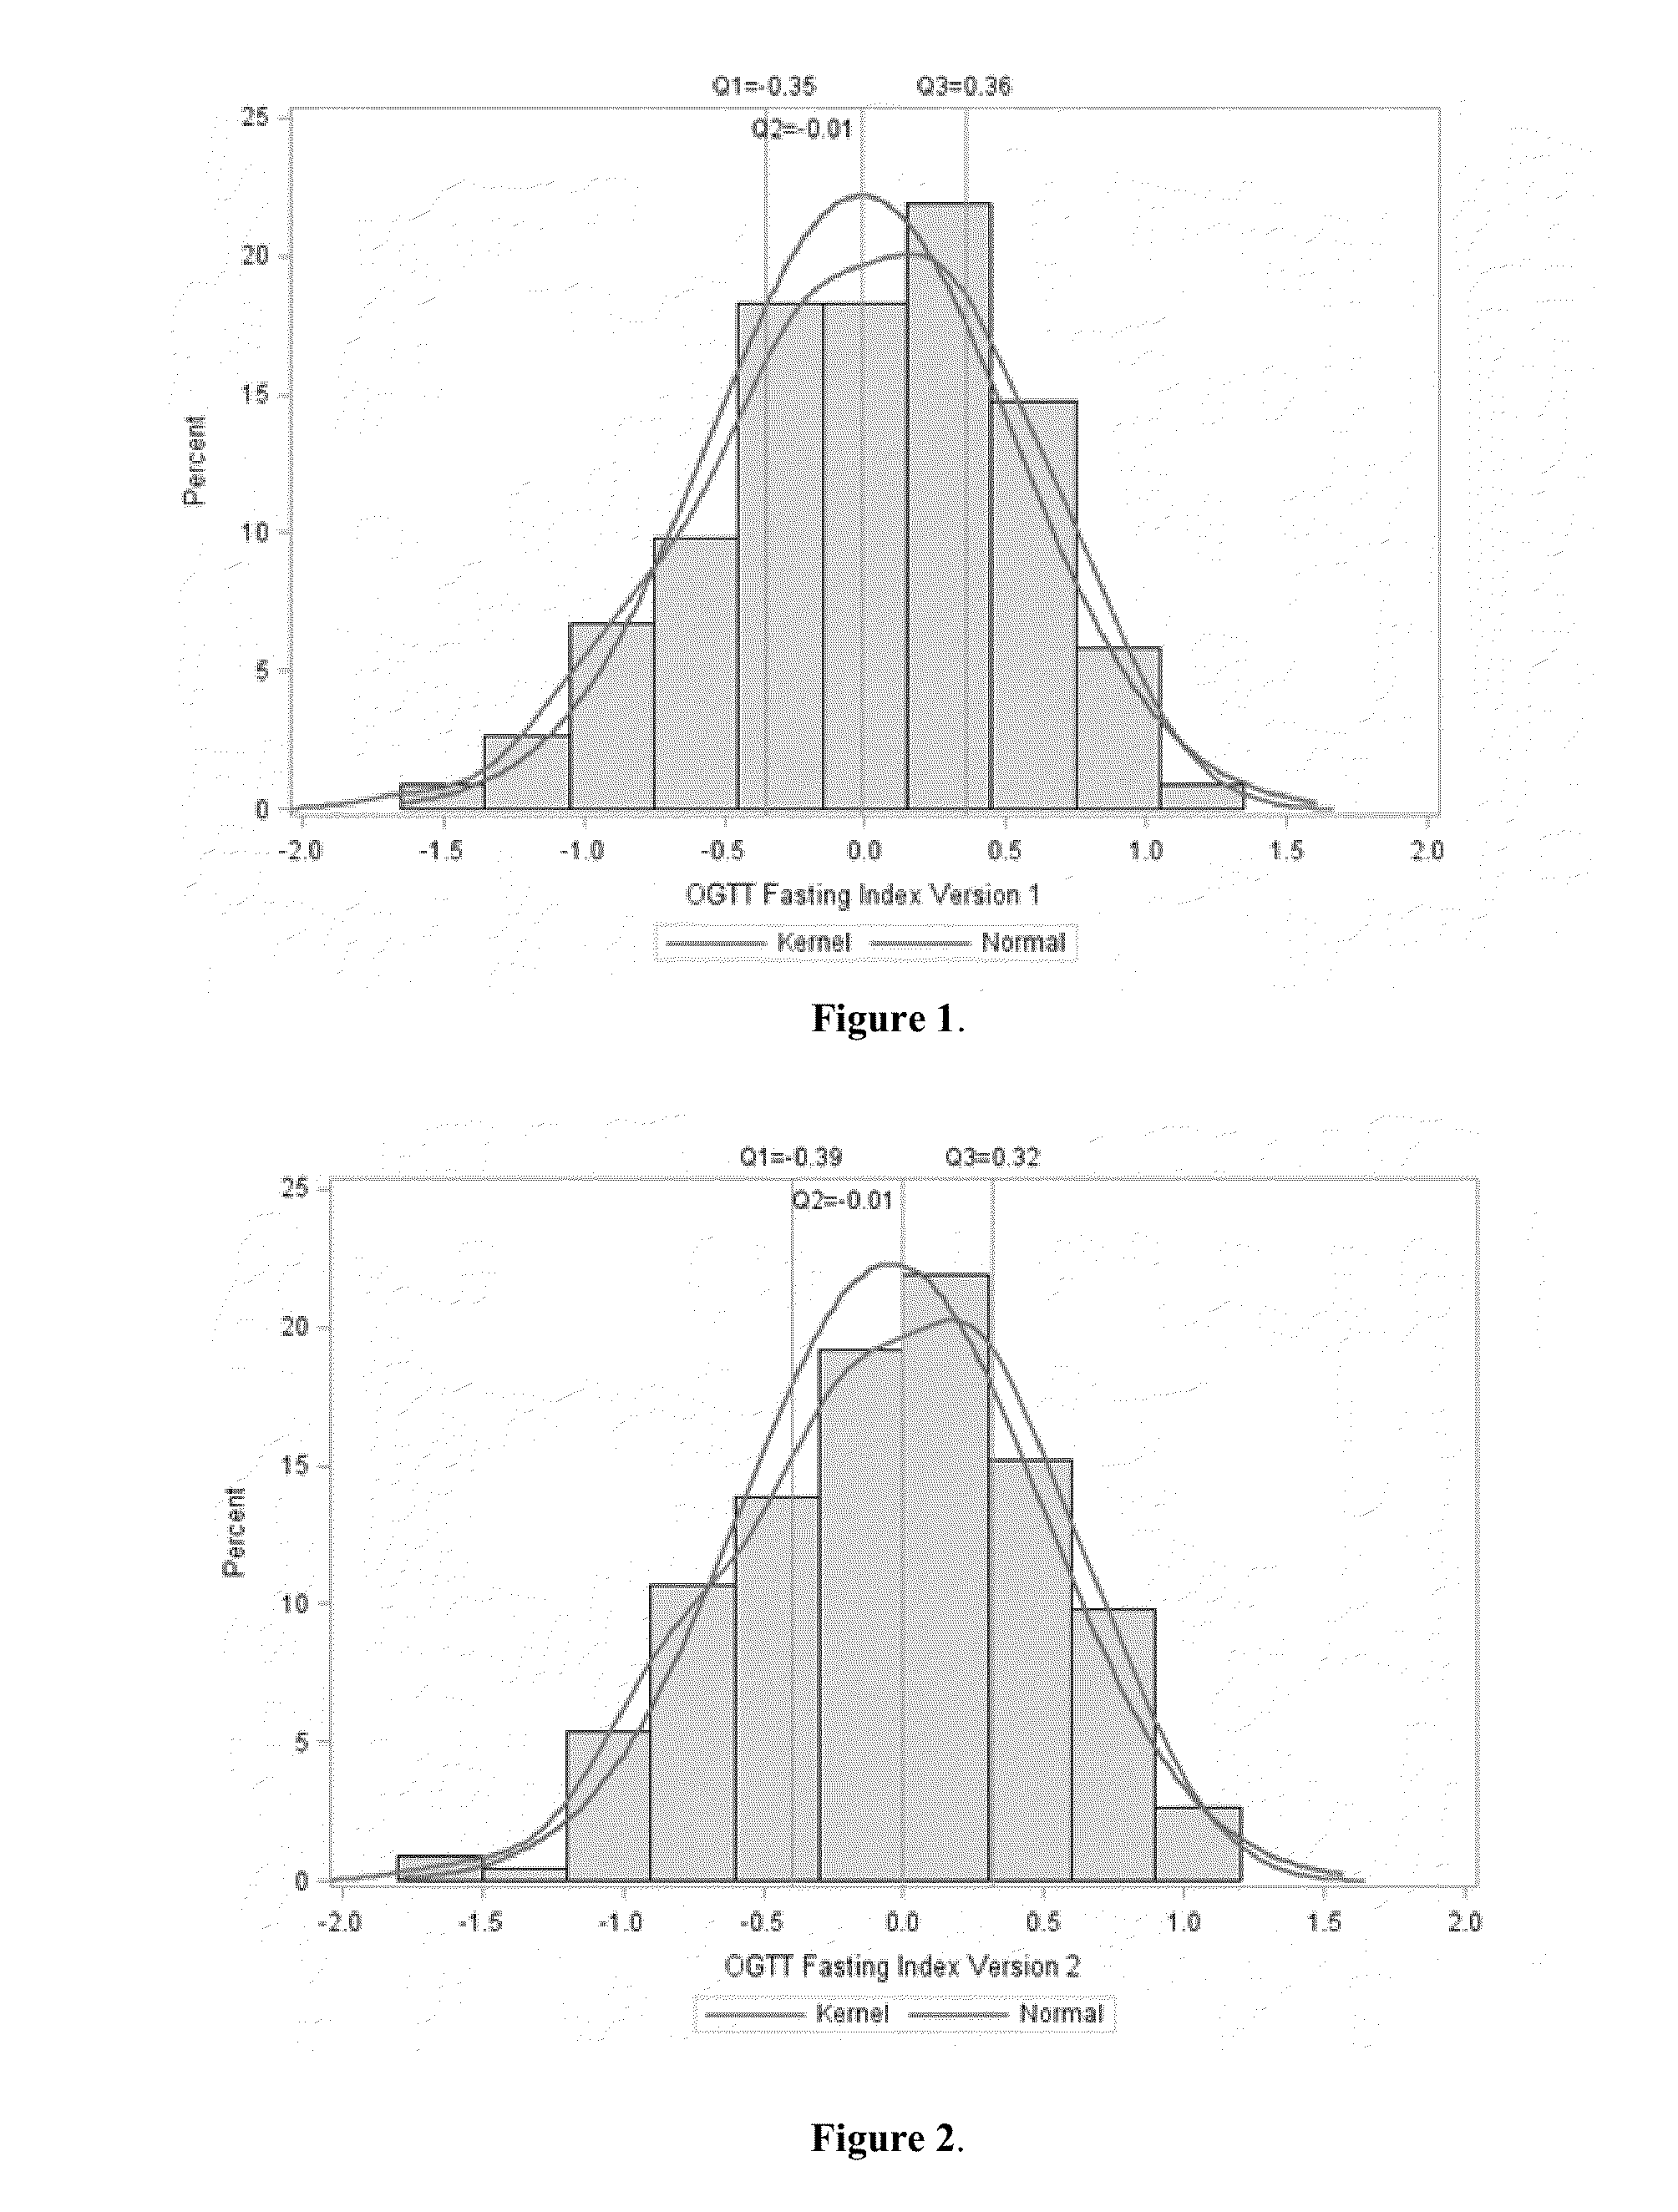
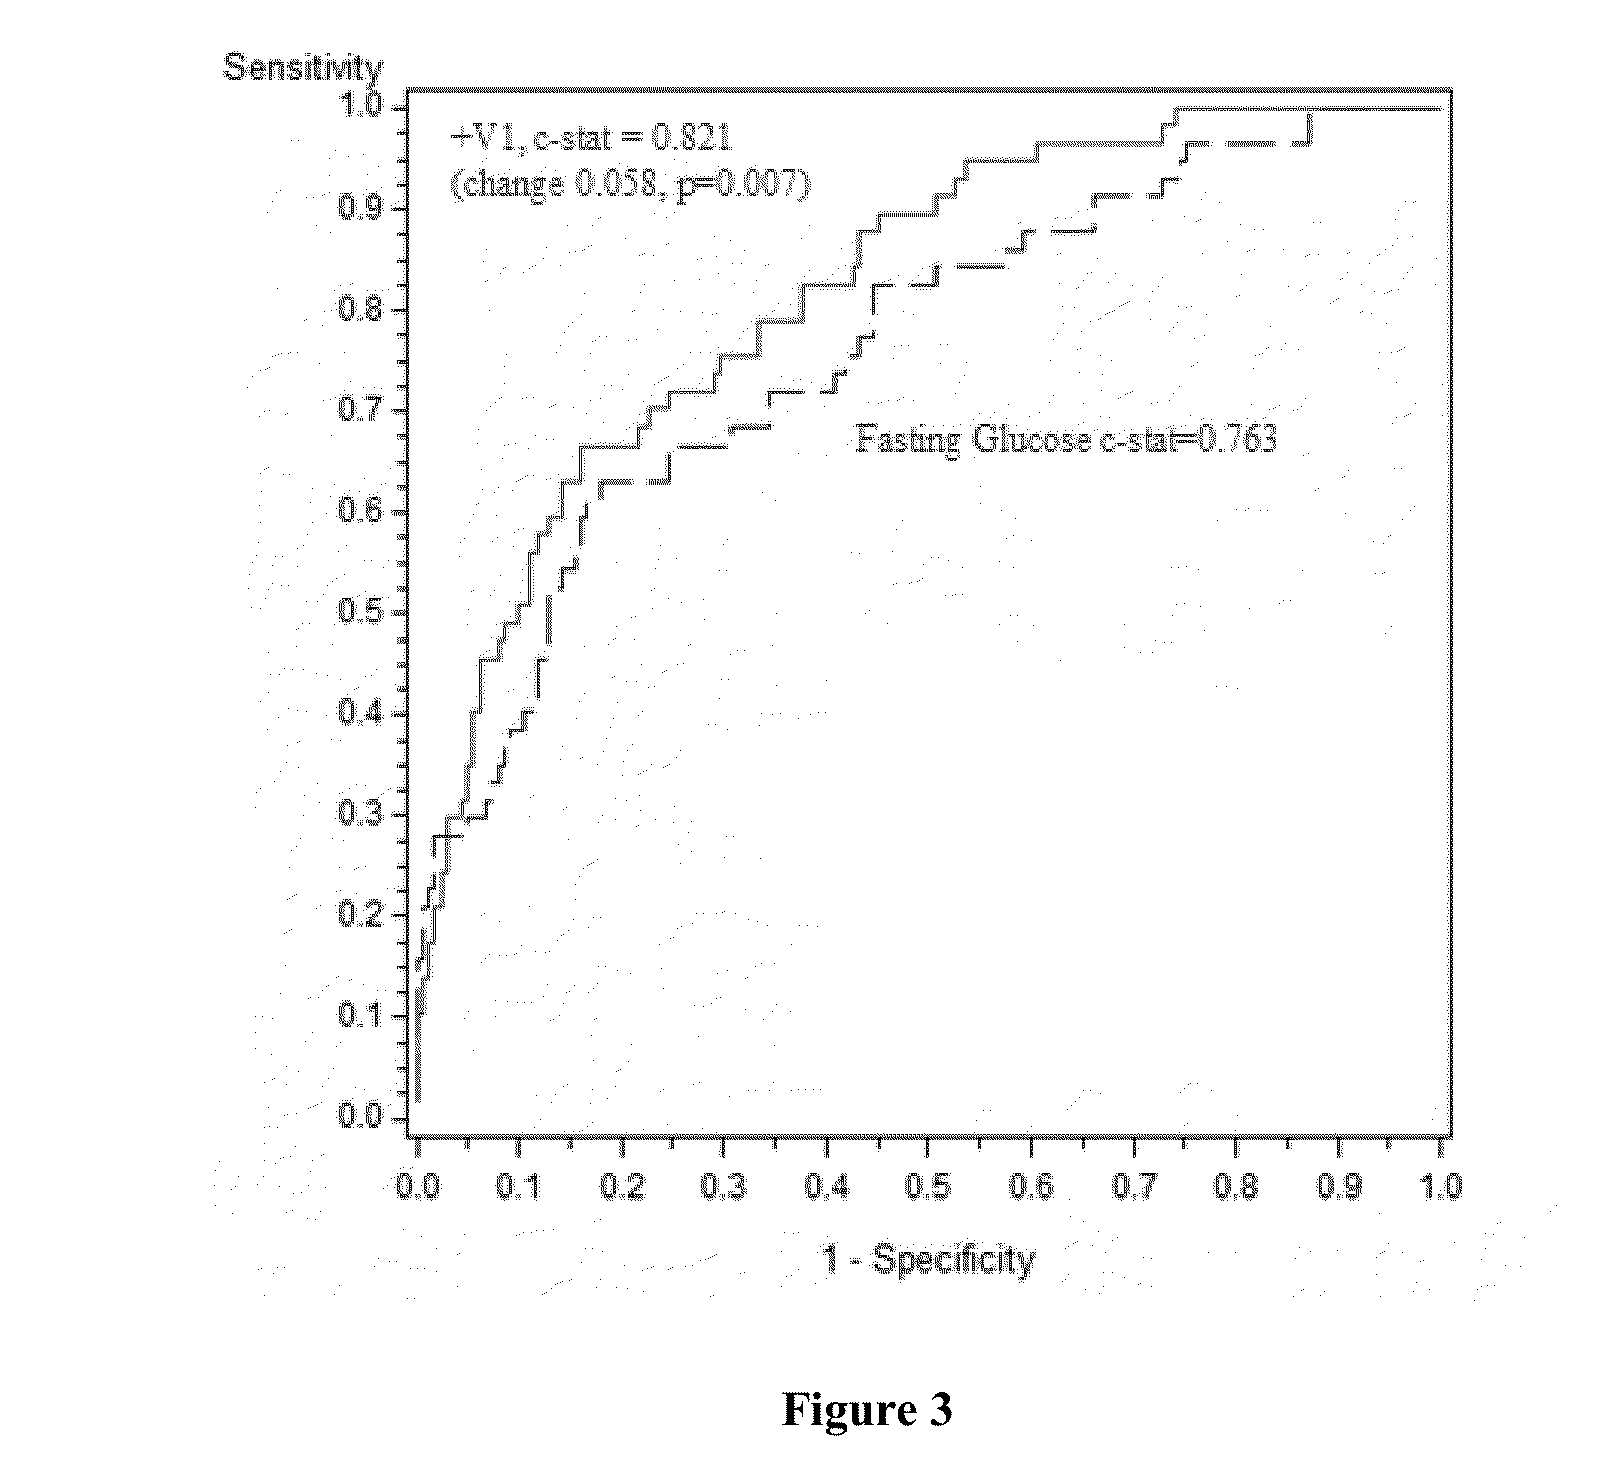
[0113]The score was calculated according to the following equation (version 1):

Ln[FFA0.774*Cpeptide0.679*AHB0.0655*Ferritin0.0407LGPC0.0848*Adiponectin0.131]

In the equation, the symbols and units of the measured levels are shown as below: Ln=natural logarithm; FFA=free fatty acid [mmol / L]; C-...

example 3

Predicting the Likelihood of Impaired Glucose Tolerance (IGT) Through Combining the Biomarkers of Free Fatty Acid (FFA), C-Peptide, and Adiponectin

[0115]In this example, the OGTT fasting score was calculated combining the measured values for FFA=free fatty acid [mmol / L], C-peptide [ng / mL], and adiponectin [μg / mL] from a patient sample.

[0116]The samples had previously been analyzed for the values of the area under the curve (AUC) for C-peptide and free fatty acid respectively, which, when multiplied together, strongly correlate with the IGT determined by a 2-hour OGTT.

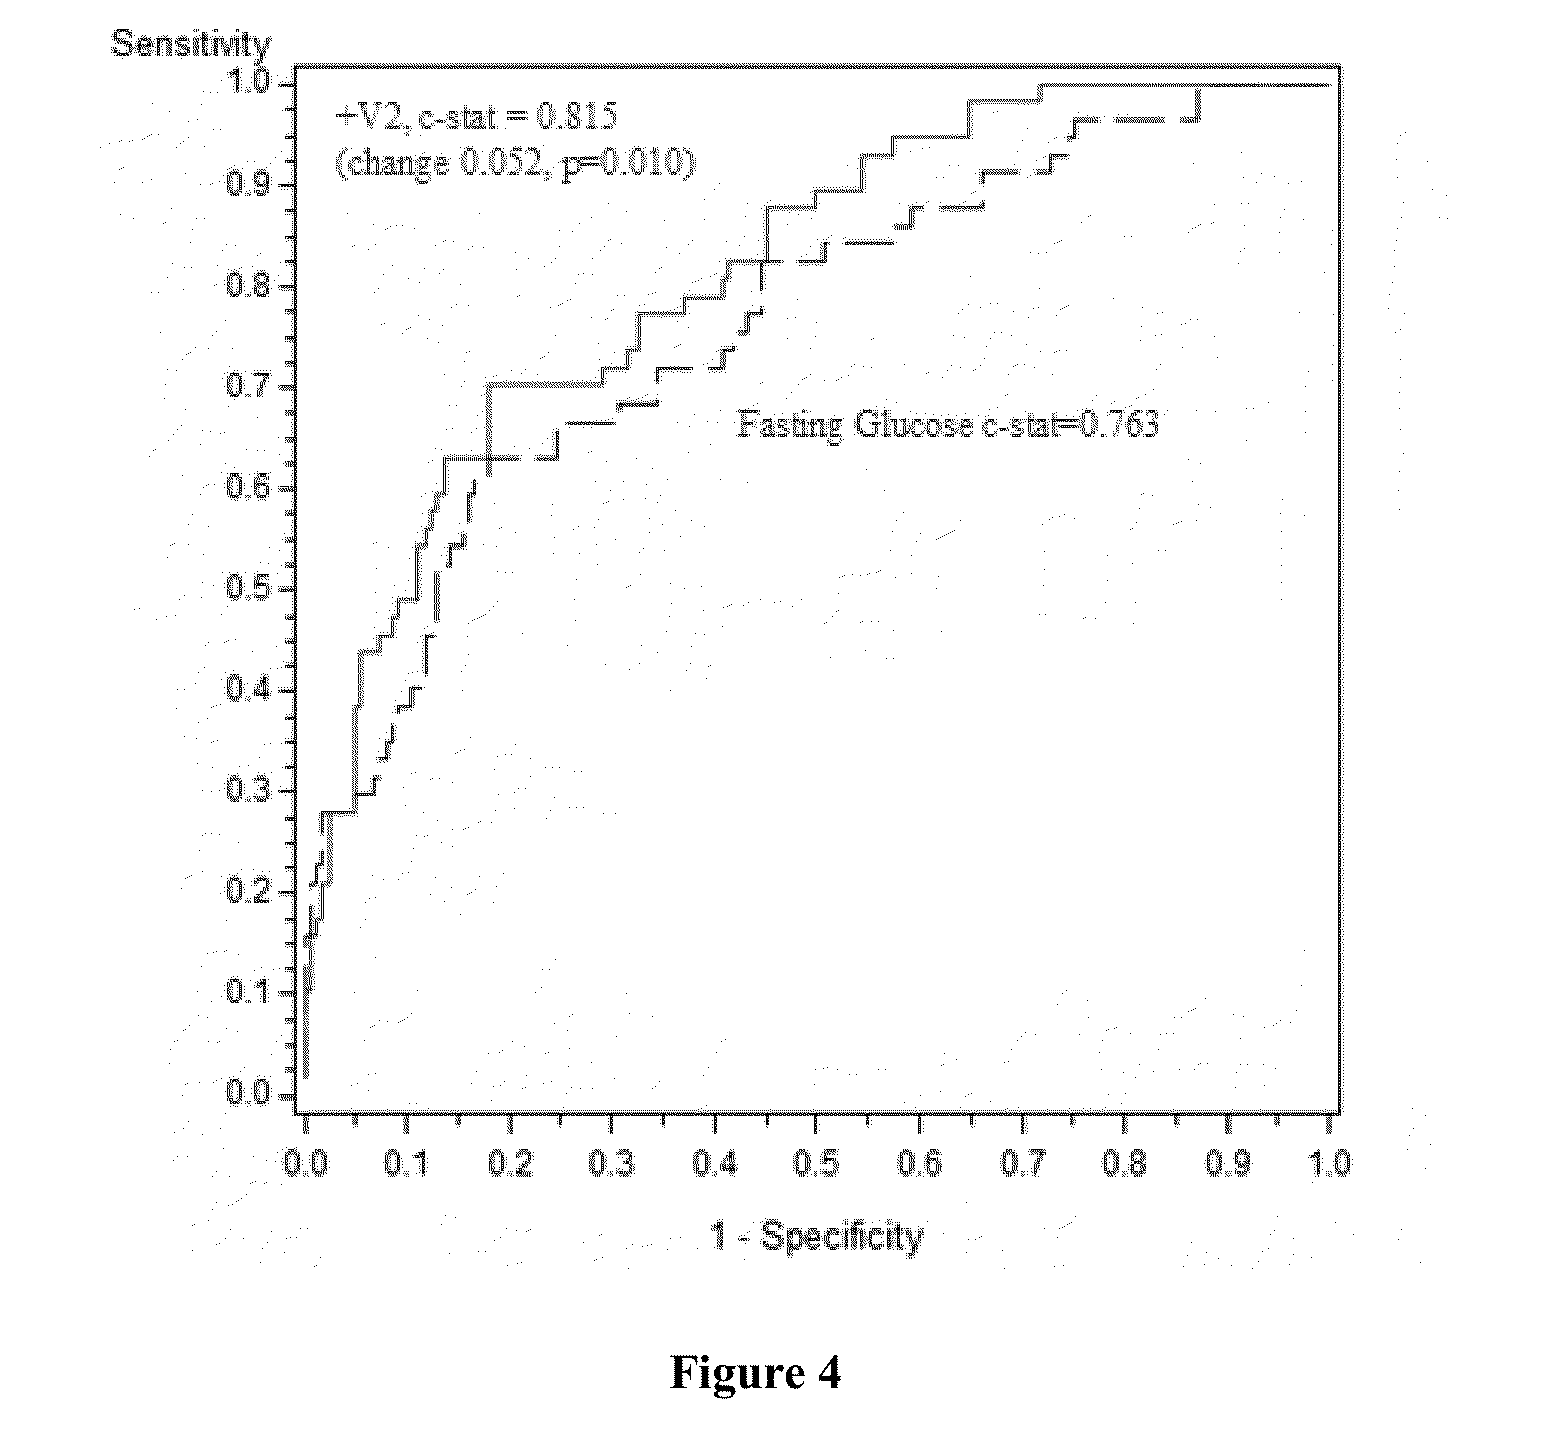
[0117]The score was calculated according to the following equation (version 2):

Ln[FFA0.825*Cpeptide0.729Adiponectin0.137].

[0118]As described in the Statistical Model in Example 1, the exponents for individual biomarkers in the above equation were derived from fitting the above equation to Ln(FFA AUC * C-peptide AUC) by multiple linear regression, and a population study of 10,000 bootstrapped samples, as shown in Table 3...


PUM

PropertyMeasurementUnit
timeaaaaaaaaaa
timeaaaaaaaaaa
insulin resistanceaaaaaaaaaa

Abstract

This invention relates to methods for predicting likelihood of a subject having abnormal glucose tolerance based on analyzing a combination of three or more biomarkers relating to specific physiological processes. This invention also relates to methods of accessing insulin sensitivity in a subject based on analyzing a combination of three or more biomarkers relating to specific physiological processes. The method has a clinical utility in correct and quick assessment of a subject's glucose tolerance and risk of developing diabetes or cardio-diabetic conditions and comorbidities.

Description

[0001]This application claims the benefit of priority of U.S. Provisional Patent Application Ser. No. 61 / 847,922, filed Jul. 18, 2013, which is hereby incorporated by reference in its entirety.FIELD OF THE INVENTION[0002]The invention relates to the field of clinical diagnostics. More specifically, the invention involves clinical testing of biomarkers to predict the likelihood of a subject having impaired glucose tolerance or insulin resistance.BACKGROUND[0003]Currently, a number of tests exist that can diagnose whether a patient has a normal glucose tolerance (NGT) or an impaired glucose tolerance (IGT). One test is to measure the blood glucose level at a 2-hour point of OGTT: elevated blood glucose above 140 mg / dL indicates abnormal glucose tolerance. Other tests that may indicate abnormal glucose tolerance include measuring levels of fasting blood glucose, insulin, pro-insulin, c-peptide, HbA1C, fructosamine, glycation gap, 1,5-Anhydroglucitol (1,5 AG), OGTT, “clamp-like index” (...

Claims


Application Information

Patent Timeline
Patent Type & Authority Applications(United States)
IPC IPC(8): G06F19/00G01N33/66G06F19/10C12Q1/54G16B25/10
CPCC12Q1/54G06F19/3431G01N2800/50G06F19/10G01N33/66G01N33/6893G01N2800/042G16B99/00G16H50/30G16B25/10G16H50/20
Inventor POTTALA, JAMES, VIKTOR
Owner TRUE HEALTH IP LLC
Why Eureka
Try Eureka