
Multi-parameter diabetes risk evaluations

a risk evaluation and multi-parameter technology, applied in the field of in vitro biosample analysis, can solve the problems of inability to maintain insulin hypersecretion, laborious and time-consuming direct and accurate methods for assessing insulin resistance, and impractical clinical applications, etc., to achieve the effect of facilitating identification

Active Publication Date: 2015-05-28
LIPOSCI
View PDF4 Cites 13 Cited by
  • Summary
  • Abstract
  • Description
  • Claims
  • Application Information

AI Technical Summary

Benefits of technology

[0012]The risk assessments can generate diabetes risk index scores that stratify risk beyond glucose measurements alone and may be decoupled from glucose measurements. The glucose measurements, where used, can help establish a timeline of conversion to type 2 diabetes. The diabetes risk index scores when used without glucose information may reflect risk over a longer term associated with underlying metabolic issues.
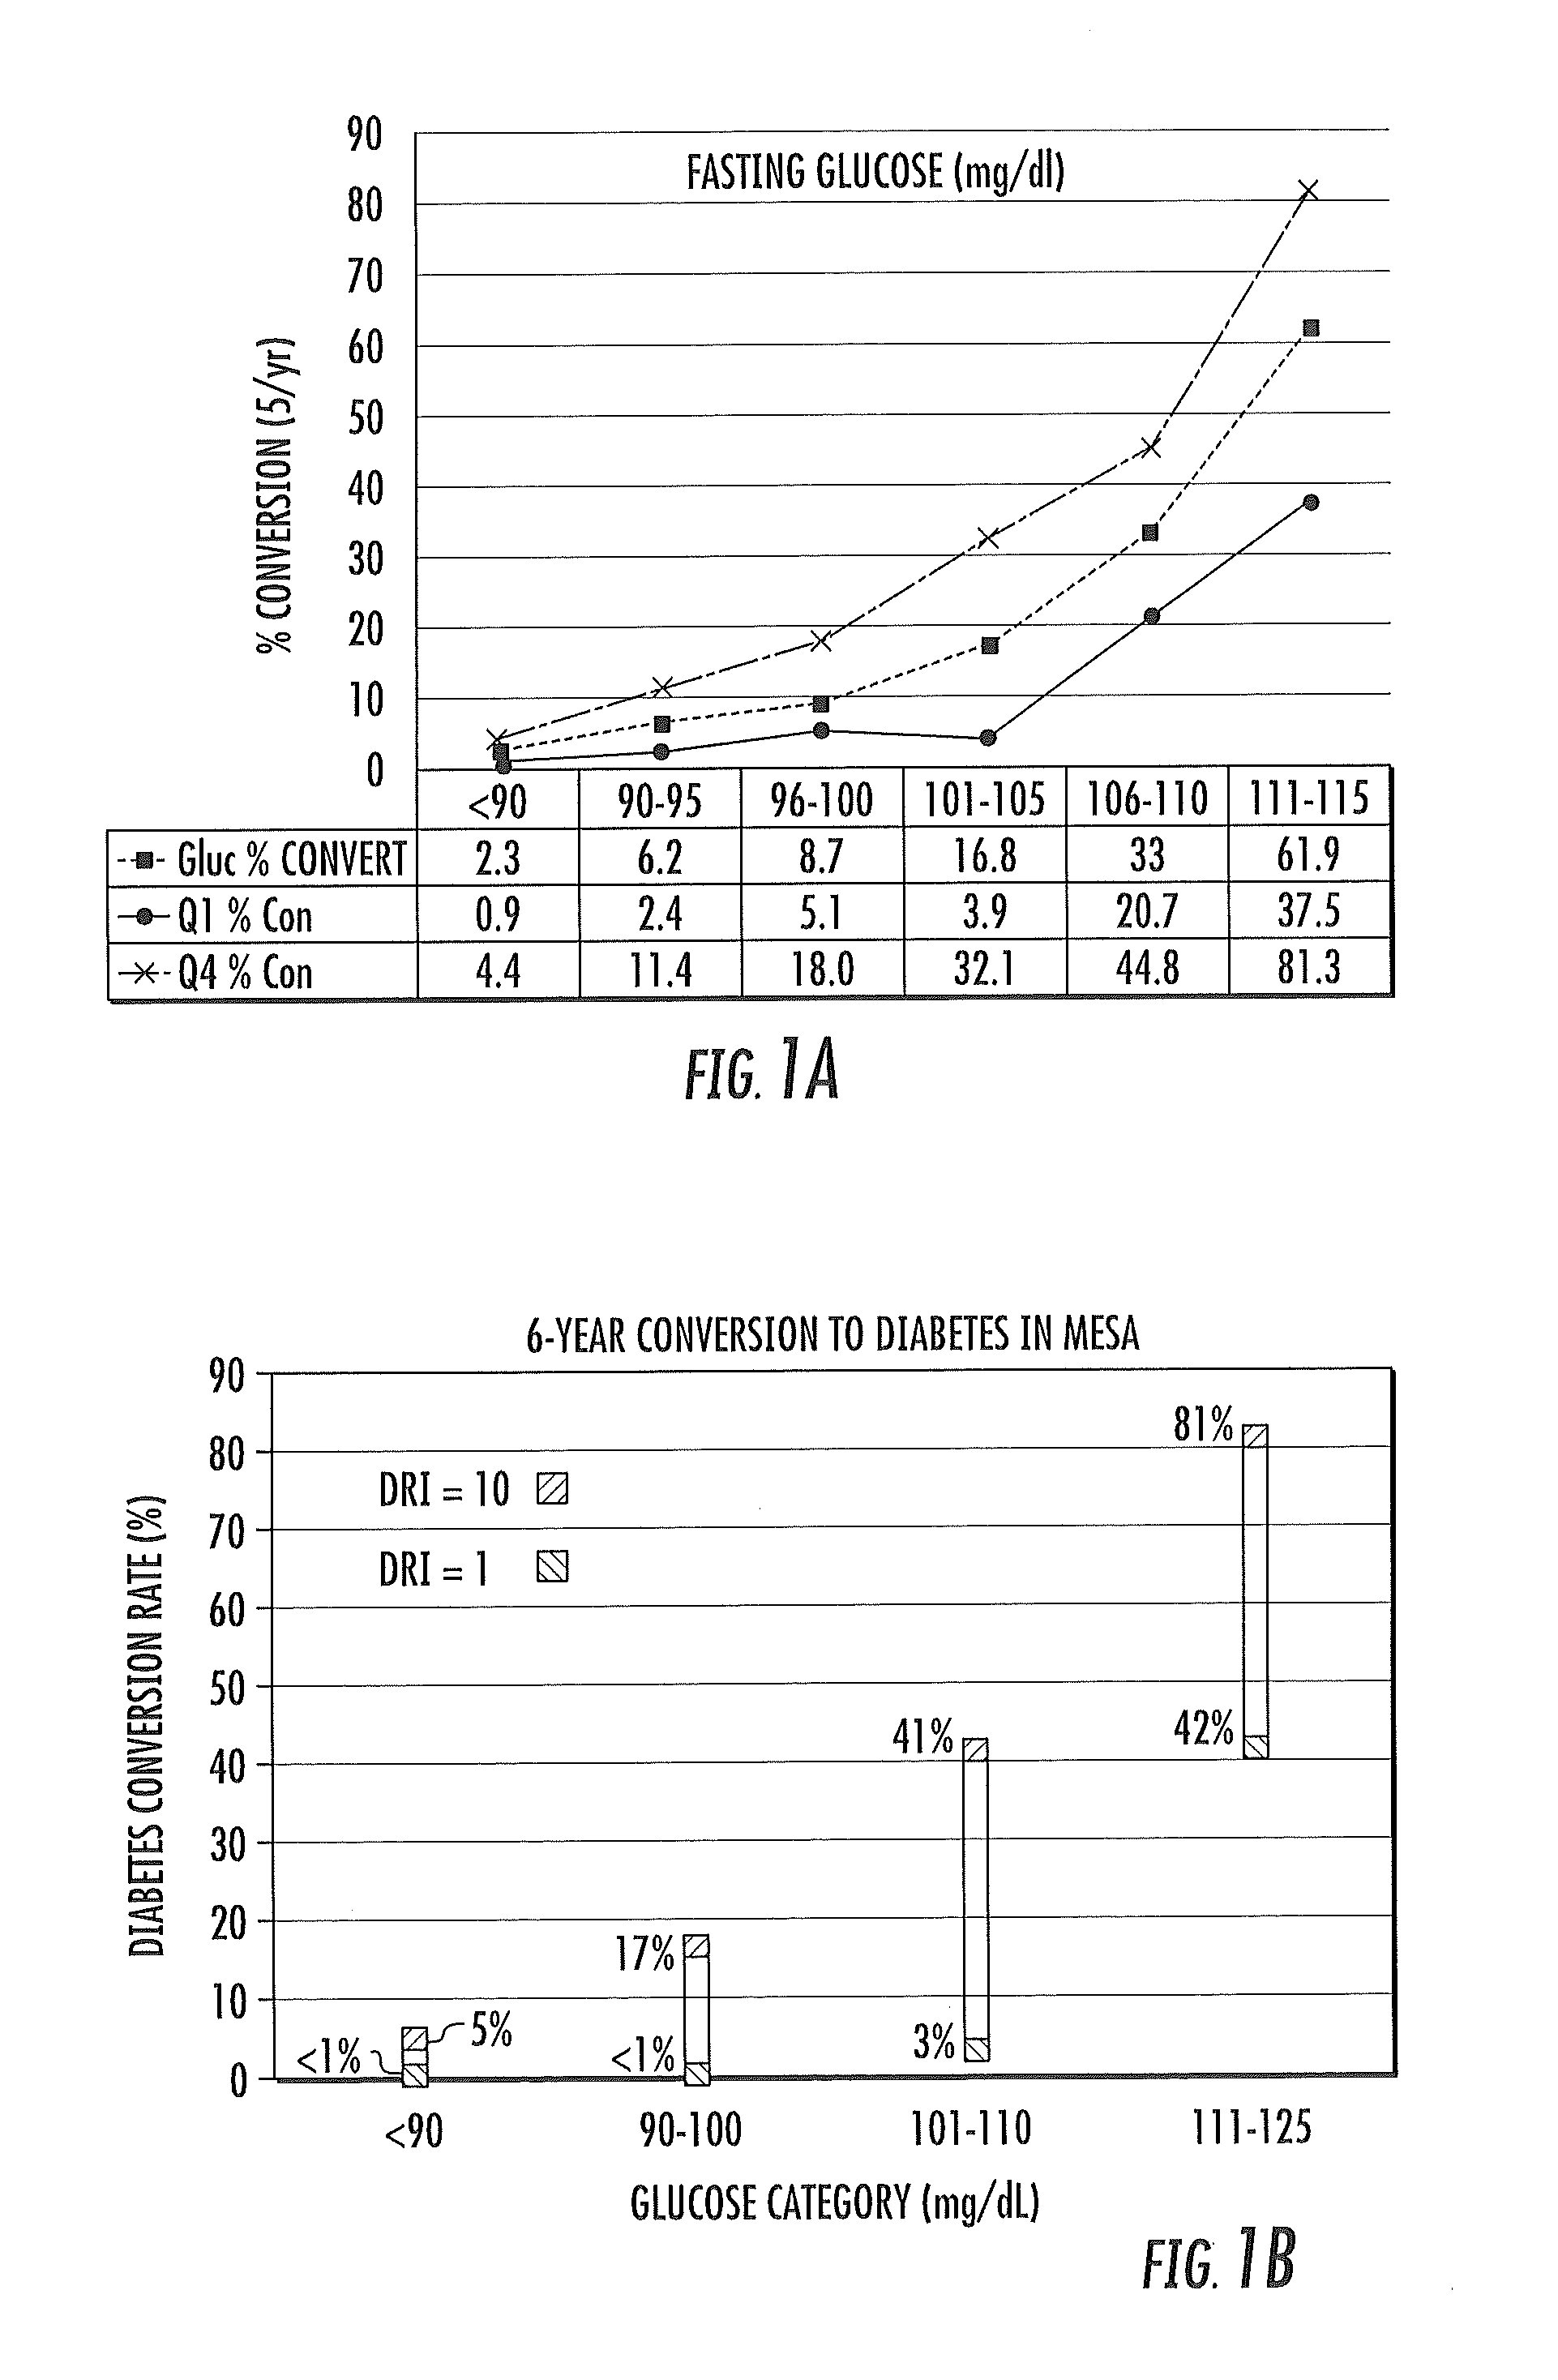
[0029]In some embodiments, the method may include programmatically generating a report with a graph of risk of progression to type 2 diabetes in the future over (e.g., a 1-7 year period) as a function of different ranges of glucose level, showing the risks for those in different quartiles, quintiles or deciles of the diabetes risk index score. In some embodiments, the graph shows references of at least first (low) and high (e.g, fourth quartile, fifth quintile or 10th decile) DRI scores based on a defined population to thereby allow for ease of identifying or understanding risk stratification.
[0048]In some embodiments, the at least one processor may be configured to generate a report with a graph of risk of progression to type 2 diabetes in the future over a 1-7 year period versus ranges of fasting glucose levels and a quartile of risk associated with the diabetes risk index score. The graph may include visual references of at least first (low) and fourth (high) quartile DRI scores based on a defined population to thereby allow for ease of identifying or understanding risk stratification.
[0058]In some embodiments, the computer program product may be configured to generate a report that identifies respective subjects that are at increased risk of developing type 2 diabetes prior to onset of type-2 diabetes when fasting blood glucose (FPG) levels are between 90-125 mg / dL. The mathematical model can stratify risk in subjects having the same glucose level and a different diabetes risk score.
[0066]The at least one processor in the system, in some embodiments, may be configured to generate a report with a graph of risk of progression to type 2 diabetes in the future (e.g., over a 1-7 year period or even longer) versus ranges of fasting glucose levels and a quartile of risk associated with the diabetes risk index score. The graph may include visual references of at least first (low) and fourth (high) quartile or corresponding quintiles or deciles of DRI scores based on a defined population to thereby allow for ease of identifying or understanding risk stratification.

Problems solved by technology

Hyperglycemia and the transition to T2DM occur as a consequence of progressive β-cell dysfunction which leads to failure to maintain hypersecretion of insulin in the face of increasing insulin resistance.
The most direct and accurate methods for assessing insulin resistance are laborious and time-consuming, and thus impractical for clinical application.

Method used


Image

  • Multi-parameter diabetes risk evaluations
  • Multi-parameter diabetes risk evaluations
  • Multi-parameter diabetes risk evaluations

Examples


example 1

[0311]A Diabetes Risk index (DRI) was developed using MESA that uses only information derived from a single nuclear magnetic resonance (NMR) spectrum of a fasting plasma sample. The DRI can identify the highest-risk patients who are likely to benefit the most from intervention. This information includes glucose and lipoprotein subclass / size parameters previously linked to insulin resistance, as well as Valine, and GlycA. FIG. 1A was generated using NMR spectra collected at baseline from the Multi-Ethnic Study of Atherosclerosis (MESA). The MESA dataset consisted of 3185 participants, 280 of whom developed diabetes during 5 years of follow-up. FIG. 1A presents the diabetes conversion rates of subjects within 6 glucose subgroups (dotted line), and those for subjects in the upper and lower quartile of DRI within each glucose stratum. As shown, the risk of developing diabetes at any given glucose level is substantially greater for DRI in Q4 vs Q1. The NMR-based diabetes risk score can e...

example 2

[0316]The DRI index model can employ lipoproteins, Valine and GlycA as seven different parameters (including 5 lipoprotein parameters): VLDL size, large+medium VLDL particle number, total HDL and medium HDL subclass particle number, Valine, and GlycA.

[0317]Another study of the MESA dataset consisted of 4985 non-diabetic participants, 411 of whom developed diabetes during 6 years of follow-up. The MESA data restricted to the 1832 individuals with intermediate glucose 90-110 mg / dL, 198 of whom converted to diabetes. Conversion rates by quintile of a baseline DRI index and the four component parts of the DRI model: lipoproteins, GlycA, Valine, and glucose were assessed. Relative rates for those in the extreme quintiles were 2.2 for lipoproteins, 1.9 for GlycA, 1.7 for Valine, 6.3 for glucose, and 10.7 for DRI (2.2% in Q1; 23.0% in Q5).

[0318]The results indicate that the DRI score, without any additional clinical information, can identify among patients with intermediate glucose levels ...

example 3

MESA and IRAS Comparison

[0320]FIG. 32 is a table of data that shows the performance of DRI (with glucose) in the IRAS dataset, the MESA dataset, and IRAS dataset (using the glucose subgroups from MESA). When IRAS samples were collected, the definitions of pre-diabetes and diabetes were different than that of MESA, which occurred years later.

[0321]FIG. 33 shows the performance of DRI (without glucose) in the same dataset criteria as FIG. 32. The highlighted values show the difference between the 5th quintile and the first quintile.

[0322]IRAS:

[0323]Observational study of middle-aged Hispanic, non-Hispanic white, and African-American men and women. Blood samples obtained 1992-1994. NMR analyses of thawed-refrozen heparin plasma performed in 2001 on Varian instruments (preceding Profilers or current generation NMR analyzers used by LipoScience, Inc., Raleigh, N.C.) using WET water suppression. NMR dataset population was 46% normoglycemic (old definition, glucose <110 mg / dL), 22% impaire...


PUM


Abstract

Methods, systems and circuits evaluate a subject's risk of developing type 2 diabetes or having prediabetes using at least one defined mathematical model of risk of progression that can stratify risk for patients having the same glucose measurement. The model may include NMR derived measurements of GlycA and a plurality of selected lipoprotein components of at least one biosample of the subject.

Description

RELATED APPLICATIONS[0001]This application claims the benefit of and priority to U.S. Provisional Application Ser. No. 61 / 657,315, filed Jun. 8, 2012, U.S. Provisional Application Ser. No. 61 / 711,471, filed Oct. 9, 2012, U.S. Provisional Application Ser. No. 61 / 739,305, filed Dec. 19, 2012, and U.S. patent application Ser. No. 13 / 830,784, filed Mar. 14, 2013, the contents of which are hereby incorporated by reference as if recited in full herein.FIELD OF THE INVENTION[0002]The present invention relates generally to analysis of in vitro biosamples. The invention may be particularly suitable for NMR analysis of in vitro biosamples.BACKGROUND OF THE INVENTION[0003]Type 2 diabetes mellitus (T2DM or “diabetes”) is one of the most costly and burdensome chronic diseases in the U.S. and other countries. The defining feature of T2DM is hyperglycemia, a reflection of impaired carbohydrate (glucose) utilization resulting from a defective or deficient insulin secretory response. T2DM is a late ...

Claims


Application Information

Patent Timeline
Patent Type & Authority Applications(United States)
IPC IPC(8): G06F19/00G01R33/46
CPCG01R33/46G06F19/3431A61B5/055G01N24/08G01R33/465A61B5/4842A61B5/7275G06F17/10G16H50/30G16H50/50G16H20/10
Inventor OTVOS, JAMES D.SHALAUROVA, IRINA Y.BENNETT, DENNIS W.WOLAK-DINSMORE, JUSTYNA E.O'CONNELL, THOMAS M.MERCIER, KELLY
Owner LIPOSCI
Learn More