Quantitative analysis method using mass spectrometry wherein laser pulse energy is adjusted

a mass spectrometry and laser pulse technology, applied in the direction of particle separator tube details, dispersed particle separation, separation processes, etc., can solve the problems of difficult design and practice of experiments, limited industrial or scientific applications of maldi mass spectrometry, and difficult to use maldi mass spectrometry for quantitative analysis of analytes

Active Publication Date: 2016-02-25
ASTA
View PDF0 Cites 5 Cited by
  • Summary
  • Abstract
  • Description
  • Claims
  • Application Information

AI Technical Summary

Benefits of technology

[0073]In accordance with the present disclosure, spectra having constant temperature (Tearly) can be obtained through feedback control of laser pulse energy. As a result, reproducible MALDI spectra can be obtained more easily and quickly, which allow for quantitative analysis of a trace amount, e.g. 100 amol, of an analyte.

Problems solved by technology

However, because of very poor reproducibility of MALDI mass spectral patterns, it is difficult to use MALDI mass spectrometry for quantitative analysis of analytes.
For this reason, the industrial or scientific applications of MALDI mass spectrometry are very limited.
However, the weakness of the profile analysis method is that the design and practice of experiments are difficult.
However, with the relative quantification method using an internal standard, the absolute amount of the analyte cannot be determined.
However, the absolute quantification method using an internal standard is disadvantageous in that a calibration curve has to be constructed for each component if a sample containing multiple components is to be analyzed.
However, the absolute quantification method using an analyte added has the problem that the analyte to be analyzed needs to be prepared additionally and several samples are needed for the analysis of one analyte.
However, when the analyte has a large molecular weight, such as proteins, nucleic acids, etc., or when the degree of isotopic substitution is increased to distinguish the mass spectrum of the analyte substituted with the isotope from that of the unsubstituted analyte, the cost increases greatly.
Another disadvantage of the MALDI mass spectrometry-based quantitative analysis using an internal standard is that the analyte pretreatment is not simple.

Method used


Image

  • Quantitative analysis method using mass spectrometry wherein laser pulse energy is adjusted
  • Quantitative analysis method using mass spectrometry wherein laser pulse energy is adjusted
  • Quantitative analysis method using mass spectrometry wherein laser pulse energy is adjusted

Examples


example 1

Sample Preparation

[0088]As analytes, peptides Y6, Y5K and angiotensin II (DRVYIHPF) were purchased from Peptron (Daejeon, Korea). Matrices CHCA and DHB were purchased from Sigma (St. Louis, Mo., USA). An aqueous solution of the analyte was mixed with a 1:1 water / acetonitrile solution of CHCA or DHB. In CHCA-MALDI, 1 μL of a solution containing 0-250 pmol of the analyte and 25 nmol of CHCA was loaded on the target and vacuum- or air-dried. Sampling for DHB-MALDI of Y6 was carried out in two steps. In each step, 1 μL, of a solution containing 0.5-320 pmol of Y6 in 50 nmol of DHB was loaded on the target and vacuum-dried.

example 2

Measure of Spectral Temperature

[0089]Kinetic analysis of the fragmentation of the analyte ion is not necessary for measurement of Tearly in the MALDI spectrum. Rather, the fragmentation pattern of the matrix ion or the total number of generated ions can also be used as a measure of Tearly. To obtain MALDI spectra having a specific Tearly while actively adjusting the factors affecting the Tearly, a good measure of Tearly is necessary. A good measure of Tearly should satisfy the following criteria.

[0090]First, a measure of Tearly must be a sensitive function of Tearly. Second, the measure of Tearly must be independent of the identities of the analytes, the concentrations of the analytes in a solid sample, and their numbers. Third, it should be possible to compute this property rapidly and straightforwardly from a spectrum.

[0091]The measurement of Tearly based on the fragmentation of peptide ion does not satisfy the second and third criteria. Also, when the fragmentation pattern of the...

example 3

Quantitative Reproducibility of TIC-Selected Spectra

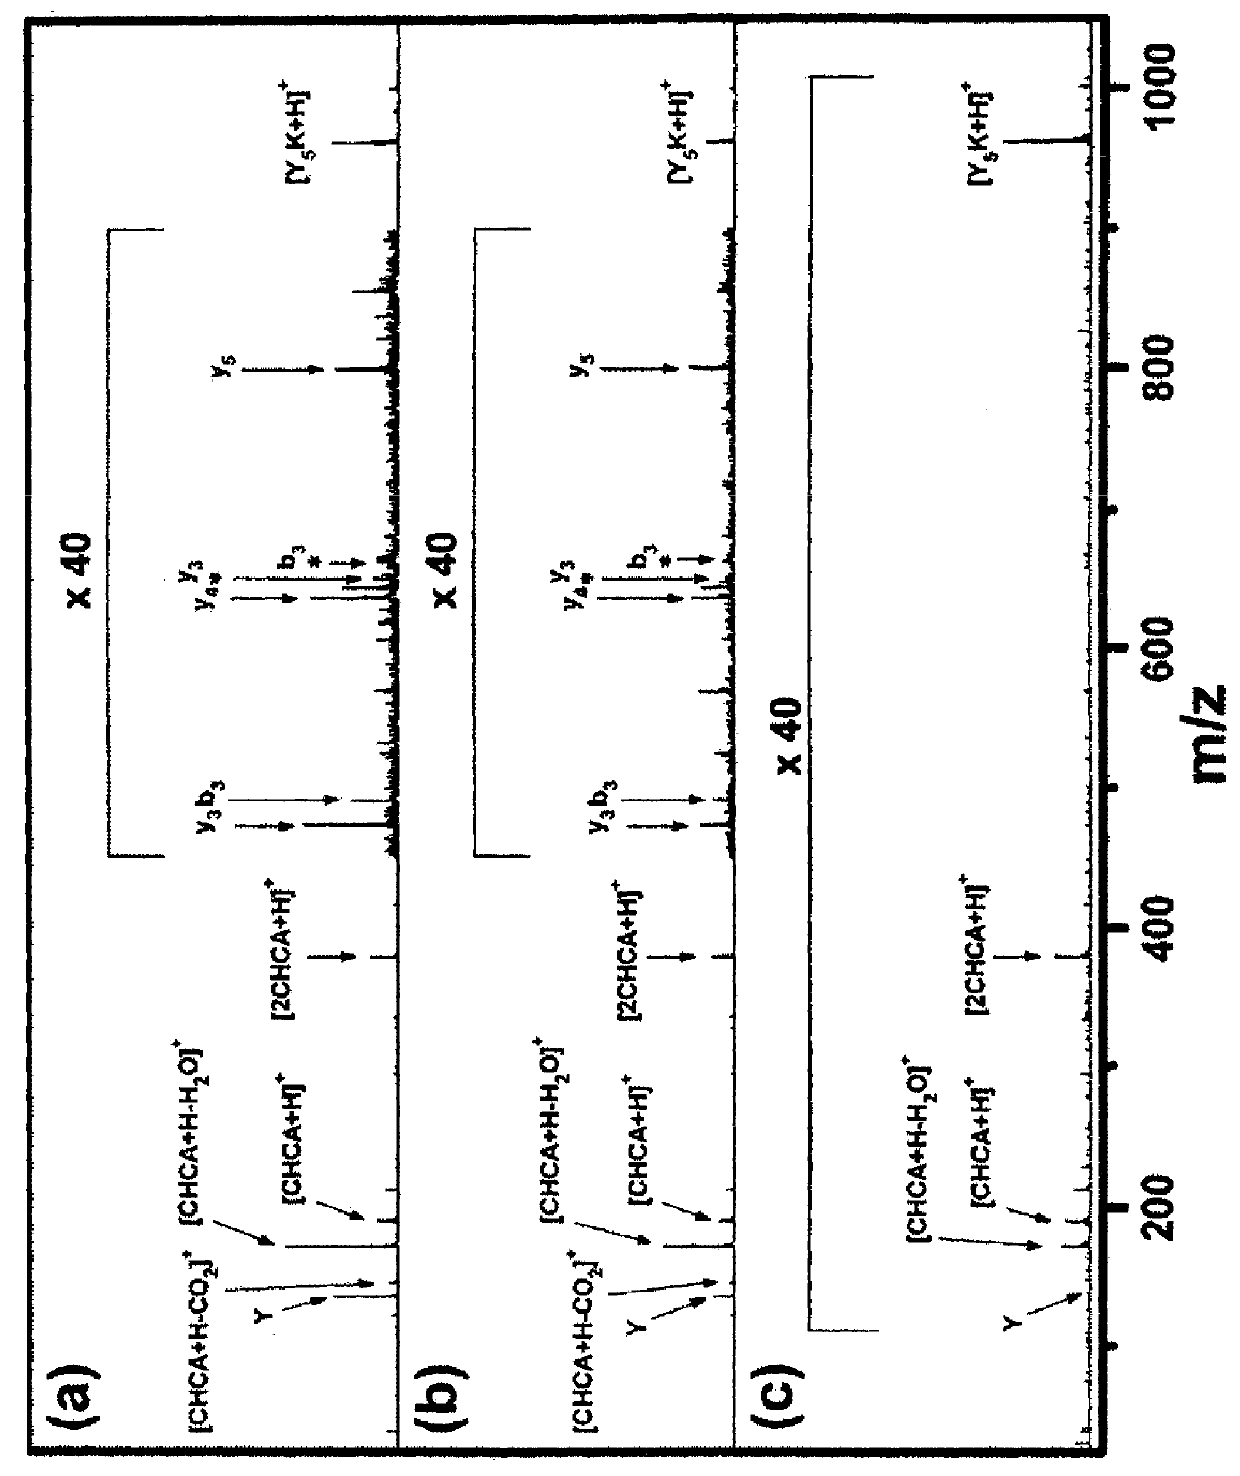
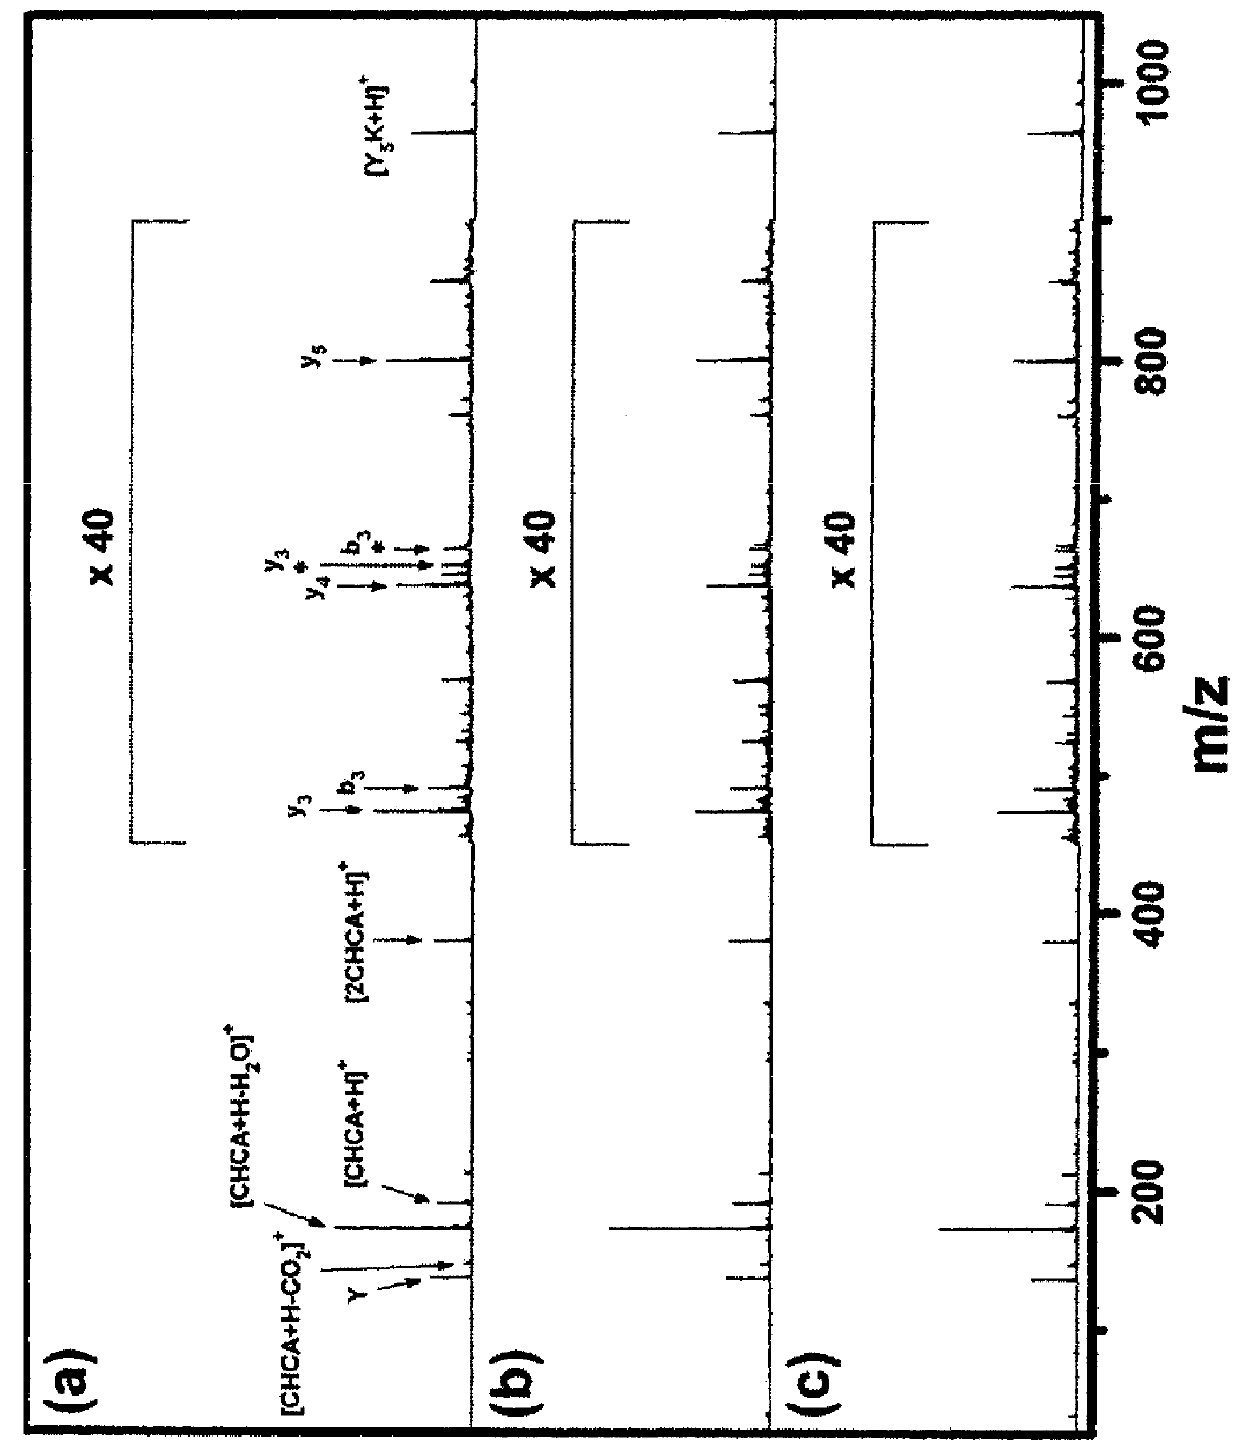
[0094]First, spectral changes occurring upon repetitive irradiation of a laser pulse were investigated. A set of MALDI spectra was taken from one spot of a vacuum-dried sample containing 10 pmol of Y5K in 25 nmol of CHCA using a laser pulse of two times the threshold pulse energy.

[0095]From this set, the spectra averaged over the shot number ranges of 31-40, 81-90 and 291-300 are shown in FIG. 1. The first 30 spectra were not used because contamination by alkali adduct ions was significant in those spectra. The total TICs summed over the above shot number ranges were 12000 (12000), 7300 (58000) and 110 (106000), respectively (The numbers in parentheses denote TICs accumulated in the shot number ranges of 31-40, 81-90 and 291-300, respectively.). Since temperature selection was not made, both the spectral pattern and the abundance of each ion changed as the laser shot continued. At the shot number range of 291-300, [Y5K+H]+ became m...


PUM


Abstract

A quantitative analysis method using MALDI mass spectrometry wherein laser pulse energy is adjusted is disclosed. More particularly, a method for measuring the equilibrium constant of a proton exchange reaction between a matrix and a sample at a constant temperature, by dividing an ion signal ratio by a value (concentration ratio) obtained by dividing the concentration of the sample by the concentration of the matrix, may include (i) obtaining MALDI mass spectra having constant TICs by adjusting the intensity of energy applied to a specimen having a predetermined amount of a matrix and a predetermined amount of a sample mixed therein and (ii) measuring the MALDI mass spectra obtained in step (i) for a value (ion signal ratio) obtained by dividing sample ion signal strength by matrix ion signal strength.

Description

TECHNICAL FIELD[0001]The present invention relates to a method for quantitative analysis using mass spectrometry wherein laser pulse energy is adjusted. More particularly, the present invention relates to a method for measuring the equilibrium constant of a proton exchange reaction between a matrix and an analyte at constant temperature, including: (i) obtaining MALDI mass spectra having the same total ion count (TIC) by adjusting the intensity of energy applied to a sample having a predetermined amount of matrix and a predetermined amount of analyte mixed therein; and (ii) measuring the value obtained by dividing the signal intensity of the analyte ion by the signal intensity of the matrix ion (ion signal ratio) from the MALDI mass spectra obtained in the step (i), wherein the ion signal ratio is divided by the concentration of the analyte divided by the concentration of the matrix (concentration ratio) to measure the equilibrium constant. The present invention also relates to a me...

Claims


Application Information

Patent Timeline
Patent Type & Authority Applications(United States)
IPC IPC(8): H01J49/00H01J49/16
CPCH01J49/164H01J49/0031H01J49/0036
Inventor KIM, MYUNG SOOBAE, YONG JIN
Owner ASTA
Why Eureka
Try Eureka