Gene Mutation Analyzer, Gene Mutation Analysis System, and Gene Mutation Analysis Method

a gene mutation and analyzer technology, applied in the field of gene mutation analysis methods and analyzers and analysis systems of gene mutations, can solve the problems of difficult to obtain fluorescence intensity waveform data for polymorphism or base sequence determination, and achieve high precision

Active Publication Date: 2016-06-30
HITACHI LTD
View PDF2 Cites 4 Cited by
  • Summary
  • Abstract
  • Description
  • Claims
  • Application Information

AI Technical Summary

Benefits of technology

[0018]According to the present invention, acquiring information about a gene mutation in trace amounts existing in a target gene region highly sensitively with high precision is realized.

Problems solved by technology

According to the aforementioned sequencing, however, fluorescence intensity waveform data that makes the determination of the polymorphism or the determination of the base sequence difficult may be obtained.

Method used


Image

  • Gene Mutation Analyzer, Gene Mutation Analysis System, and Gene Mutation Analysis Method
  • Gene Mutation Analyzer, Gene Mutation Analysis System, and Gene Mutation Analysis Method
  • Gene Mutation Analyzer, Gene Mutation Analysis System, and Gene Mutation Analysis Method

Examples


first embodiment

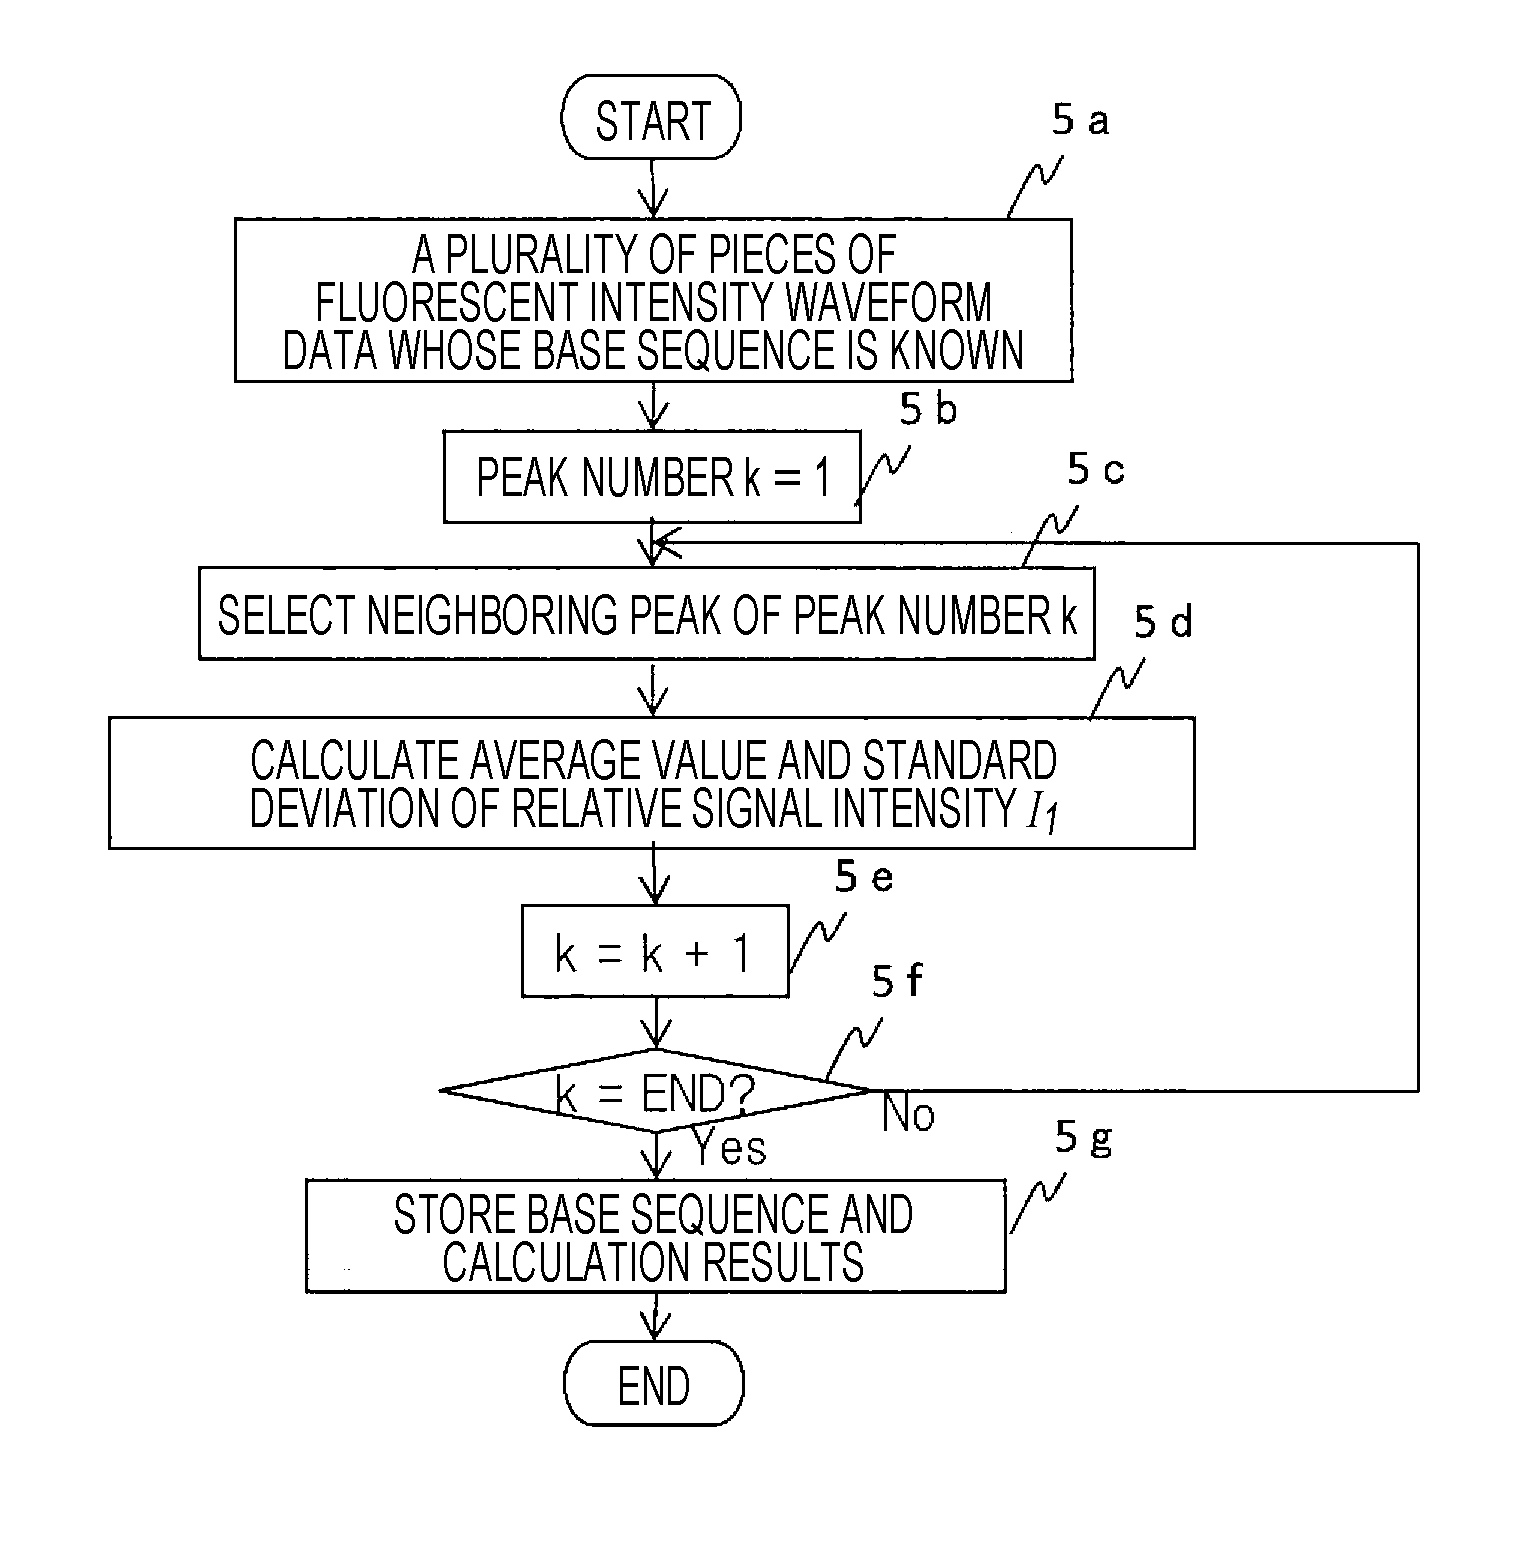
[0040]In the present embodiment, as a more concrete configuration example of the present embodiment that determines whether each base type in the base sequence coordinate position exists based on relative signal intensity information of signal intensity in each peak position relative to signal intensity in other peak positions, an example of analysis processing that detects a gene mutation in fluorescence intensity waveform data performed by the fluorescence intensity waveform data analyzer 1c will be described using FIGS. 5, 6, and 7.

[0041]First, an example of processing in which the data analyzer 1c acquires relative signal intensity information for reference, that is, an example of processing that acquires relative signal intensity information from fluorescence intensity waveform data of the base type obtained for a known base sequence will be described using FIG. 5. It is assumed here that the waveform of the fluorescence intensity waveform data shown in FIG. 4 corresponds to a ...

second embodiment

[0072]In the present embodiment, as a more concrete configuration example of the present embodiment that determines whether each base type in the base sequence coordinate position exists based on relative signal intensity information of signal intensity in each peak position relative to signal intensity in other peak positions, an example of analysis processing that detects the abundance ratio of each base type in each sequence coordinate position in fluorescence intensity waveform data performed by the fluorescence intensity waveform data analyzer 1c will be described using FIGS. 8, 9, 10, 11, and 12.

[0073]First, an example of processing that acquires relative signal intensity information for reference, that is, an example of processing that acquires relative signal intensity information from fluorescence intensity waveform data of the base type obtained for a known base sequence will be described using FIGS. 8 and 9.

[0074]In the processing in FIG. 8, a set of a plurality of pieces...

third embodiment

[0085]In the present embodiment, as an application example of the present embodiment that determines whether each base type exists in a base sequence coordinate position based on relative signal intensity information of the signal intensity in each peak position relative to the signal intensity in other peak positions, an application to the detection of a DNA methylation modification state will be described.

[0086]In the conventional detection of a DNA methylated gene, a general technique includes (i) conversion of cytosine C (non-methylated cytosine) that is not methylated in DNA into uracil U by the bisulfite process, (ii) gene amplification by PCR using a converted DNA sample as a template, (iii) plasmid cloning of gene amplification products, (iv) adjustment of about 100 clones of plasmid DNA, (v) fluorescence labeling reaction of about 100 clones, (vi) analysis of fluorescence labeling products by a DNA sequencer, (vii) calculation of the methylation rate by comparing the occurr...


PUM

PropertyMeasurementUnit
fluorescence intensityaaaaaaaaaa
fluorescence labelingaaaaaaaaaa
lengthsaaaaaaaaaa

Abstract

An aspect of the present invention includes performing electrophoresis of a nucleic acid sample to be analyzed labeled for each base type, generating waveform data of detected intensity by detecting a label signal for the each base type, selecting another peak position for each peak position of the waveform data for each base type, calculating relative signal intensity of signal intensity in each position relative to the signal intensity in the other selected position, and analyzing existence of each base type in a base sequence coordinate position of the nucleic acid sample by comparing the relative signal intensity of the nucleic acid sample to be analyzed and the relative signal intensity of a known nucleic acid sample in each peak position. Accordingly, acquiring information about a gene mutation in trace amounts existing in a target gene region highly sensitively with high precision is realized.

Description

TECHNICAL FIELD[0001]The present invention relates to an analysis method of a gene mutation and an analyzer and an analysis system of a gene mutation. In particular, the present invention relates to an analyzer that analyzes the existence of each base type in a base sequence coordinate position of a nucleic acid sample by interpreting fluorescence intensity waveform data obtained from the nucleic acid sample of a target gene, an analysis system, and an analysis method.BACKGROUND ART[0002]As a method of decoding a DNA base sequence, DNA sequencing combining the fragmentation technology of a nucleic acid using the Sanger's method, the fluorescence labeling technology of nucleic acid fragments, the high-resolution electrophoretic technology, and further the sensitive fluorescence detection technology is widely used.[0003]According to the DNA sequencing, DNA (template DNA) whose base sequence should be decoded is first prepared and a replication reaction of the template DNA is caused us...

Claims


Application Information

Patent Timeline
Patent Type & Authority Applications(United States)
IPC IPC(8): G01N27/447C12Q1/68
CPCG01N27/44704G01N27/44791C12Q1/6825G01N2030/8827C12Q1/6816G01N27/44726C12Q2565/102C12Q2565/125
Inventor YOSHIDA, MAKIKOYOKOI, TAKAHIDEANAZAWA, TAKASHI
Owner HITACHI LTD
Why Eureka
Try Eureka