
Big-data analyzing method and mass spectrometric system using the same method

a mass spectrometry and big-data technology, applied in the field of big-data analysis methods, can solve the problems of inability to determine whether or not a sample belongs to a plurality of clusters or to another cluster different from those clusters, inability to use conventional analysis techniques to determine the very fact that this sample belongs to a plurality of subtypes, and inability to extract highly reliable markers. , the effect of high reliability

Active Publication Date: 2017-12-14
SHIMADZU CORP +1
View PDF3 Cites 17 Cited by
  • Summary
  • Abstract
  • Description
  • Claims
  • Application Information

AI Technical Summary

Benefits of technology

The big-data analyzing method described in this patent is a new and improved way of studying large amounts of data. It can classify samples into different groups based on their characteristics, even if the samples have traits of multiple groups. It can determine the number of groups based on a quantitative index, without needing to set a specific number of groups beforehand. The method can extract reliable markers from each group, even if the data is complex or the number of markers is small. It can also accurately determine which cluster a new sample should belong to. Compared to other big-data analyzing methods, this method uses statistical techniques and is faster and cheaper. Users can easily try the analysis using a personal computer.

Problems solved by technology

However, even when the number of kinds of subtypes is comparatively small as in the case of breast cancer, the subtype determined by the immunostaining test on a clinical site does not always match with one of the subtypes discovered by research based on the gene expression profiling data obtained with a microarray.
However, any of those conventional analyzing methods is not always suitable for such applications as the determination of the subtype of a cancer.
However, the aforementioned techniques of clustering analysis, such as the HCA, are based on the assumption that any sample can be classified into a single cluster; there is no consideration of a sample being classifiable into two or more clusters.
The technique which uses the PCA score plot is also incapable of determining whether or not a sample belongs to a plurality of clusters or to another cluster different from those clusters.
Thus, if there is a sample which actually belongs to a plurality of subtypes (i.e. which contains a mixture of two or more subtypes), the conventional analyzing techniques are incapable of discovering the very fact that this sample belongs to a plurality of subtypes.
It is also naturally impossible to determine what subtypes are mixed in the sample.
However, the process still requires an analysis operator to give some instructions or perform some setting for the determination of the optimum number of clusters, so that there is room for subjective judgments by the analysis operator.
Therefore, it is not guaranteed that the task of classifying samples into clusters is always precisely performed by consistent criteria.
In other words, accurate clustering may be impossible if there is only a small number of markers or if those markers have a small intensity difference.
Needless to say, if the clustering is inappropriate, it is difficult to specify highly reliable markers, and if the markers are unreliable, it is difficult to correctly sort new samples into clusters.
Even when the clustering is accurate, an extraction of appropriate markers may be impossible, or the extracted markers may be inaccurate, if the conditions of the markers are complex, as in the case where some of the markers are shared by a plurality of clusters (e.g. there is a marker whose quantity singularly increases in both cluster X and cluster Y) or the case where there is a cluster having a plurality of markers in which one marker appears in a larger quantity than in the other clusters while another marker appears in a smaller quantity, or if the total number of clusters is considerably large.

Method used


Image

  • Big-data analyzing method and mass spectrometric system using the same method
  • Big-data analyzing method and mass spectrometric system using the same method
  • Big-data analyzing method and mass spectrometric system using the same method

Examples


Embodiment Construction

[0104][Description of Data Analyzing Method (CCD Method)]

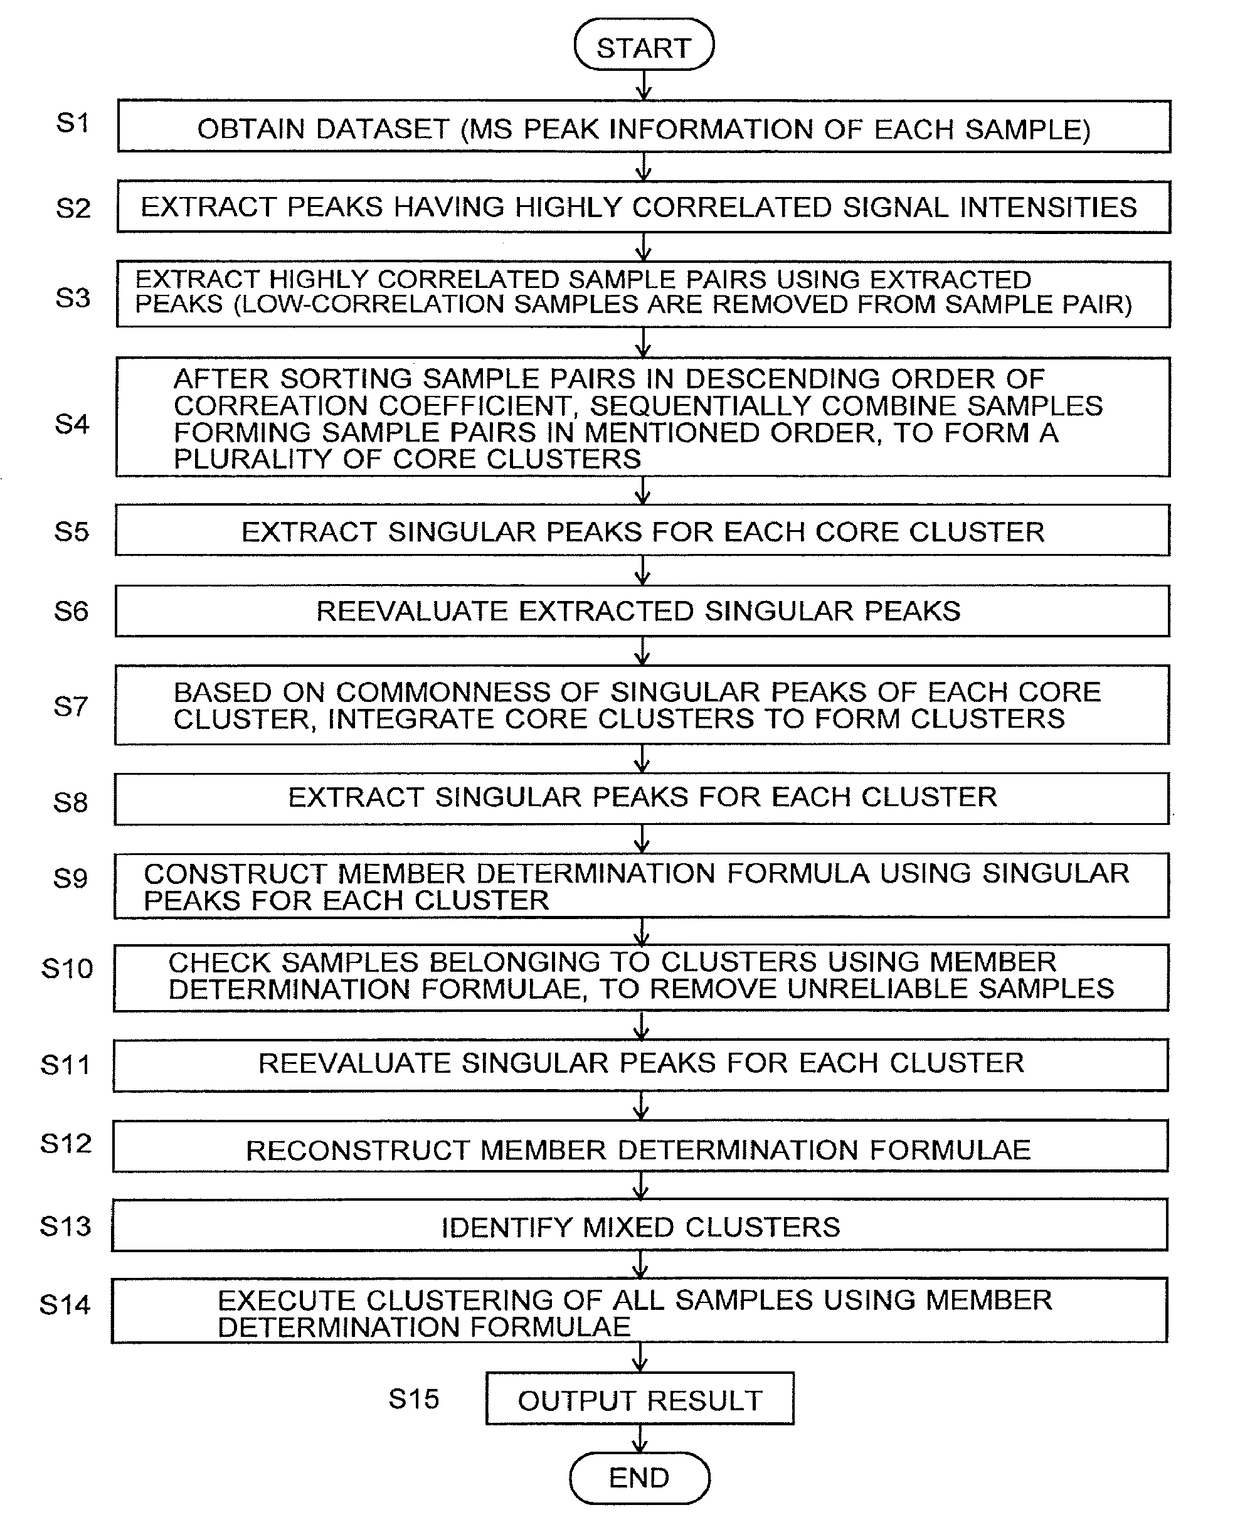
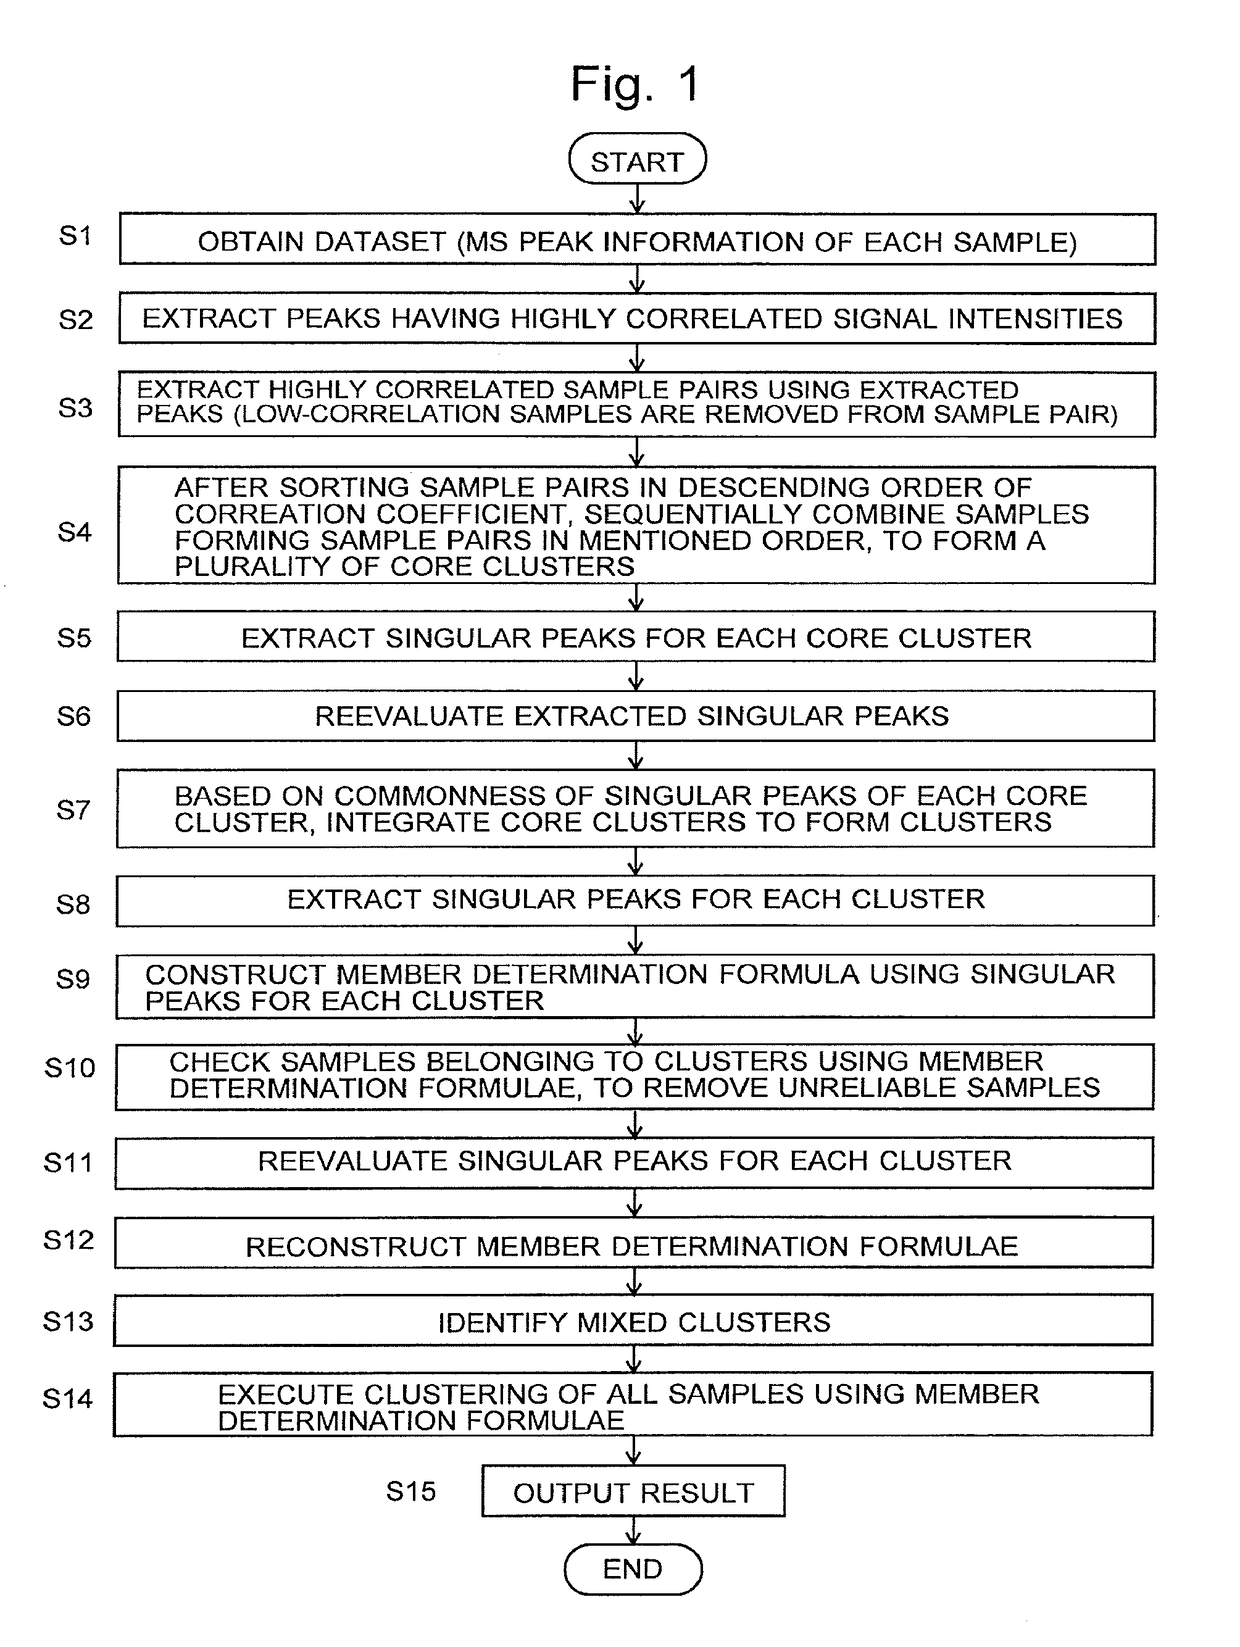
[0105]Initially, a big-data analyzing method as one embodiment of the present invention is described with reference to the attached drawings. FIG. 1 is a flowchart showing the analyzing procedure in the big-data analyzing method of the present embodiment. In the following descriptions, the big-data analyzing method of the present embodiment will be called the CCD (core cluster detection) method. The reason for using such a name will naturally be clarified with the following descriptions.

[0106]Hereinafter considered is the case where biological samples (e.g. cancerous tissues) taken from a large number of cancer patients and healthy individuals are treated as samples, and the big-data analyzing method of the present embodiment, i.e. the CCD method, is used in order to classify the cancer into subtypes as well as determine which subtype each sample belongs to, based on mass spectrum information obtained by a mass spectrometric a...


PUM


Abstract

Provided is a method for sorting a number of samples into an appropriate number of clusters according to their characteristics. Highly-correlated peaks are extracted from mass spectrum data obtained for the samples (S2). Using the extracted peaks, highly-correlated sample pairs are extracted (S3). While removing samples having low degrees of correlation, highly-correlated sample pairs are integrated to form core clusters (S4). Using singular peaks characterizing each core cluster, two or more core clusters are integrated to form clusters (S5-S7). These clusters include mixed clusters in which two or more clusters are mixed. Member determination formulae are created based on the singular peaks of each cluster (S8-S12). All samples, including those which have been excluded from the cluster determination process, are classified into clusters based on the member determination formulae (S14). The member determination formulae can also be used to assign a new sample to one of the cluster.

Description

TECHNICAL FIELD[0001]The present invention relates to a big-data-analyzing method for analyzing big data collected by various techniques, such as measurements, instrumentations or observations, as well as a mass spectrometric system in which this analyzing method is applied in an analysis of data obtained by mass spectrometry.BACKGROUND ART[0002]In recent years, cancer treatment techniques have been rapidly advancing, and various kinds of treatment drugs and methods producing higher levels of therapeutic effects than ever before have been developed. However, it goes without saying that correct diagnoses are essential to obtain high therapeutic effects. It has been commonly known that there are such types of cancer that originate from the same biological site yet can be classified into different subtypes depending on the characteristics of the cancerous cells. For example, breast cancer can be classified into Luminal A, Luminal B, Basel-like and other subtypes, as disclosed in Non Pa...

Claims


Application Information

Patent Timeline
Patent Type & Authority Applications(United States)
IPC IPC(8): H01J49/00G06F17/30
CPCG06F17/30601H01J49/0036G06F16/951G06F2216/03G06F18/2136G06F18/23G01N2800/7028G06F16/287G16B40/10G16C20/20G16C20/70G01N31/00
Inventor MATSUURA, MASAAKIFUJITA, YUICHIROKAJIHARA, SHIGEKI
Owner SHIMADZU CORP
Learn More