Method of distinguishing mesenchymal stem cells and method of determining purity of mesenchymal stem cells
a mesenchymal stem cell and stem cell technology, applied in the field of mesenchymal stem cell differentiation and mesenchymal stem cell purity determination, can solve the problems of cell culture at potential contamination risk with other cell types, lack of specific cell surface markers, and extremely invasive isolation procedures, and achieve the effect of increasing the purity of mesenchymal stem cells
- Summary
- Abstract
- Description
- Claims
- Application Information
AI Technical Summary
Benefits of technology
Problems solved by technology
Method used
Image
Examples
example 1
metry Analysis of Mixed Populations of MSCs and Fibroblast
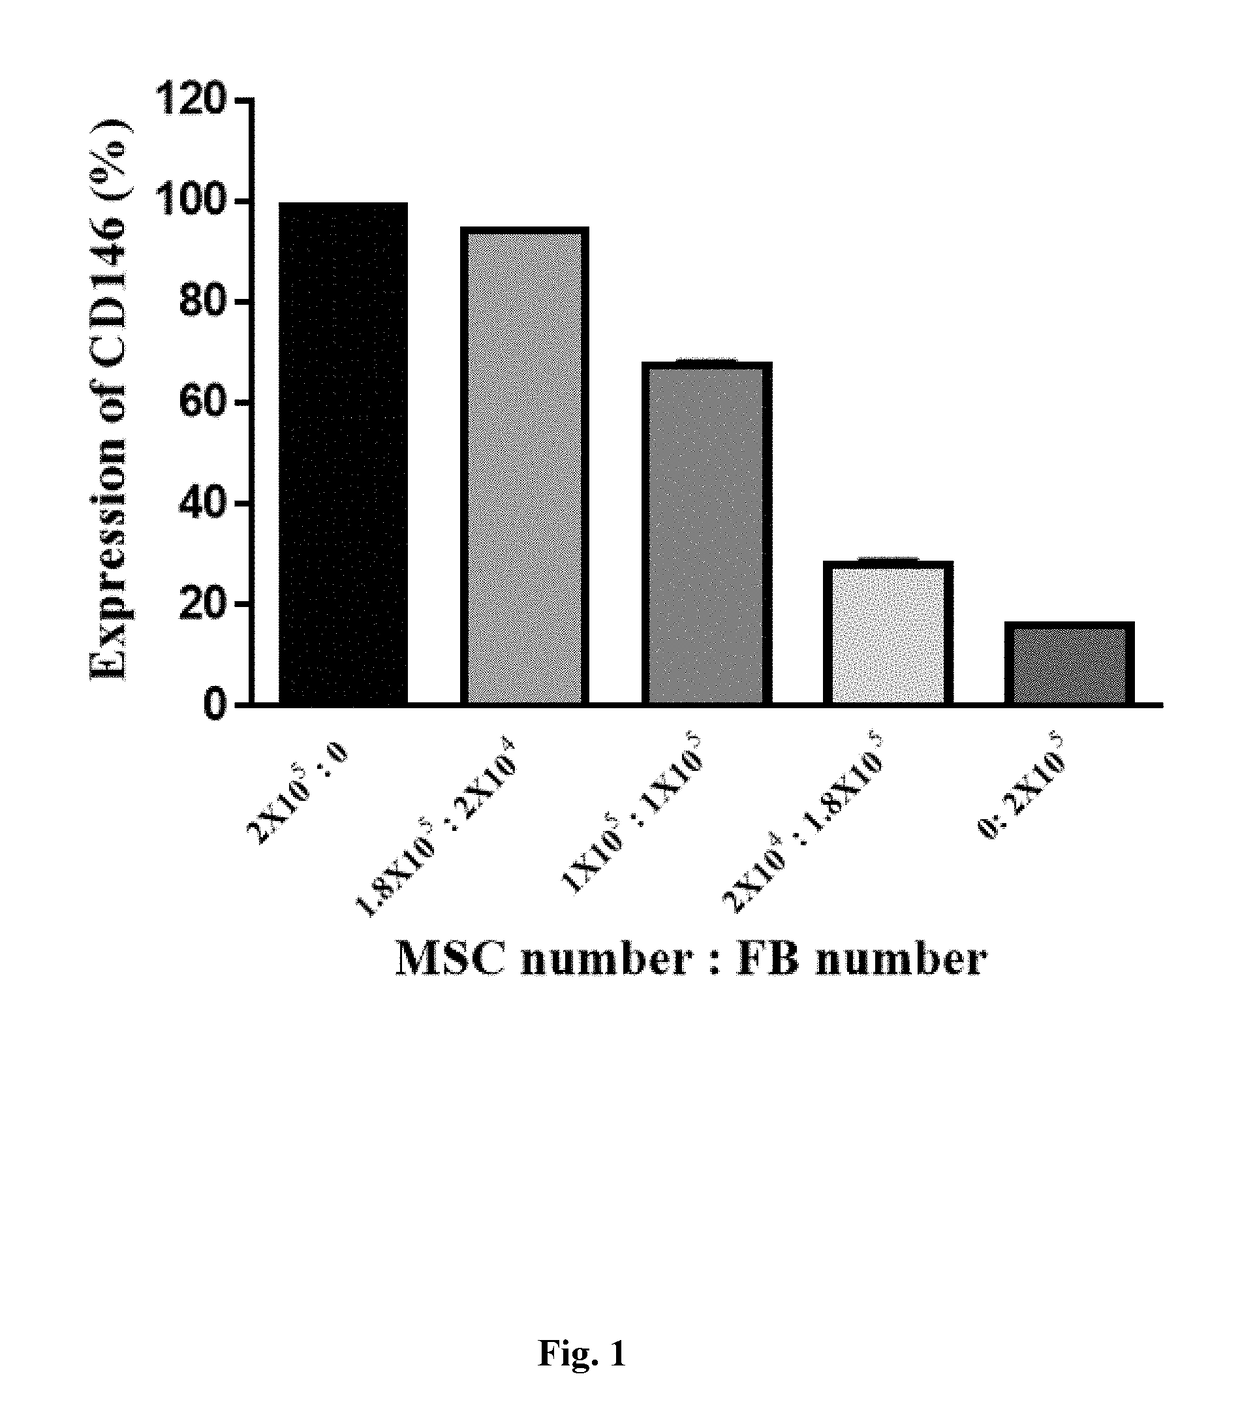
[0045]To demonstrate that CD146 could serve as a biomarker to separate placenta-derived MSCs from fibroblasts, MSCs derived from umbilical cord were mixed with fibroblasts in Eppendorf tubes by following ratios (MSC: fibroblasts in cell number): 2×10⁵:0, 1.8×10⁵:2×10⁴, 1×10⁵:1×10⁵, 2×10⁴:1.8×10⁵, or 0:2×10⁵. CD146+ population in each Eppendorf tube was then analyzed by flow cytometry. Referring to FIG. 1, the results shows that the percentage of CD146+ population detected by anti-CD146 antibodies (anti-human CD146-V450, BD biosciences) via flow cytometry decreased proportionally in relation to the increase of fibroblast population.
example 2
ression Levels are Maintained as the Passage Number Increases
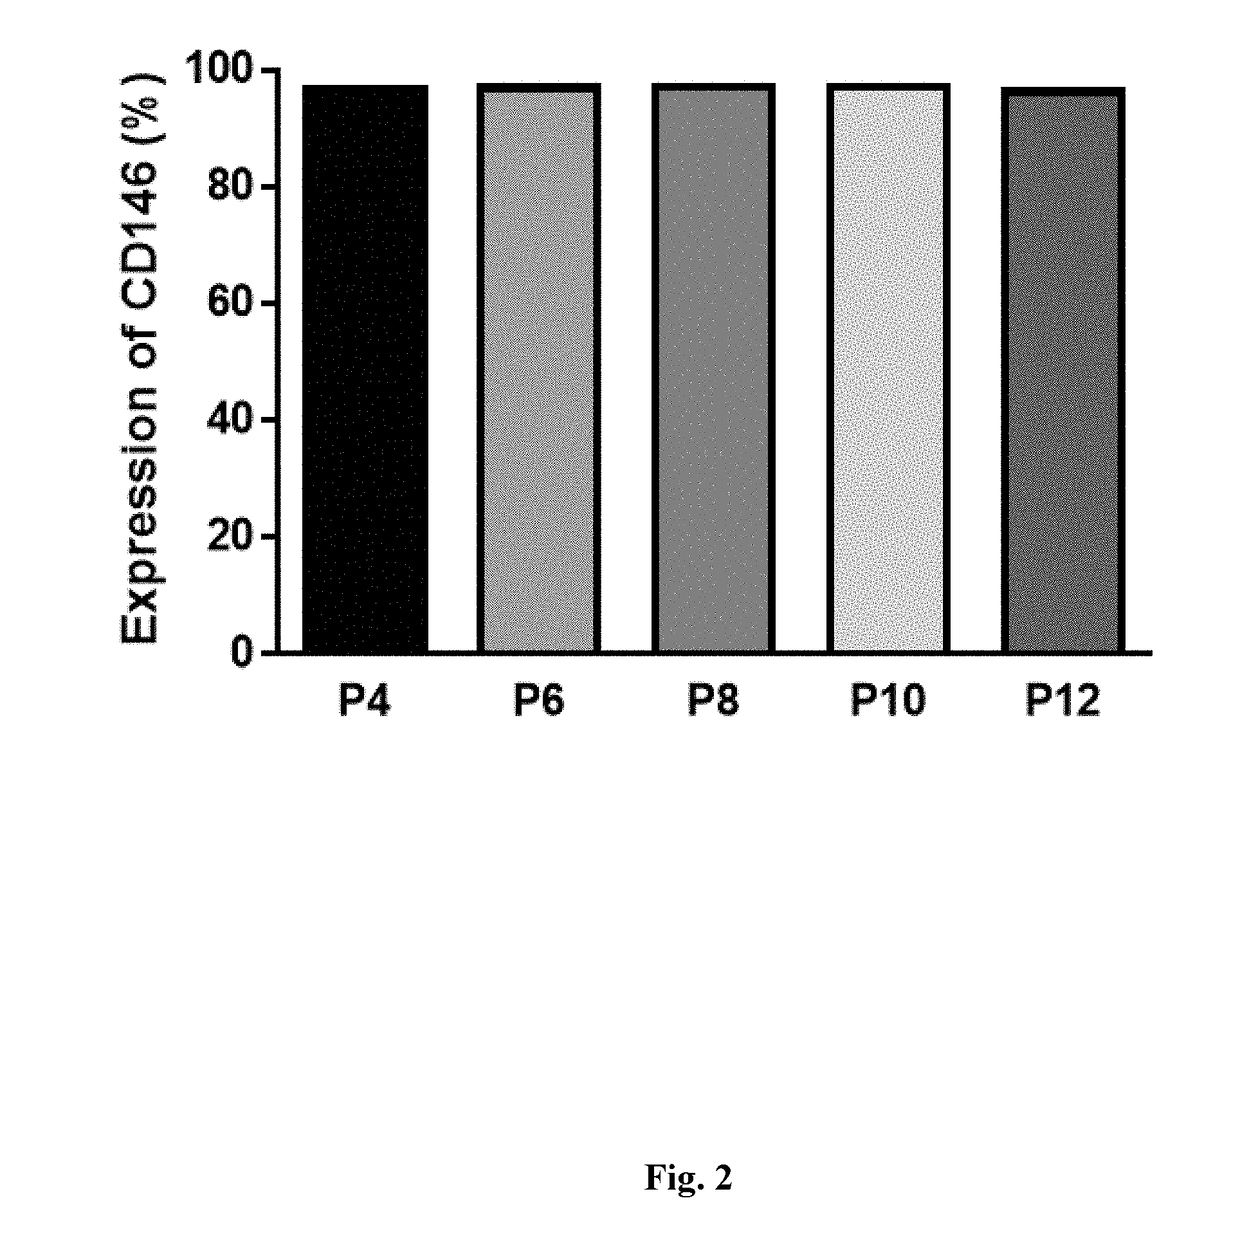
[0046]MSCs derived from umbilical cord were harvested at different passage numbers (passage numbers: 4, 6, 8, 10, and 12) and the expression levels of CD146 were analyzed by flow cytometry. The results show that CD146 expression levels are maintained along passages (FIG. 2).
example 3
t of Purity of MSCs
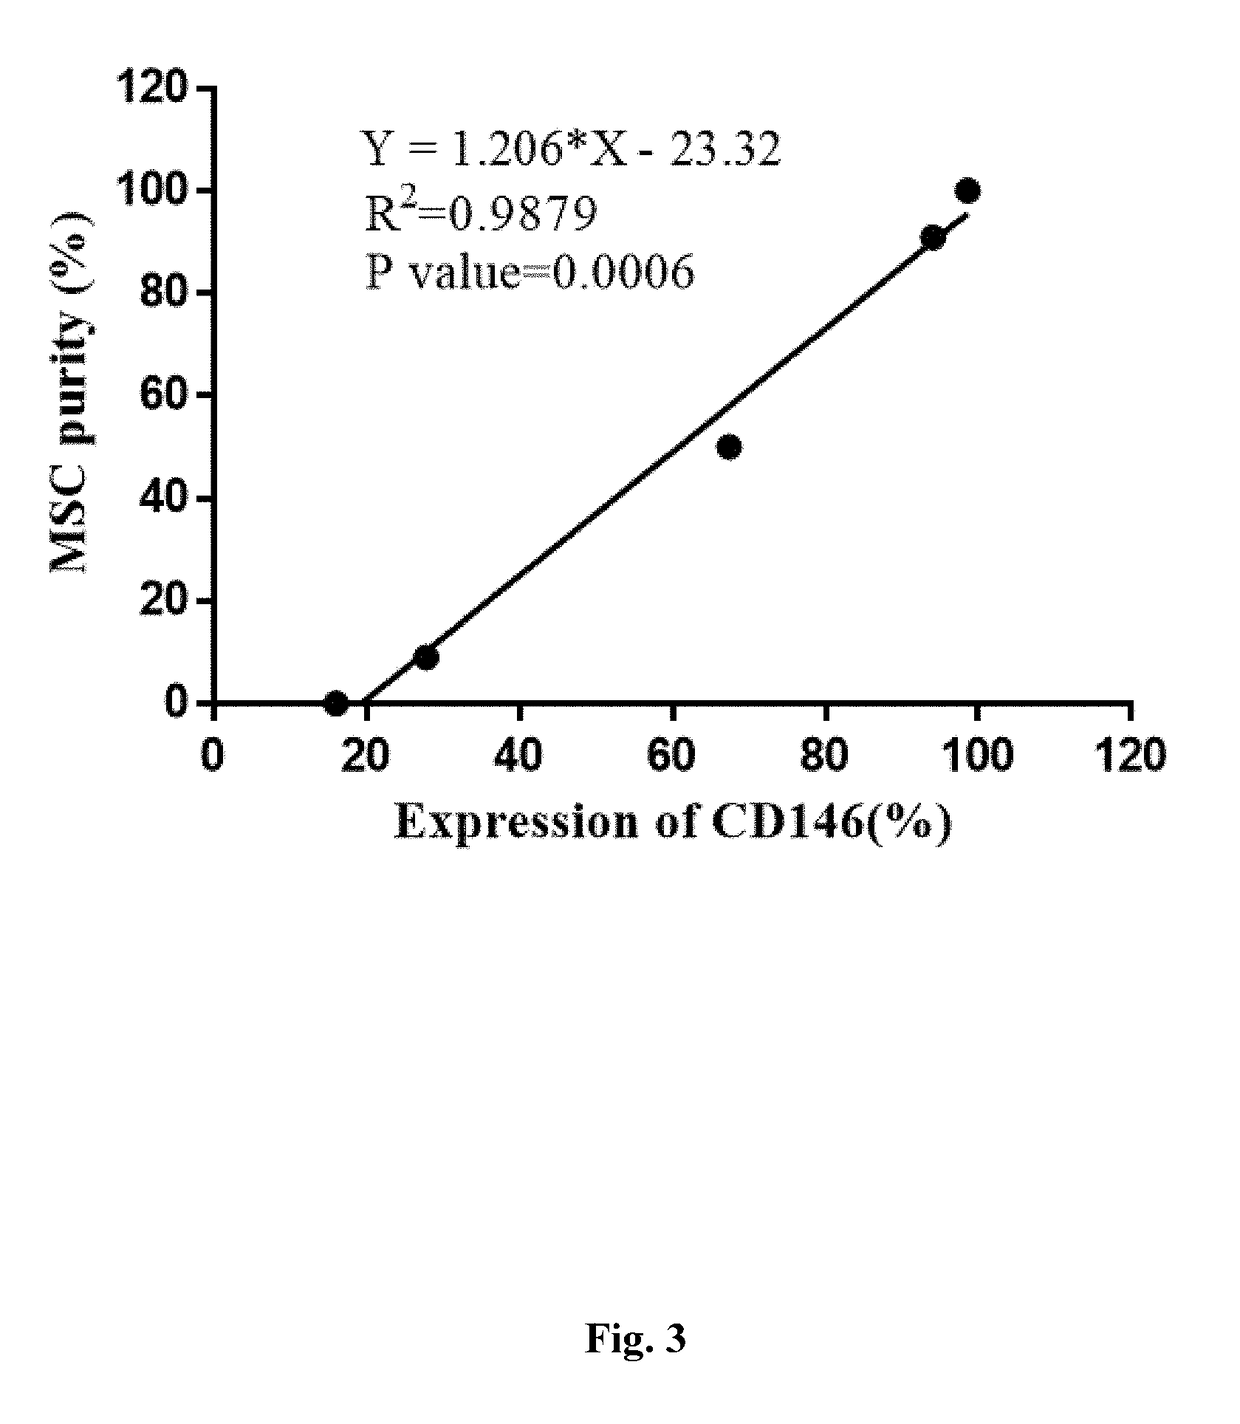
[0047]MSCs derived from umbilical cord were mixed with fibroblasts in Eppendorf tubes by following ratios (MSC: fibroblasts in cell number): 2×10⁵:0, 1.8×10⁵:2×10⁴, 1×10⁵:1×10⁵, 2×10⁴:1.8×10⁵, or 0:2×10⁵. CD146+ population in each Eppendorf tube was then analyzed by flow cytometry. Subsequently, the relationship between the purity (%) of MSCs and the percentage of cells expressing CD146 was analyzed by simple linear regression, results of which are shown in FIG. 3. The regression equation is Y=1.206X−23.32, where Y is the purity (%) of MSCs and X is the percentage of cells expressing CD146. The results demonstrated that there is a linear relationship between the expression level of CD146 and the purity of MSCs.
Example 4: CD146high MSCs Exhibits Higher Differentiation Ability than CD146low MSCs
[0048]MSCs derived from different umbilical cords were examined for expression of CD146 using flow cytometry. Two groups of MSCs were obtained: CD146high MSCs and CD146low MS...
PUM
| Property | Measurement | Unit |
|---|---|---|
| purity | aaaaa | aaaaa |
| morphology | aaaaa | aaaaa |
| plasticity | aaaaa | aaaaa |
Abstract
Description
Claims
Application Information
 - R&D
- Intellectual Property
- Life Sciences
- Materials
- Tech Scout
- Unparalleled Data Quality
- Higher Quality Content
- 60% Fewer Hallucinations
Browse by: Latest US Patents, China's latest patents, Technical Efficacy Thesaurus, Application Domain, Technology Topic, Popular Technical Reports.
© 2025 PatSnap. All rights reserved.Legal|Privacy policy|Modern Slavery Act Transparency Statement|Sitemap|About US| Contact US: help@patsnap.com


