Chromatography/mass spectrometry data processing device

a data processing device and mass spectrometry technology, applied in the direction of instruments, electric discharge tubes, particle separator tubes, etc., can solve the problems of inefficiency of conventional techniques described above, component peaks will affect the chromatogram peaks of target components, and the retention time of peaks originating from the target components to be incorrectly recognized, so as to reduce the burden on the operator involved in such confirmation operations. , the effect of accurately separating out components

Active Publication Date: 2018-11-08
SHIMADZU CORP
View PDF3 Cites 1 Cited by
  • Summary
  • Abstract
  • Description
  • Claims
  • Application Information

AI Technical Summary

Benefits of technology

[0043]With the chromatography / mass spectrometry data processing device according to the present invention, when investigating if a target component is contained in a sample or not or when quantitating a target component, even in cases where a peak originating from the target component on a mass chromatogram cannot be detected at the appropriate retention time or when the intensity of a peak originating from a target component is inflated above what it actually is, it is possible to accurately select only the components whereof the presence is uncertain, excluding components which are clearly contained in the sample or which are conversely clearly not contained. In other words, it is possible to accurately separate out components for which the mass chromatogram and mass spectrum actually need to be visually confirmed by an operator. The burden on the operator involved in such confirmation operations can thus be reduced, making it possible to increase the efficiency of analysis operations in cases such as residual agrochemical testing, where quantitation of numerous target components is performed on numerous specimens.

Problems solved by technology

For example, in tests for residual agrochemicals in foods and drinks, agrochemicals would be the target components, but such samples contain many interfering components besides the target components, and the target components and interfering components cannot be adequately separated with a chromatograph, so often, the interfering components will affect the chromatogram peaks of the target component.
Furthermore, such peak overlap may cause the retention time for peaks originating from the target component to be recognized incorrectly (offset from where they actually are).
In testing for residual agrochemicals in foods in Japan, currently, a positive list system has been adopted, with analysis of over one hundred types of residual agrochemicals being performed at once, but for a very large number analytes, the conventional technique described above is inefficient in that it takes much effort and time for an operator to perform the confirmation operation for all the target components.
However, if peaks originating from interfering components overlap peaks on the mass chromatogram at the mass / charge ratio for quantitative calculation (the so-called quantitation ion mass / charge ratio) and the peak area increases, then the quantitative values computed based on peak area will be inflated, and components which should properly be classified as (G1) may end up being erroneously classified as (G3).
Furthermore, if it becomes impossible to detect peaks near the location of the target component's retention time due to overlap of large peaks originating from interfering components, or the like, then components which should properly be classified as (G2) or (G3) may end up being erroneously classified as (G1).
Namely, when evaluating whether or not the component is to be included in the narrowed set based on actually measured data, false negatives and false positives occur, leading to a reduction in screening accuracy and to unnecessary effort being expended on the screening.
Thus, it is practically rather difficult to select a mass / charge ratio not affected by interfering components in advance as the quantitation ion mass / charge ratio.

Method used


Image

  • Chromatography/mass spectrometry data processing device
  • Chromatography/mass spectrometry data processing device
  • Chromatography/mass spectrometry data processing device

Examples


Embodiment Construction

[0050]An embodiment example of a GC-MS employing a chromatography / mass spectrometry data processing device according to the present invention will be described below with reference to the appended drawings.

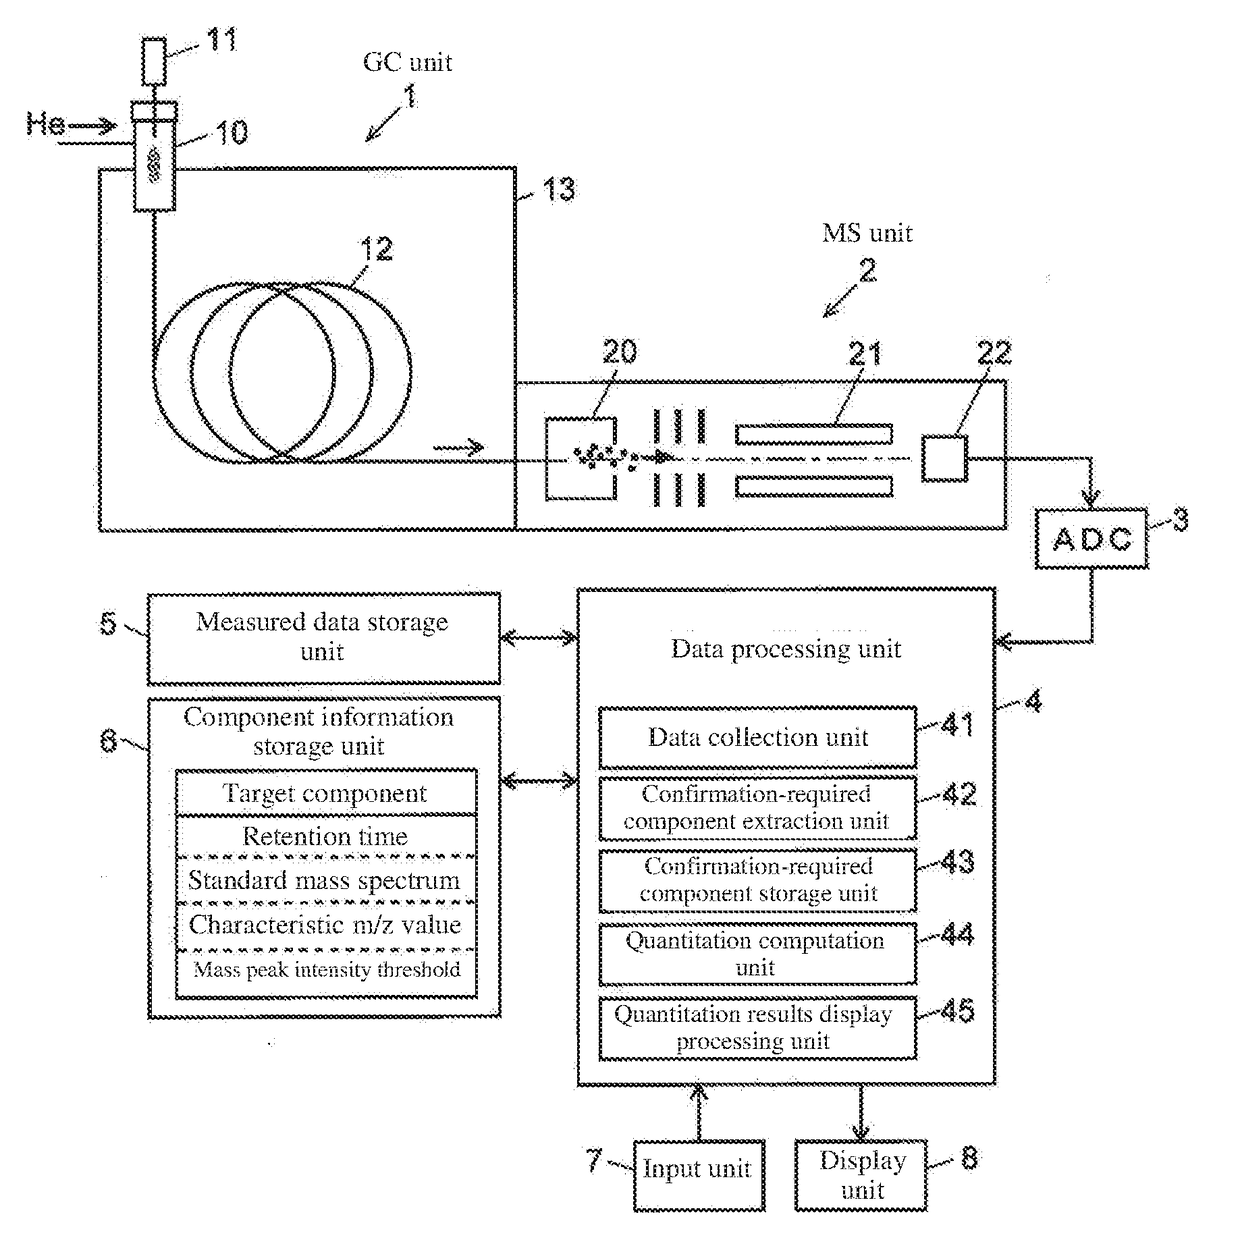
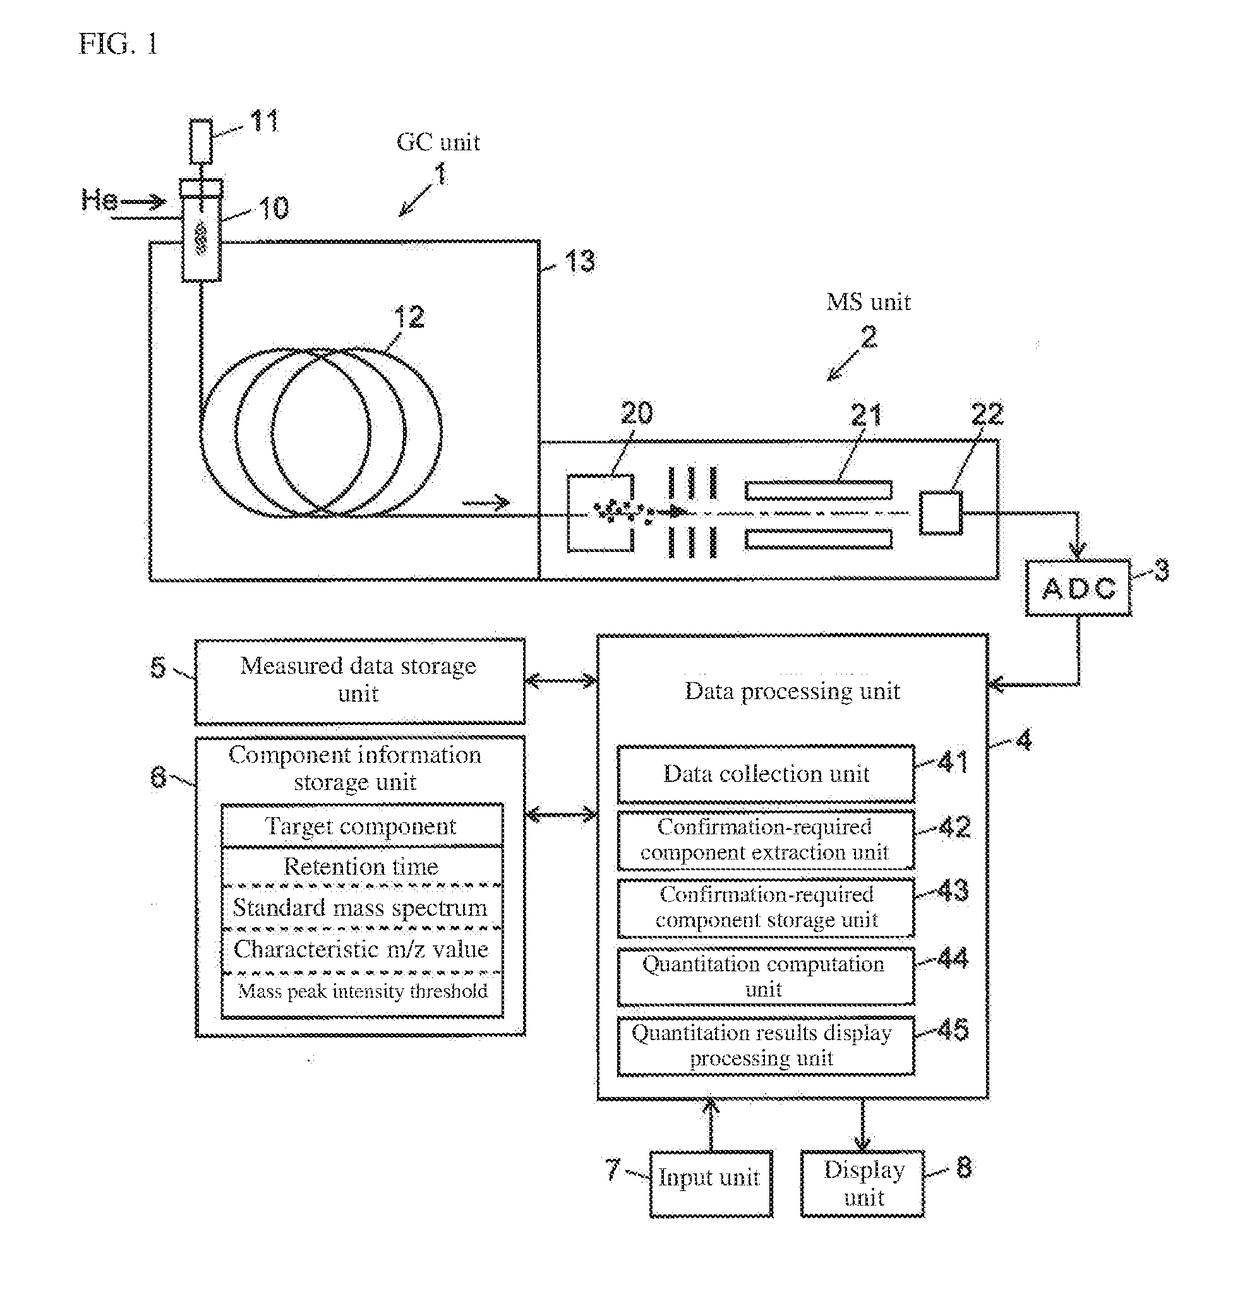
[0051]The GC-MS of this embodiment example comprises a GC unit 1 including a sample gasification chamber 10, injector 11, column 12, and column oven 13 which houses the column 12, and an MS unit 2 including an ion source 20, quadrupole mass filter 21 and ion detector 22, with the detection signals generated by the ion detector 22 being converted to digital data in A / D converter 3 and inputted into data processing unit 4.

[0052]In the GC unit 1, a carrier gas such as helium is supplied through the sample gasification chamber 10 into the column 12 at a constant flow rate. Small amounts of sample are injected from the injector 11 into the sample gasification chamber 10 at a predetermined timing based on instructions from an unillustrated control unit, whereupon the sample is instantan...


PUM

PropertyMeasurementUnit
chromatographyaaaaaaaaaa
mass spectrometryaaaaaaaaaa
mass spectrometeraaaaaaaaaa

Abstract

Peaks are detected on a mass chromatogram at multiple m / z ratios characterizing a target component, and the detected peaks are classified into groups according to their occurrence time. The measured mass spectrum is acquired for each group, the measured mass spectrum and standard mass spectrum of the target component are matched for each m / z, and the standard mass spectrum is normalized by multiplying it by the same scale factor for all the m / z ratios such that it does not exceed the peak intensities on the measured mass spectrum. The quantitation ion m / z peak intensity on the normalized standard mass spectrum is then examined, and if this intensity exceeds a preset threshold and the confirmation ion ratio determined based on the measured mass spectrum obtained for the target component is outside a reference range, then that target component is taken as a narrowed result candidate.

Description

TECHNICAL FIELD[0001]The present invention relates to a data processing device which processes data acquired with a chromatograph / mass spectrometer such as a gas chromatograph-mass spectrometer (GC-MS) or liquid chromatograph-mass spectrometer (LC-MS); more specifically, the invention relates to a chromatography / mass spectrometry data processing device suitable for screening analysis for a target component in samples containing many interfering components.BACKGROUND ART[0002]In chromatograph-mass spectrometers such as GC-MS and LC-MS, various components contained in a sample are separated by the chromatograph in the time direction, and ions originating from each of the separated components are detected. To quantitate a target component in a sample with a chromatograph-mass spectrometer, generally, a mass chromatogram at a mass / charge ratio m / z corresponding to the target component (also known as an extracted ion chromatogram) is generated, and the surface area of chromatogram peaks ...

Claims


Application Information

Patent Timeline
Patent Type & Authority Applications(United States)
IPC IPC(8): G01N30/86G01N30/72
CPCG01N30/72G01N30/8631G01N30/8679G01N30/8634G01N30/8644G01N30/8682H01J49/0009H01J49/0036
Inventor TANEDA, KATSUYUKI
Owner SHIMADZU CORP
Why Eureka
Try Eureka