Device and method using damped harmonic analysis for automated pulmonary and abdominal examination

Active Publication Date: 2019-07-25
UNIVERSITY OF WINDSOR
0 Cites 0 Cited by

AI-Extracted Technical Summary

Problems solved by technology

It has been recognized that conventional pulmonary diagnostics technologies, such as chest X-Ray and X-Ray CT, are not easily adaptable for the rapid, cost-effective deployment at the point of first contact with an injured patient or party in distress, outside of the clinical setting.
Similarly, the established traditional examination technique of clinical percussion (manual tapping on the body parts and listening for differences in the produced sound) is not well suited for the field conditions.
The use of manual ...

Method used

[0103]Signal classification parameters for each DHM include amplitude, phase, frequency, and damping factor. Additional classification parameters for each DHM may include damped frequency Ω and quality factor Q. Supplementary classification parameters derived from the signal waveform may include number of oscillations, number of zero crossings, zero-crossing rate, temporal envelope width at selected threshold levels, and other time- and frequency-domain parameters. The step of compu...

Benefits of technology

[0007]In one non-limiting object, the present invention seeks to provide an apparatus which is configured for use in identifying the existence of a potential pulmonary and/or abdominal conditi...

Abstract

An analyzer for diagnosing pulmonary and abdominals including, a pulsed force generator for outputting a mechanical disturbance to generate vibrations and reflected/return waves/vibrations in a patient's torso, and sensors for detecting the vibration/return wave signals. The apparatus compares the detected electrical signals with pre-stored reference wave profiles and based on the compared data generates an output signal indicative of a potential presence or absence of a pulmonary disease and/or condition.

Application Domain

Diagnostics using vibrationsAuscultation instruments +4

Technology Topic

DiseasePulmonary disease +8

Image

  • Device and method using damped harmonic analysis for automated pulmonary and abdominal examination
  • Device and method using damped harmonic analysis for automated pulmonary and abdominal examination
  • Device and method using damped harmonic analysis for automated pulmonary and abdominal examination

Examples

  • Experimental program(1)

Example

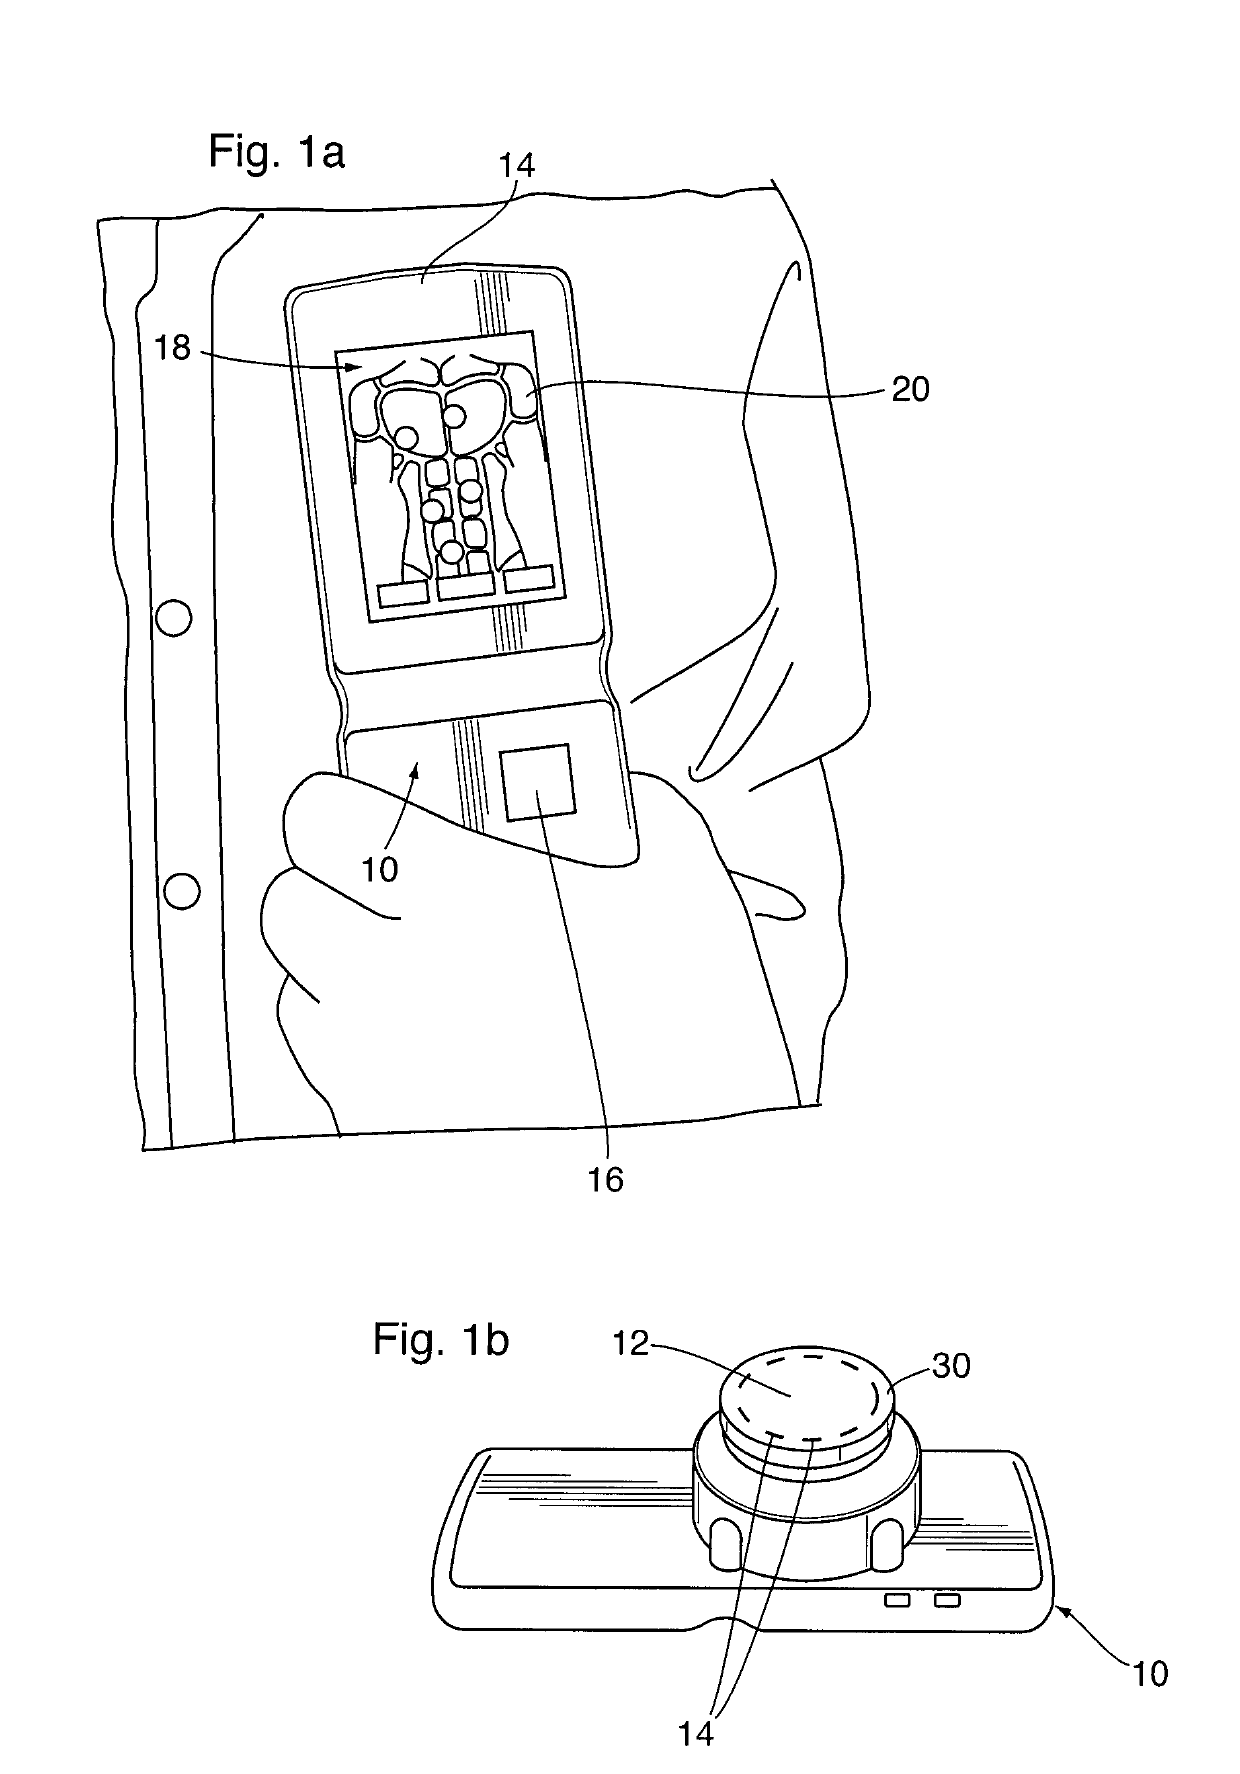
[0073]The following description describes a preferred embodiment of the invention and is used for descriptive clarity and is not intended to limit the application and use of the invention.
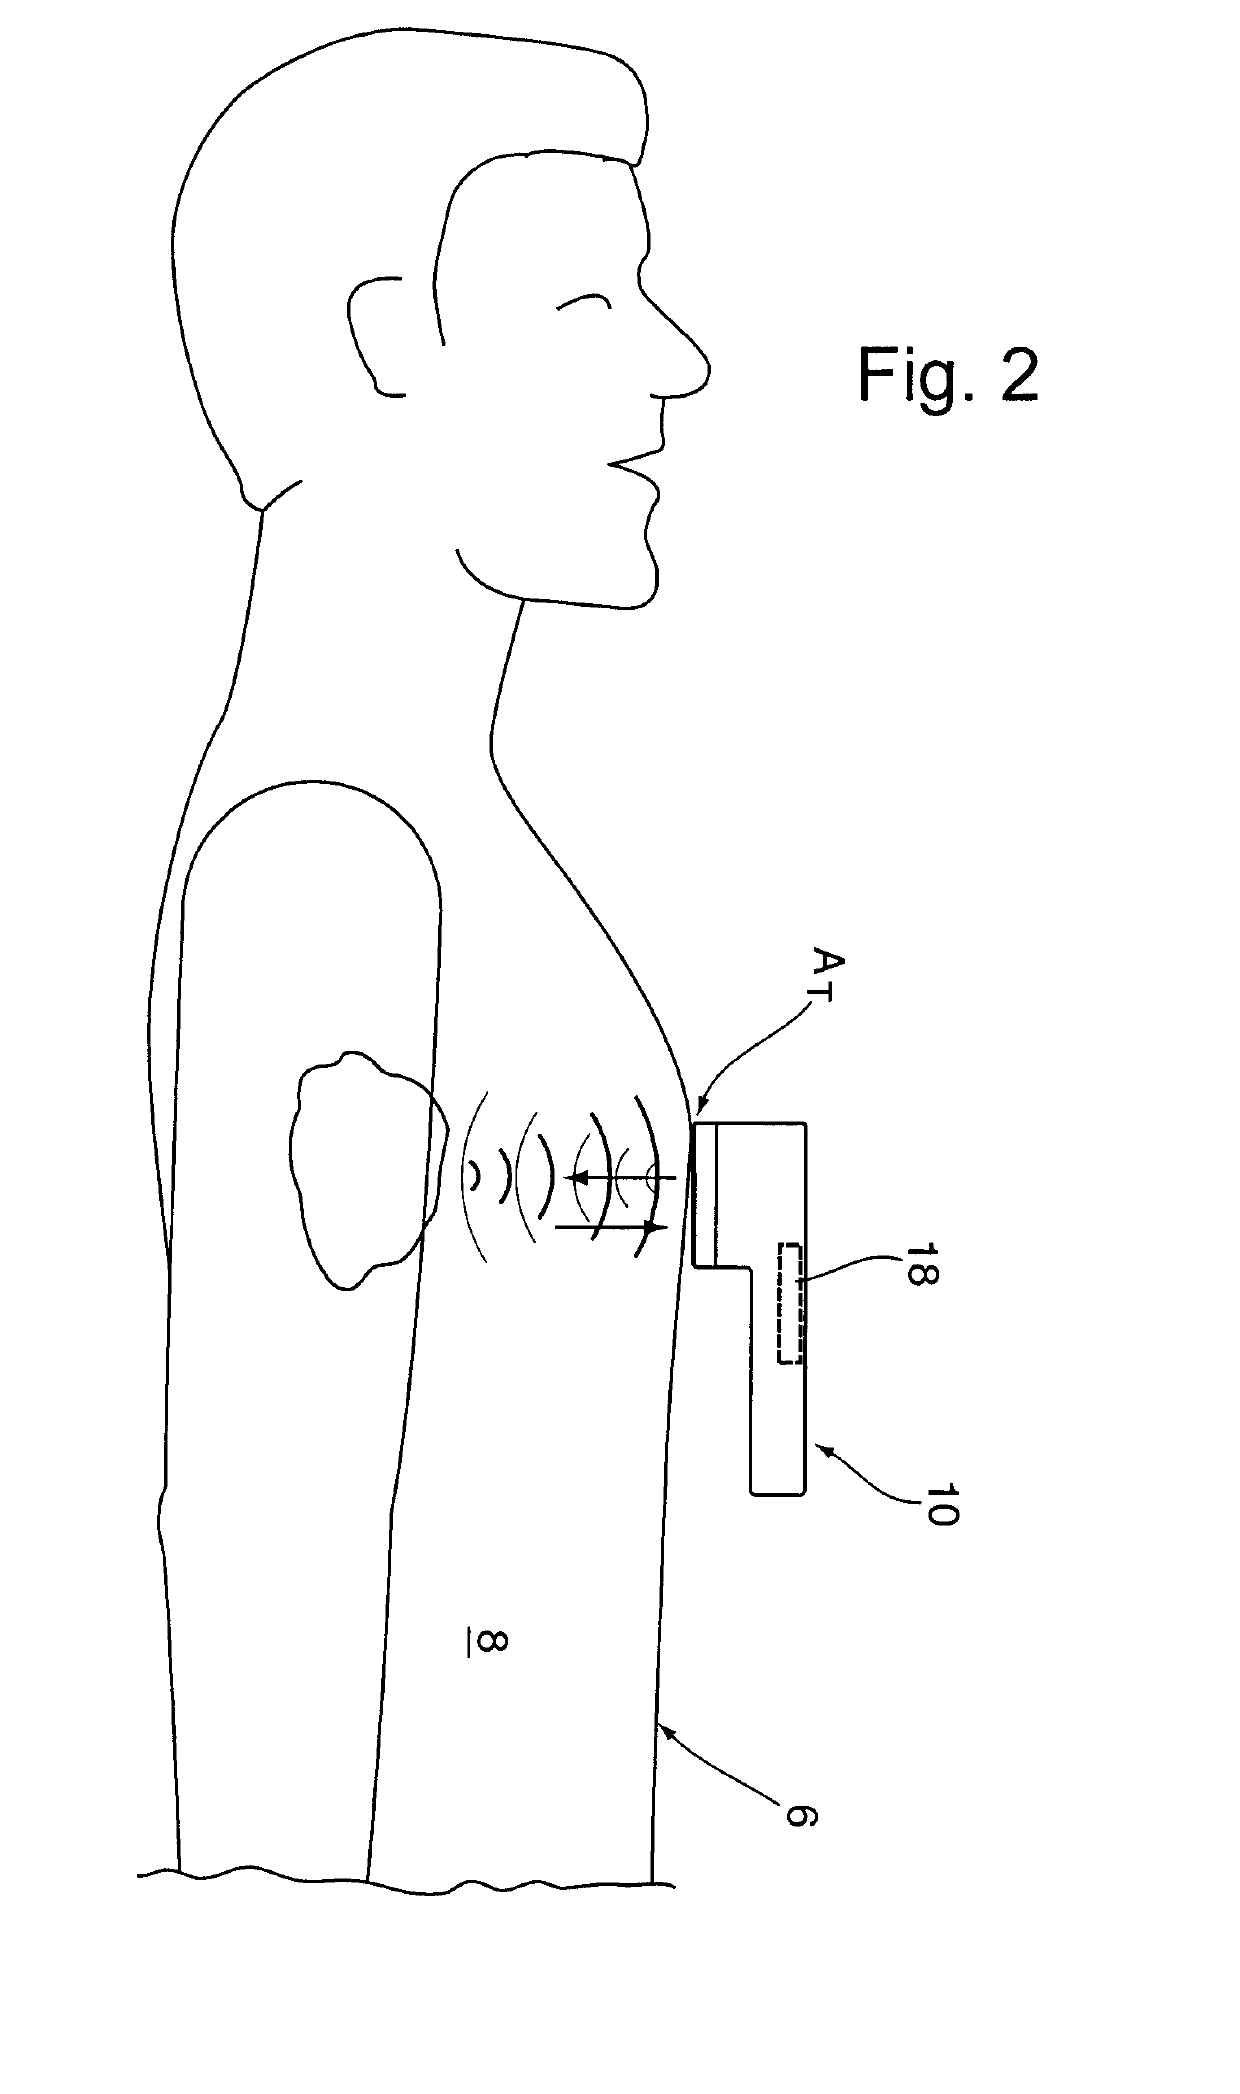
[0074]Reference may be had to FIGS. 1a and 1b which illustrate a portable diagnostic device or analyzer 10 used in the diagnosis of a potential pulmonary injury or condition in a patient 6 (FIG. 2) in accordance with a preferred embodiment of the invention. As will be described, the analyzer 10 is operable to generate and impart mechanical disturbance as an output pressure wave (shown as 100 in FIG. 5) or force on the patient's chest 8; and then detect and analyze the surface vibrations or the return reflected wave (shown as 150 in FIG. 6) produced thereby.
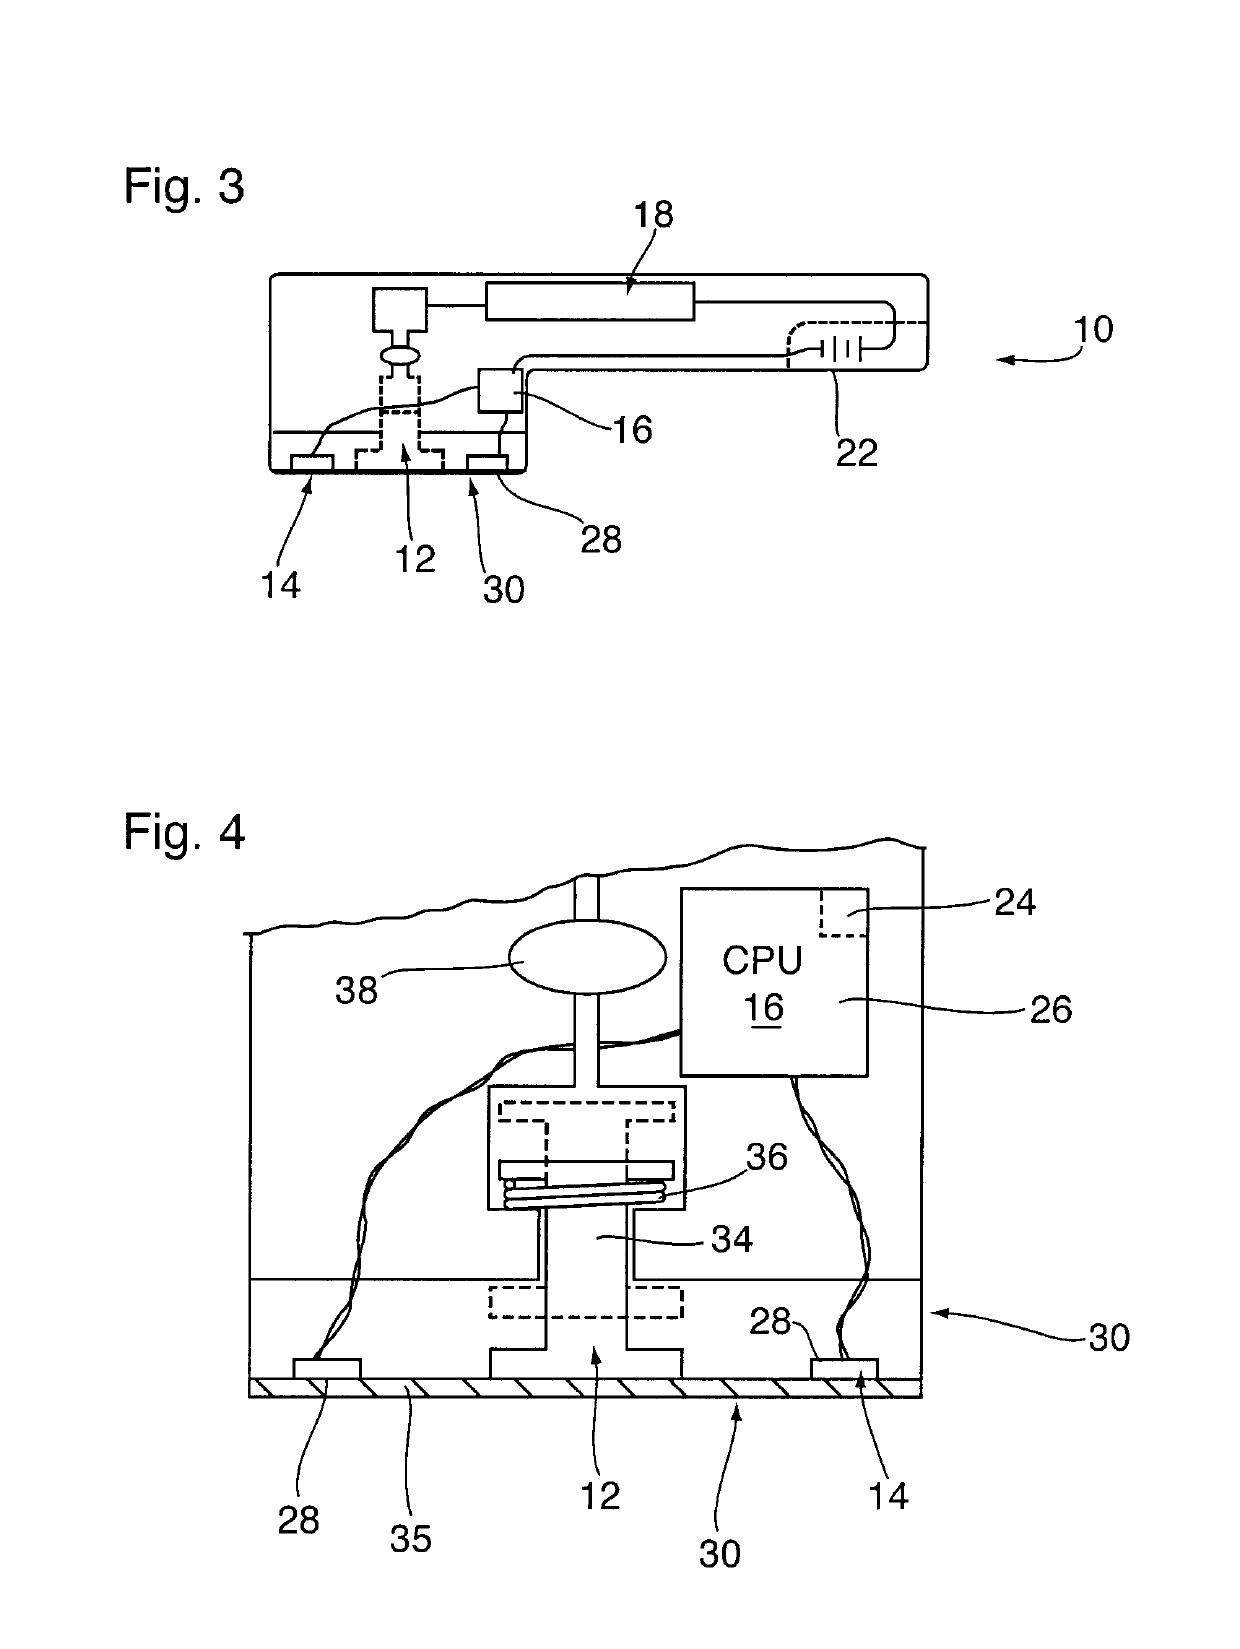
[0075]As shown in FIGS. 1a and 1b, the analyzer 10 includes a pulsed force generator 12, for generating the output pulsed force, a sensor assembly 14 for detecting return wave energy 150 and converting the detected energy into electric signals, a processing assembly 16 and an output display 18 which is operable to output to a user, a visual graphic output 20 identifying the absence and/or presence of a potential pulmonary and/or abdominal condition under test. Optimally, the analyzer 10 may be further operational to output via the display 18 both instructions regarding the initial placement and operation of the analyzer 10, as well as directions as to possible treatment and patient care, having regard to any condition or trauma identified.
[0076]As shown in FIGS. 2 and 3, the analyzer 10 is adapted for portable use and includes an internal battery power supply 22 which is used to provide electrical power to the pulsed force generator 12, sensor assembly 14 and processing assembly 16. The processing assembly 16 electronically communicates with each of the pulsed force generator 12, sensor assembly 14 and output display 18 and, as shown in FIG. 4, includes memory 24 and a central processing unit (CPU) 26 for receiving and storing data signals from the sensor assembly 14 and the pulsed force generator 12.
[0077]FIGS. 1a and 4 show best the sensor assembly 14 as including a number of acoustic transducers 28. The transducers 28 are positioned in a circularly extending array about the periphery of an analyzer sensing head 30 which is adapted to be placed in direct juxtaposed contact against a selected target area AT of the patient's chest 8. Each of the acoustic transducers 28 is configured to detect and transmit to the CPU 26 data signals representative of sensed reflected return energy waves 150.
[0078]FIGS. 4 to 6 illustrate best the pulsed force generator 12 and its operation in generating at the target area AT on the patient's chest 8 the output pulsed force 100.
[0079]The pulsed force generator 12 includes an electro-mechanically displaceable piston 34 which is engagable with a plessimeter 35, a resiliently deformable biasing spring 36 and a selectively operable electro-magnet 38. As shown best in FIGS. 5 and 6, the piston 34 is reciprocally moveable within a piston chamber 40 between the forward impact position contacting the plessimeter 35 shown in FIG. 5, wherein the forward most end 42 of the piston 34 is moved into engaging contact there against, whilst the plessimeter 35 is pressed against chest 8 at the target area AT; and the retracted position shown in FIG. 6, where the piston 34 is moved with its forward end 42 spaced rearwardly therefrom.
[0080]When activated, the electro-magnet 38 operates to move the piston rearwardly against the bias of the spring 36 to the retracted position shown in FIG. 6. In operation of the analyzer 10, the electro-magnet 38 is selectively cycled to release the piston 34 so as to move rapidly under the force of the spring 36 into contact against the patient's chest 8, thereby generating at the target area AT, an output initial pulsed force 100 of between about 0.5 and 4N, and with a frequency of up to 10 Hz, and preferably 1 to 2 Hz. The pulsed force generator 12 is operable to produce and generate an output pulsed force 100 which is sufficient to generate at the target area AT one or more return energy waves 150 which are detectable by the analyzer sensor assembly 14, having regard to the particular pulmonary and/or abdominal condition under test.
[0081]Although not essential, in a most preferred mode of operation, the pulsed force generator 12 is operable to output to the patient 6 a preselected output pulsed force 100 and which optionally, may vary having regard to the specific target area AT of analyzer use on the patient's chest and/or abdomen.
[0082]The pulsed force generator 12 is preferably operable to impart at the target area AT a mechanical force having a preselected, and most preferably consistent magnitude. In an alternate embodiment, the analyzer 10 may allow for variable adjustment in the output force 100 applied to the patient 6, depending on subjective factors such as the user's body type, age, or weight, and/or depending on the specific use site of the analyzer 10.
[0083]Following the activation of the pulsed force generator 12, activation of the piston 34 and impart into the patient's chest 8 the output energy wave 100, the sensor assembly 14 is operated to detect one, and preferably a number of return energy waves 150 which are generated within the patient's chest 8 by the activation of the piston 34.
[0084]Most preferably, the acoustic transducers 28 electronically transmit signals to the CPU 26 and memory 24. The CPU 26 operates with the memory 24 to effect signal detection conditioning and damping, and to output via the display 18 a visual signal analysis. In this regard, the analyzer 10 may be used in the automated generation and analysis to effect the unbiased diagnosis of pulmonary trauma or disease. Furthermore, by the use of consistent automation, the analyzer 10 advantageously eliminates subjective factors associated with the conventional, manual percussion diagnosis, allowing the analyzer 10 to be used in the field by non-medical or casually-trained professionals.
[0085]As shown in FIG. 7, the analyzer 10 is operated to perform each of the steps of producing or generating the initial output pulsed force 100 or percussion signal, and therefore sensing and detecting the return energy waves 150 which are produced by the initial wave energy 100 reflecting and/or transitioning through patient organs, fluids and/or bones. The step of generating the output pulsed force 100 or percussion signal, and detecting and performing initial processing of the reflected return energy waves 150 as pulmonary or abdominal percussion signals produced thereby, most preferably includes a number of sub-steps. These include effecting the initial mechanical disturbance or force transfer of a selected pulsed force at the target area AT surface of the chest 8 of the patient 6 under examination; detecting the return energy waves 150 reflected as percussion signals generated internally by the transfer of output pulsed force 100 to patient organs thereby; converting the detected return energy waves 150 into electrical signals; and using the CPU 26, selecting an informative (carrying useful diagnostic information) portion of the signal.
[0086]As described, the initial percussion is performed using portable pulmonary injury diagnosis analyzer 10, with the piston 34 operable to impact the target area AT of the patient's chest 8 with a preselected pulsed force.
[0087]The initial step of producing the mechanical disturbance at the surface of the patient's chest 8 generates a response from the underlying organs and tissues, which effects the generation of return and reflected wave energy 150. The return wave energy signal will have a natural resonant frequency(ies), which is(are) dependent on organ/tissue anatomy and physical condition. Most preferably the return wave energy signal includes a low frequency vibration or wave energy component having a frequency less than 1000 Hz, preferably less than 600 Hz, and preferably ranging from about 20 to 100 Hz. The internally generated signals are detected with the acoustic transducers 28, and converted to analog percussion signals.
[0088]The sub-step of detecting return wave energy signals produced by the output disturbance preferably includes receiving and detecting the reflected return energy waves 150 with the sensors assembly 14, and recording the generated signal in the device memory 24. The return energy waves 150 typically will consist of vibrations of external and/or internal organs and tissues produced by the mechanical disturbance.
[0089]As shown in FIG. 8, preferably the analyzer CPU includes stored programme instructions for operations by the use of damped harmonic analysis of the sensed return wave/vibration in the automated diagnosing of pulmonary and abdominal injuries. In a preferred mode, the analyzer 10 performs the step of generating the output mechanical force or disturbance to the patient's chest 8 by percussion to effect transmission of the predetermined and preselected pulsed force 100. The exertion of pulsed force to the patient's chest cavity 8 in turn results in the generation vibrations 150 by the subject's organs as the input disturbance 100 passes therethrough. According to a preferred method, the vibrations/reflected waves 150 generated by organs and/or tissues in the patient's chest 8 or abdomen in response to the input mechanical disturbance 100 are detected by the sensor assembly 14 and transmitted to the CPU 26 for initial processing.
[0090]In the CPU 26 conditioning the signal is further performed. Preferably, data representing the sensed vibration/wave signal as a sum of one or more damped sinusoids (herein damped harmonic modes (DHMs)); and the DHMs are used to classify the signal and output signal classification parameters. More preferably, the analyzer memory 24 stores a number of separate predetermined signals which are representative of a signal indicating a normal or optimum physical state, and/or signals which are indicative of a compromised stressed or injured state which for example could represent as particular trauma, disease or other condition. Depending upon the results of the comparison, the CPU 26 may thus be used to activate the output display 18 to illustrate to the user a particular visual graphic display 20 correlated to the most proximate condition pre-stored within the memory 24.
[0091]The step of conditioning the detected return energy wave signal preferably includes the sub-steps of: selecting an informative portion of the signal; and preparing the signal for the damped harmonic analysis. Selecting the informative portion of the signal includes examination of the digitized signal in order to identify one or more of its parts containing information about the response of the patient's body to the percussion event. Once identified, the informative portion is separated from the rest of the signal, and the separated portion is used as “the signal” during subsequent processing steps. Typically the identification of the information portion of the signal is performed by filtering and/or signal truncation. In a simplified method, the detected return energy wave is filtered with respect to pre-identified known background parameters.
[0092]The sub-step of preparing the signal for damped harmonic analysis may include increasing or decreasing the number of samples in the signal, windowing the signal, removing direct current (DC) offset from the signal, and filtering the signal. Filtering of the signal may remove at least one of undesirable low frequency components and undesirable high frequency components. The conditioned signal may be either kept in the computer memory 24 for further processing or recorded externally using a hard drive, flash memory, or any other suitable storage medium (not shown).
[0093]The step of representing the signal as a sum of one or more DHMs is preferably carried out by means of an appropriate damped harmonic analysis algorithm. Each DHM is a damped sinusoid - an analytical function completely defined by its four parameters: amplitude, phase, frequency, and damping. The combination of these parameters for all DHMs representing the signal provides complete information about the signal and may be used, either fully or in its part, for the signal classification and diagnostic purposes. Examples of possible damped harmonic analysis algorithms include, but are not limited to, the nonlinear spectral fitting with multiple Lorentzian curves, Prony's damped harmonic analysis algorithm and its derivatives, the matrix pencil method, signal approximation by single or multiple DHMs derived from the spectral envelope, the Pisarenko method, the approach based on finding coordinates of the poles of the complex Laplace transform of the signal, or any other appropriate algorithm capable of representing the signal as a sum of damped sinusoids.
[0094]The step of representing the signal as a sum of one or more DHMs may be effected by either analog or digital decomposition of the signal into a sum of one or more damped sinusoids defined by their respective amplitudes, phases, frequencies and damping coefficients. This decomposition may be either exact or approximate. In the case of approximate decomposition, the error may be described in terms of the difference between the actual signal and the signal represented as a sum of one or more DHMs. The error may be evaluated to judge an accuracy of the damped harmonic analysis performed on each particular signal.
[0095]If a Fourier spectrum-based algorithm is used for the step of representing the signal as a sum of one or more DHMs, a Fourier Transform may be performed on the signal, producing a frequency spectrum. The frequency spectrum may further be smoothed. FIG. 9 shows exemplary conditioned waveforms and spectra of sensed return energy wave signals generated from different chest and abdominal areas. Peaks of the frequency spectrum may then be determined. A suitable curve-fitting procedure may be used to approximate the determined frequency peaks. Preferably but not exclusively, a set of Lorentzian curves may be used to carry out the fitting process, with each curve representing the spectrum of an independent exponentially damped harmonic oscillator. The amplitudes, peak frequencies f and widths at half height (WHH) w of the Lorentzian curves may be determined according to a selected curve-fitting procedure, thereby concluding the decomposition of the signal into a set of DHMs. (The damping constant of the oscillator corresponding to each DHM b=w/2.) FIGS. 10 to 13 illustrate this approach by examples of two typical percussion signals.
[0096]FIG. 10 provides an illustrative example of a typical Fourier spectrum of an abdominal air signal (the solid line) recorded by the system. In this case, one Lorentzian curve (the dashed line) with the peak frequency f and the WHH w suffices to provide adequately close fitting of the main spectral peak.
[0097]FIG. 11 provides an illustrative example of a typical Fourier spectrum of a pre-identified normal upper chest signal recorded by the system and stored in memory 24. In this case, three Lorentzian curves (the dotted lines) with peak frequencies f1-3 and the associated WHH w1-3 provide adequately close fitting of the signal spectrum.
[0098]FIG. 12 shows that the analytical signal reconstructed from a single DHM (bottom graph) closely matches the original abdominal air signal recorded by the system (top graph). FIG. 13 shows that the signal reconstructed from three DHMs (bottom graph) closely matches the original upper chest signal (top graph) recorded by the system. In this case, the amplitudes of the DHMs were derived from the amplitudes of the corresponding Lorentzian curves, while phases were found by a separate reconstruction program. In the preferred embodiment, all four parameters for each DHM may be determined automatically by the damped harmonic analysis algorithm.
[0099]If the spectral envelope-derived single damped harmonic mode is used for the step of representing the signal as a sum of one or more DHMs, then the signal is approximated by a single damped sinusoid that is derived from the parameters of the spectral envelope. According to this approach, the damped frequency Ω is equal to the peak frequency, and the damping factor b equals half the WHH of the spectral envelope. For example, each set of waveforms and spectra shown in FIG. 9 has a distinct (relative to the other waveforms and spectra) combination of Ω and WHH of the single major spectral peak, which may be used as a signal classifier either alone or combined with additional spectral or time-domain parameters.
[0100]If Prony's analysis or any of its derivative algorithms, or the matrix pencil method is used for the step of representing the signal as a sum of one or more DHMs, then the frequencies, damping factors, amplitudes, and phases may be computed for the individual DHMs.
[0101]If a complex Laplace transform is used for the step of representing the signal as a sum of one or more DHMs, then the real and imaginary coordinates of the poles of the complex Laplace transform of the signal may be computed for the one or more DHMs. The frequencies may then be identified as the real coordinates of the poles of the complex Laplace transform, while the damping factors may be identified as the imaginary coordinates of the poles of the complex Laplace transform. Alternatively, the Pisarenko method or any other damped harmonic analysis algorithm may be used for the step of representing the signal as a sum of one or more DHMs.
[0102]The fourth step of classifying the signal and outputting at least one of the signal classification parameters preferably includes the sub-steps of: computing signal classification parameters for the DHMs; associating a multidimensional vector quantity with each signal, the vector coordinates being the values of the signal classification parameters; evaluating the vector quantities of each signal and classifying the signal as one or more of “tympanic,”“resonant,” and “dull”; or using a different gradation scale; and outputting at least one of the diagnostic classification and the signal classification parameters in numerical, graphical, audible, or other form.
[0103]Signal classification parameters for each DHM include amplitude, phase, frequency, and damping factor. Additional classification parameters for each DHM may include damped frequency Ω and quality factor Q. Supplementary classification parameters derived from the signal waveform may include number of oscillations, number of zero crossings, zero-crossing rate, temporal envelope width at selected threshold levels, and other time- and frequency-domain parameters. The step of computing signal classification parameters from the DHMs may be carried out according to any acceptable method known in the art. The results of the damped harmonic decomposition of the signal may thereby be processed to reconstruct the main modes of the signal. The process produces quantitative information that may be used as a distinctive classifier of percussion signals and may be represented in a graphical, numerical, audible, or other form to facilitate interpretation by an examiner.
[0104]The sub-step of associating a multidimensional vector quantity with each signal is carried out based on the fact that the vector coordinates correspond to the values of the signal classification parameters. The sub-step of evaluating the vector quantities of each signal and classifying the signal results in attribution of the signal to one or more of the three conventional categories of acoustic signals, “tympanic,”“resonant,” and “dull”. Such simple classification, for example, could be useful for rapid identification of severe pulmonary conditions, such as pneumothorax, where a “tympanic” signal detected in the upper chest region instead of a typically observed “resonant” one would indicate the presence of anomaly. A more refined gradation of the signals, based on the values of the above vector quantities, is also possible with this method and can be used to build diagnostic images in cases when detailed percussion examinations are performed. The sub-step of outputting the signal classification parameters may be carried out by a numerical or text display, a graphical display, an audible output, or any other form of output intelligible to an examiner.
[0105]The analysis and classification of pulmonary and abdominal percussion signals utilizes a model based on the general concept of a multi-mode exponentially damped harmonic oscillator that, besides the abdomen, may be applied to both upper chest and lower chest percussion. The system is preferably configured to decompose an arbitrary percussion signal into a sum of a small number of damped sinusoids called here damped harmonic modes (DHM) with corresponding amplitudes, frequencies, phases, and damping factors. These parameters combined fully define the original signal and therefore can be used for classification purposes. For example, a combination of two of the parameters associated with each DHM, namely, quality factor Q and the damped frequency Ω, has been experimentally found to have high diagnostic classification potential. As shown in FIGS. 10 to 13, a general percussion signal may be represented as a sum of a small number of DHMs, each representing a particular oscillating subsystem. Since only a few DHMs are required to represent the signal, this is an advantage over conventional Fourier analysis where a much larger number of infinite-duration sinusoidal waves is used for the same purpose. Accordingly, real chest percussion signal may be synthesized from several damped oscillator modes that were extracted from it according to embodiments of the invention.
[0106]It is envisioned that the analyzer 10 of the present invention may be used in a variety of differing operational modes and/or applications. In one possible mode of operation, the actuator 12 may be operated to transmit pulsed or disturbance forces to the patient using comparatively low frequency signals, as for example, at a rate of 1 to 100 beats or impact forces per minute, whilst the sensor assembly 14 may be selected to detect return percussion signals in a less than 0 to 600 Hz range, which correlates to either a natural frequency or harmonic of the patient's internal organs and/or body parts. The analyzer 10 may further be operable to utilize a damped harmonics mode and/or analysis to determine the return signal frequency, amplitude, phase, and/or other signal classifications.
[0107]More preferably, the device processing assembly 16 is selected to separate individual signals from a mixed return signal and/or provide signal recognition and referencing correlated to selected patient organs. The processing assembly 16 may furthermore store a map of base signals used to parse, recognize and/or analyze mixed return signals generated in the patient's chest/torso. It is to be appreciated that by the use of handheld portable device 10, the device may be operated in a non-evasive manner as a method of determining the condition of pulmonary function for human, veterinary or other animal use.
[0108]In other non-limiting constructions, however, the apparatus could operate to generate a pressure wave by the use of air and/or gas pressure, electric stimulation, or other physical impact devices, while the preferred embodiment describes the sensor assembly 14 as including acoustic transducers 28, the invention is not so limited. In another possible embodiment, the signals generated by return waves 150 may be detected using other acoustic and/or audio sensors which convert the detected energy into sensed electric data signals. Such sensors would include other types of non-contact sensors, such as air microphones, laser vibrometers, and other suitable non-contact vibration or pressure sensors. Alternatively, the return energy waves 150 may be detected using direct contact pressure sensors or other suitable apparatus, including, for example, a microphone embedded into a stethoscope head, a contact accelerometer, a piezofilm sensor, or any other suitable contact vibration or pressure sensor. The sub-step of converting the generated return energy wave signal into electrical signals also include amplifying and preconditioning, for example, by analog filtering, an analog return percussion signal. In an alternate embodiment, the signal may be preprocessed, as for example, by digitizing the output percussion signal and/or one or more detected return energy waves.
[0109]Although the preferred embodiment describes the analyzer 10 as having an internal processor assembly 16, the detected signals alternating either transferred to computer memory which is external for further processing, or recorded using a hard drive, flash memory, or any other suitable storage medium.
[0110]Although the detailed description describes an electro-magnetically actuable piston 34 as used to generate the output energy force 100, the invention is not so limited. Other force inducing constructions may also be used. Such generators include other moveable impactors activated by pneumatic, hydraulic, electromechanical, or electromagnetic means. Alternatively, the analyzer 10 may be operable to effect percussion using pressurized fluid sources, such as pneumatic impact or electromechanical sources operable to provide a pulsed force designed to reproduce the effect of percussion impact without the moving impactor.
[0111]While the detailed description describes the best mode, the invention is not limited to the described embodiment. In other non-limiting applications, the method and apparatus may also be used in a variety of applications including without restriction, in veterinary diagnostics; material analysis; change of state analysis in multiphase materials; and viscosity analysis of liquids, jells and semisolids.
[0112]A person skilled in the art will recognize from the previous detailed description and from the figures and claims, modifications and changes can be made to the preferred embodiments of the invention without departing from the scope of this invention defined in the following claims.

PUM

no PUM

Description & Claims & Application Information

We can also present the details of the Description, Claims and Application information to help users get a comprehensive understanding of the technical details of the patent, such as background art, summary of invention, brief description of drawings, description of embodiments, and other original content. On the other hand, users can also determine the specific scope of protection of the technology through the list of claims; as well as understand the changes in the life cycle of the technology with the presentation of the patent timeline. Login to view more.

Similar technology patents

Gastric retentive oral dosage form with restricted drug release in the lower gastrointestinal tract

ActiveUS7976870B2minimizes variabilityminimizes delivery
Owner:DEPOMED SYST INC

Classification and recommendation of technical efficacy words

  • minimizes variability

Gastric retentive oral dosage form with restricted drug release in the lower gastrointestinal tract

ActiveUS7976870B2minimizes variabilityminimizes delivery
Owner:DEPOMED SYST INC
Why Eureka
Try Eureka