Compositions and methods for the quality control of stem cell preparations
Active Publication Date: 2019-08-08
AELAN CELL TECH INC
0 Cites 1 Cited by
AI-Extracted Technical Summary
Problems solved by technology
For example, senescent mesenchymal stem cells (MSCs) have an impaired migratory capacity in response to pro-inflammatory signals and do not produce a therapeutic effect in many clinical trials.
Furthermore, there is evidence for a negative co...
Benefits of technology
[0006]Provided herein are methods and compositions for assessing the quality and potential of stem cells in a sample. Such methods and compositions are useful for helping to ensure the safety and quality of a population of stem cells before it is used in a subject.
[0007]In one aspect, provided herein is a method of assessing the quality of stem cells in a sample, comprising: (a) measuring the expression level of at least one RNA in the sample; (b) comparing the expression level of at the at least one RNA to a reference standard; and (c) using the comparison to determine the quality of stem cells in the sample. The measuring of the expression level of the at least one RNA may involve determining the quantity of unproductive stem cells in the sample. In some cases, the unproductive stem cells are not self-renewing. The method is applicable to stem cells from any organism or tissue. For example the quality of human stem cells, mesenchymal stem cells, or adipose-derived mesenchymal stem cells may be assessed by this method. The method may utilize a wide variety of samples. For example, the sample used for the quality assessment may comprise adipose tissue, for example adipose tissue that is ultimately used for transplantation. The sample used for the quality assessment may comprise a stromal vascular fraction, pericytes, mesodermal tissue differentiated from induced pluripotent stem cells, or bone marrow-derived stem cells. In practicing the method, the measuring of the expression level of the at least one RNA may comprise using qPCR. An increase in the expression level of particular RNAs, as measured by this method, may be correlated with an increase in the quantity of unproductive stem cells in the sample. Alternatively, a decrease in the expression level of particular RNAs, as measured by this method may be correlated with an increase in the quantity of unproductive stem cells in the sample. In some embo...
Abstract
Provided herein are methods and compositions for assessing the quality and potential of stem cells in a sample. Such methods and compositions are useful for helping to ensure the safety and quality of a population of stem cells before it is used in a subject.
Application Domain
Microbiological testing/measurementSkeletal/connective tissue cells +2
Technology Topic
PopulationBiology +2
Image
Examples
- Experimental program(7)
Example
Example 1: Replicative Senescence of Human Adult Adipose-Derived Stem Cells is Associated with Changes in Expression
[0065]This example shows differential gene expression in SR and SEN cells.
Isolation and Culture of hADSCs
[0066]Human adipose derived stem cells (hADSCs) were isolated from human subcutaneous white adipose tissue collected during liposuction procedures. The lipoaspirate was suspended in Hank's Buffered Salt Solution (HBSS, Life technology), 3.5% Bovine Serum Albumin (BSA, Sigma), 1% Collagenase Type II (Sigma) in 1:3 w/v ratio and shaken at 37° C. for 50 min. The cells were filtered through a 70 μm mesh cell strainer (BD Falcon #352350), treated with Red Blood Cell Lysis buffer (150 mM NH4Cl, 10 mM KHCO3, 0.1 mM EDTA, pH 7.3), and expanded ex vivo in DMEM/F12 complete medium (DMEM/F12, 10% FBS, 100 U/ml penicillin, 100 μg/ml streptomycin; Life technology) in 10% CO2 at 37° C. and passaged at 80% confluency, changing medium every 72-96 h. Cumulative population doublings were calculated by summing the population doublings (PD=log(N,N0)×3.33. where N0 is the number of cells plated in the flask and N is the number of cells harvested at this passage) across multiple passages as a function of the number of days it was grown in culture.
Senescence-Associated Beta-Galactosidase (SA β-gal) Staining
[0067]The SA-βgal activity assay was performed according to manufacturer's instructions (BioVision). The cells were washed with PBS and fixed with fixation solution for 15 min at room temperature. The cells were washed with PBS twice and X-gal staining solution was added with a staining supplement per well and incubated overnight at 37° C. The cells were washed twice with PBS, and the images were captured using a microscope (Nikon, TE300, DXM1200 Digital Camera, Japan).
[0068]As depicted in FIG. 1, hADSCs were isolated from healthy donor subcutaneous tissue and passaged ex-vivo as described above. Detection of senescence-associated β-galactosidase (10×) in self-renewing (SR) and senescent (SEN) hADSCs is shown. Samples were collected and processed for either transcriptomic or proteomic studies as described below.
Surface Marker Characterization
[0069]Surface CD antigen markers of SEN hADSCs were characterized. 5×10⁵ cells each were incubated for 30 min on ice in the dark with fluorochrome-conjugated antibodies (CD31, CD44, CD45 and CD105; Invitrogen) in PBS with 1% BSA (Sigma), washed and analyzed in a Guava EasyCyte Mini System (Guava Technologies, Millipore). Data analysis was done with FlowJo software (Tree Star, Ashland, Oreg.). CD antigen marker characterization revealed that SEN hADSCs express stromal markers CD29, CD44, CD73, CD90, CD 105 while staying negative for hematopoietic lineage markers CD31, CD34 and CD45 (Zuk, Zhu et al. 2002), indicating phenotypical stability of SEN hADSCs (Table 1, FIG. 2). Table 1 summarizes the immunostability of hADSCs in SR and SEN states.
TABLE 1 Immunostability of hADSCs in SR and SEN States Expression Chromosome Gene SR SEN Negative Markers 16 CD 11b − − 5 CD 14 − − 17 CD 31 − − 1 CD 34 − − 1 CD 45 − − 1 CD 106 − − 4 ABC G2 − − 3 CD 10 + + 2 CD 49d + + Stromal Markers 15 CD 13 ++ ++ 10 CD 29 ++ ++ 11 CD 44 ++ ++ 6 CD 73 ++ ++ 11 CD 90 ++ ++ 9 CD 105 + ++ 3 CD 166 ++ ++
[0070]FIG. 2A depicts the immunophenotype of hADSCs upon senescence, and shows a FACS analysis of hADSCs. hADSCs were stained with FITC (CD 31, CD44 and CD 45) or Alexaflour-488 (CD105) conjugated antibodies against cell surface markers and subjected to flow cytometry analysis. The cell populations are shown as fluorescence to side scatter graphs (top), and the histograms (bottom) of stained cells (labeled) compared to un-stained cells (labeled); with the percentage of positive cells indicated. FIG. 2B depicts the representative analysis of CD105, CD 44 and β-actin gene transcription by RNA-seq (discussed below).
Proteomic Analysis
[0071]Sample Preparation: Pellets from approximately 108 cells were lysed in 0.4 ml of lysis buffer (8M Gu-HCl+DTT). Samples were subsequently alkylated with 45 mM Iodoacetic acid (500 mM stock concentration in 1 M Ammonium Bicarbonate) in the dark fort h at room temperature. Residual alkylation agent was then reacted with 15 mM DTT. Samples were then diluted with 25 mM Tris-HCl 5 mM CaCl2 to 2.5 mL and added to a glass vial of trypsin (Pierce, 20 μg, in 250 μl of 25 mM acetic acid). Samples were allowed to digest for 20 hrs at room temperature. Samples were quenched with formic acid and introduced into the mass spectrometer.
[0072]Liquid Chromatography and High-Resolution Mass Spectrometry: Stem cell samples were prepared as described above and 1 μg was injected on to a Thermo Scientific Easy nLC system configured with a 10 cm×100 pm trap column and a 25 cm×100 μm ID resolving column. Buffer A was 98% water, 2% methanol, and 0.2% formic acid. Buffer B was 10% water, 10% isopropanol, 80% acetonitrile, and 0.2% formic acid. Samples were loaded at 4 μL/rain for 10 min, and a gradient from 0-45% B at 375 nL/min was run over 130 min, for a total run time of 150 min (including regeneration and sample loading). The Thermo Scientific LTQ Orbitrap Velos mass spectrometer was run in a standard Top-10 data-dependent configuration except that a higher trigger-threshold (20 K) was used to ensure that the MS2 did not interfere with the full-scan duty cycle. This ensured optimal fill-scan data for quantification. MS2 fragmentation and analysis were performed in the ion trap mass analyzer. Samples were run in triplicate.
[0073]MS Data Analysis: Protein identification was performed using Thermo Scientific Proteome Discoverer version 1.4 (including Sequest and Percolator algorithms) using the RefSeqHuman sequence database. The Percolator peptide confidence filter was set to “high”. Protein quantification was performed using Pinpoint version 1.4 software. The Pinpoint quantification workflow included importing the Proteome Discoverer .msf files as spectral libraries. Identified peptides were subsequently quantified in MS .raw files using the Pinpoint peak finding, chromatographic alignment and area calculation algorithms.
[0074]LC-MS/MS Proteome Expression Analysis: is shown in FIGS. 3A-C. Peptide expression levels are taken as the total area under the LC-MS/MS relative intensity curve (FIG. 3A) and individual peptides were unambiguously assigned to proteins using the Pinpoint software, version 1.4 (Thermo Scientific) as described above. The areas A of all peptides i assigned to an individual protein I were summed to yield raw (non-normalized) protein expression levels: I=Σi=1nAi. The raw protein expression levels I for each individual library, characterized as described in the previous section, were normalized against the total size of the library. For each protein i from library j, the normalized expression level I′ is calculated as:
I ′ = I i , j ∑ k = 1 N I k ,
[0075]where N is the total number of proteins from library j. Normalized protein expression levels for the three individual SR libraries and the three individual SEN libraries were compared using the Student's t test with a P-value cutoff of 0.05 to identify proteins that are differentially expressed between SR and SEN hADSCs.
[0076]FIGS. 3A-C depict a proteomic analysis scheme for evaluating differential expression between SR versus SEN hADSCs. FIG. 3A shows a schematic illustration of the proteomic analysis workflow and the approach used to quantify and normalize protein expression levels based on the LC-MS/MS proteome profiling. FIGS. 3B and 3C show the distributions of normalized protein expression levels for the three SR and three SEN libraries analyzed here.
Transcriptome Analysis with RNA-seq
[0077]RNA-sequencing (RNA-seq) was carried out to further assess changes associated with replicative senescence via transcriptome analysis. Expression of MSC-positive and MSC-negative CD markers was assessed. Sequencing tracks were uploaded to the UCSC genome browser. FIG. 2B depicts the representative analysis of CD105, CD 44 and β-actin gene transcription by RNA-seq.
[0078]Characterization of further gene expression levels with RNA-seq was performed on single replicates of self-renewing (SR) and senescent (SEN) human adult adipose derived mesenchymal stem cells (hADSCs) using the Roche 454 pyrosequencing platform. Individual sequence reads were mapped to the human genome reference sequence (UCSC hg18, NCBI build 36.1) using the program BLAT (Kent 2002). BLAT was used in light of the relatively long sequence reads provided by 454 (avg=216 bp; FIG. 4A), and the program was run with default settings with the exception that the minimal sequence identity was set to 99%. Ties between multi-mapping sequence reads were broken by selecting the mapping location where the read was maximally covered by NCBI RefSeq annotated exons.
[0079]FIG. 4A-C depict RNA-seq analysis scheme for evaluating differential gene expression between SR versus SEN hADSCs. FIG. 4A shows the length distributions of RNA-seq reads for SR and SEN hADSCs. The distributions are bimodal owing to the RNA isolation approach used to enrich for small non-coding RNA species (detailed in paragraph below).
[0080]Analysis of differential gene expression levels between SR and SEN cells was performed using an approach adopted from a recently developed method that was designed to be accurate at the relatively low sequencing depth provided by 454 and for single replicate experiments (Tarazona, Garcia-Alcalde et al. 2011). This approach employs a combination of two-parameters in order to define differential expression levels between genes: 1) the difference in the number reads per kilobase per million mapped reads (dRPKM) and 2) the expression fold-change (FC) level. This approach controls for liabilities of each individual metric; in particular, dRPKM is biased towards highly expressed genes, whereas FC is biased towards lowly expressed genes. In this approach, dRPKM is defined as: RPKMSR−RPKMSEN, and FC is defined as: log2 RPKMSR/RPKMSEN. For each locus, dRPKM and FC are plotted as a point in two-dimensional Euclidean space, and the Euclidean Distance (D) between the origin and the point is taken to represent the differential expression level. This approach was used separately to evaluate the differential expression of mRNAs and non-coding RNAs, including miRNAs, which are typically expressed at lower levels. For each class of RNA, empirical distributions of Ed were evaluated to call genes as differentially expressed. For non-coding RNAs, differentially expressed genes are considered as those with |FC|>0.95 and |dRPKM|>4.07, and for mRNAs differentially expressed genes are considered as those with |FC|>0.58 and |dRPKM|>2.32 (FIG. 4B)
[0081]FIG. 4B shows the approach used to identify SEN upregulated genes. A combination of fold-change (FC) and RPKM differences (dRPKM) was used as described above. FC and dRPKM distributions are shown along with the empirically determined cut-offs above which genes are considered to be SEN upregulated (cut-off in FIG. 4B is indicated by a vertical dotted line). FC and dRPKM are jointly analyzed with the Euclidean distance (Ed) to quantify the extent of differential expression.
[0082]FIG. 4C presents the overall scheme used to find differentially expressed miRNAs, which have mRNA target predictions from the mirSVR program, and is shown along with the corresponding numbers of miRNAs identified at each step.
[0083]Comparative transcriptomic analysis (RNA-seq) between SR and SEN hADSCs revealed a number of ncRNAs that are upregulated in SEN compared to SR hADSCs. Differentially expressed ncRNAs are identified as those that have levels of fold change (log2 SEN/SR) and differences in the normalized number of reads (dRPKM SEN-SR) as shown in FIG. 4B, where FC and dRPKM distributions are shown along with the empirically determined cut-offs above which genes are considered to be SEN upregulated (shown in the box). FC and dRPKM are jointly analyzed with the Euclidean distance (Ed) to quantify the extent of differential expression, 216 ncRNAs upregulated upon senescence have been identified (shown in the upper right quadrant of FIG. 5A). Three out of four upregulated ncRNA loci encode polycistronic transcripts that could be processed to yield multiple miRNAs (FIG. 5B): chr11:MIR100HG (encoding mir-125b1, mir-let7a-2, mir-100), chr13: MIR17HG (encoding mir-17, mir-18a, mir-19a, mir-20a, mir-19b-1, mir-92a-1) and chr22: MIRLET7BHG (encoding mir-3619, mir-let7a-3, mir-4763, mir-let-7b).
[0084]FIG. 5A shows differential expression of non-coding RNA genes in SR versus SEN hADSCs revealed by RNA-seq analysis. Fold-change values (loge SEN/SR) are shown on the x-axis and RPKM differences (loge SEN-SR) are shown on the y-axis. SEN upregulated non-coding RNA genes are shown in the upper right quadrant). FIG. SB shows genomic locations and locus names for SEN upregulated miRNA gene clusters revealed by RNA-seq analysis.
Example
Example 2: DifferentialExpression of microRNAs upon Replicative Senescence of hADSCs
[0085]This example shows differential expression of microRNAs (miRNAs) upon SEN of hADSCs.
[0086]Upregulation of functionally antagonistic MIR17HG and MIR100HG miRNA-bearing loci upon senescence was further investigated. The human chromosome 13 MIR17HG cluster (800 bp) encodes six tightly grouped miRNAs with four distinct “seed” sequences (Khorshid, Hausser et al. 2013, Hausser and Zavolan 2014): mir-17, mir-18a, mir-19a, mir-20a, mir-19b1, and mir-92a1 (schematically shown in FIG. 5C). The miRNAs from this locus have been designated as onco-miRNAs because of their importance in cell transformation and tumorigenesis (Kent and Mendell 2006, Mendell 2008). The chromosome 11 MIR100HG cluster houses three microRNAs (mir-125b1, mir-let7a-2, mir-100) situated within a comparable genomic distance (FIG. 5D).
[0087]miRNAs are frequently transcribed together as polycistronic primary transcripts that are processed into multiple individual mature miRNAs (Stefani and Slack 2008). To identify specific microRNA production from these clusters in SEN hADSCs, the abundance of mature miRNAs originating from both guide strand (mir-5p) and passenger strand (mir-3p/ mir*) by the MystiCq microRNA qPCR Assay System was examined, as described below.
RT-PCR
[0088]The microRNA was isolated using a mirPremier microRNA isolation kit (Sigma-Aldrich). microRNA was quantified with a NanoDrop ND-2000 Spectrophotometer (Thermo Scientific). For miRNA cDNA synthesis, the Mystic microRNA cDNA synthesis Mix kit (Sigma-Aldrich) was used. All microRNA assay primers were bought from Sigma-Aldrich.
Real-Time Quantitative PCR
[0089]Quantification of microRNA expression for candidate genes was performed by real-time quantitative PCR (qRT-PCR) using the LightCycler® 480 Real-Time PCR System (Roche). microRNA was reverse transcribed by using the Mystic microRNA cDNA synthesis Mix kit (Sigma-Aldrich). All microRNA assay primers were bought from Sigma-Aldrich. qRT-PCR reactions were performed with the mystic microRNA SYBR green qPCR ReadyMix in a MicroAmp optical 96-well reaction plate. The PCR amplification of microRNA was performed in a LightCycler® 480 Real-Time PCR System (Roche) using the following program: Cycle 1, 95° C. for 2 min. Cycle 2, 40 cycles of 95° C. for 5 sec, 60° C. for 30 sec. Relative expression values of microRNA were obtained by normalizing CT values of the microRNA genes in comparison with CT values of the endogenous control (U6) using the CT method.
[0090]Analysis of the MIR17HG cluster has revealed that only mature guide strand miRNAs: mir-17-5p, mir-18a-5p, mir-20a-5p, mir-19b1-5p and mir-92a1-5p, are detected in both SR and SEN hADSCs (FIG. 5C). No mature passenger strands: mir-17-3p, miR-18a-3p, miR-20a-3p, mir-19b1-3p and mir-92a1-3p, have been observed in the tested samples. Contrary to that, only mature passenger strand miRNA for mir-19a-3p was recorded by real-time PCR (FIG. SC). A statistically significant senescence-related increase in production of mature miRNAs has been observed, in accordance with their corresponding primary non-coding transcripts MIR17HG: miR-17-5p (p<0.001), miR-18a-5p (p<0.01), miR-20a-5p (p<0.01), mir-92a1-5p (p<0.001) and mir-19a-3p (p<0.01) (FIG. 5C and FIG. 6A). No significant change in the mature mir-19b1-5p has been detected upon replicative senescence of hADSCs (FIG. 5C).
[0091]The MIR100HG cluster gives rise to two guide strand mature miRNAs: mir-125b1-5p and mir-100-5p in SEN hADSCs. No mature passenger strands: mir-125b1-3p and mir-100-3p have been detected in the samples. Both guide mir-let7a-2-5p and passenger mir-let7a-2-3p have been detected in both SR and SEN conditions, where the balance in the stability/maturation preference of guide mir-let7a-2-5p is shifted upon SEN, favoring the production of passenger strand mir-let7a-2-3p (greater than 25-fold upregulation shown in FIG. 5C and 6A. This switch in the mature strand selection for mir-let7a-2 in SEN hADSCs is not due to an increase in AGO3 protein expression as was reported previously (Winter and Diederichs 2013). The level of endogenous AGO3 protein does not seem to change significantly with replicative senescence FIG. 6B. FIG. 6B shows protein levels of AGO-3 protein measured in proteotnic study as described above. Normalized protein expression levels are shown for three replicate samples each of SR versus SEN hADSCs.
[0092]Together, these data provide evidence that senescence of hADSCs correlates with a upregulation of the subset of mature miRNAs from the MIR100HG and MIR17HG clusters, and for some of them, such as mir-let7a-2, a notable shift in the maturation equilibrium between guide and passenger strands of microRNA has been observed. These abundantly upregulated mature miRNAs are called herein: senescence-associated micro RNAs (SA-miRNAs).
[0093]FIG. 5C depicts graphical representation of oncogenic MIR17HG locus and qPCR analysis of mature mirRNA expression in self-renewing (SR, left bar) and senescent (SEN, right bar) states of hADSCs. Relative expression of either passenger strand mature microRNAs (depicted in the graphs as −3p) or guide strand mature microRNAs (depicted in the graphs as −5p) to U6 small RNA was measured. Data are shown as fold change (ΔΔ τ). The mean±SD from three independent experiments is shown. The statistical difference was evaluated by Student's t-test and P-value (p) related to experimental measurements and are listed under the graphs, where ***p<0.001, * *p<0.01. FIG. 5D depicts graphical representation of tumor-supressive MIR100HG locus and qPCR analysis of mature miRNA expression in self-renewing (SR, left bar) and senescent (SEN, right bar) states of hADSCs. Relative expression of either passenger strand mature microRNAs (depicted in the graphs as −3p) or guide strand mature microRNAs (depicted in the graphs as −5p) to U6 small RNA was measured. Data are shown as fold change (ΔΔ τ) The mean±SD from three independent experiments is shown. The statistical difference was evaluated by Student's t-test and P-values (p) related to experimental measurements are listed under the graphs, where ***p<0.001.
[0094]FIG. 6 depicts mir-let7a-5p and AGO-3 analysis in hADSCs upon senescence. FIG. 6A shows the qPCR analysis of mature miRNA expression in self-renewing (SR, left bar) and senescent (SEN, right bar) states of hADSCs. Relative expression guide strand of mature microRNA mir-let7a-(depicted in the graphs as −5p) to U6 small RNA was measured. Data are shown as fold change (ΔΔ τ). Mean±SD from three independent experiments is shown. The statistical difference was evaluated by Student's 1-test and P-values (p) related to experimental measurements are listed under the graphs, where ***p<0.001. FIG. 6B shows the protein levels of AGO-3 protein measured in proteomic study as described in Example 1. Differential expression of proteins upon self-renewal (SR) and senescence (SEN) of hADSCs. Normalized protein expression levels are shown for three replicate samples each of SR versus SEN hADSCs.
Example
Example 3: Identification of the Targets of SA-microRNAs
[0095]This example characterizes the downstream gene targets of senescence associated miRNAs, using a combination of transcriptome and proteome analysis.
[0096]Despite the availability of miRNA target prediction algorithms, it still remains a challenge to accurately predict the potential target genes of a given miRNA. A number of these prediction algorithms use sequence, contextual, structural and/or evolutionary constraints and rely on subsequent validation of the targets by large scale mRNA expression level assessment (Sethupathy, Megraw et al. 2006). However, transcriptional analysis of miRNA target genes does not fully reveal the extent to which miRNAs can exert control on protein expression levels, which have a tendency to change more dramatically than mRNA levels (Liu 2008, Selbach, Schwanhausser et al. 2008, Hausser and Zavolan 2014).
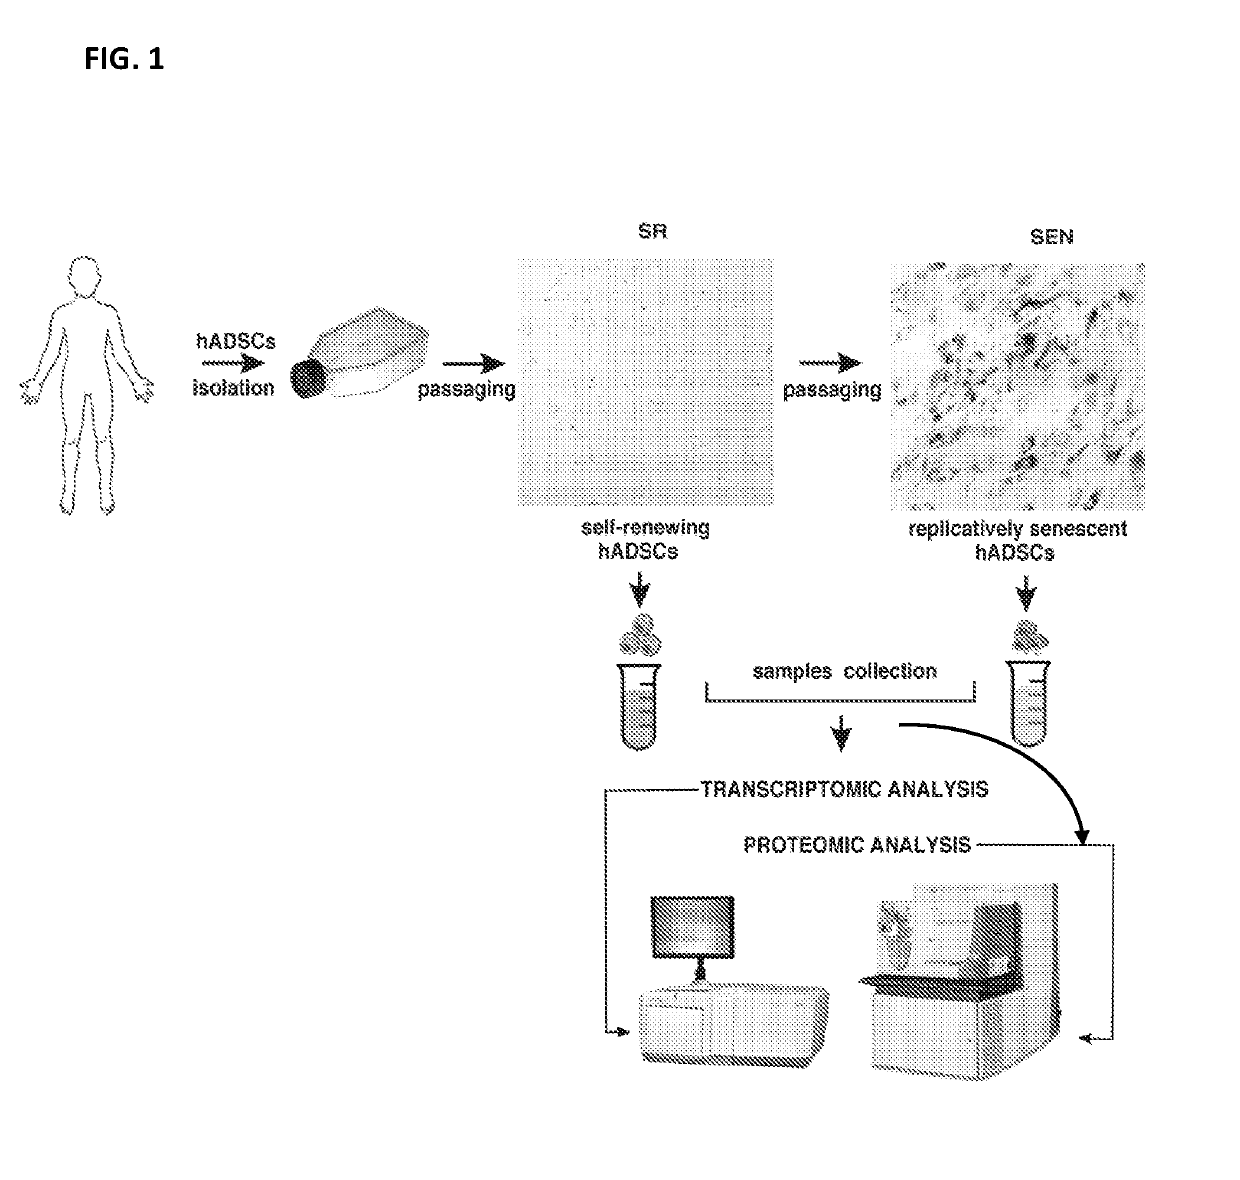
[0097]Thus, an integrated approach is taken here, as illustrated in FIGS. 1, 3, and described in Example 1 to simultaneously explore two mechanisms by which SA-miRNAs might exert their functional effects. FIG. 7 provides a schematic illustration of mRNA degradation versus translational repression modes of miRNA regulation: 1) mRNA degradation (FIG. 7A-left side of the figure; and 2) inhibition of protein translation without triggering mRNA decline (translational repression; FIG. 7A-right side of the figure.
[0098]To relate SA-miRNAs to the downregulation of their target genes at the level of mRNA and/or protein expression, the analysis has been focused on SEN downregulated mRNAs and proteins. SEN downregulated mRNAs are characterized as those that have low levels of fold change (log2 SEN/SR) and the smallest values for the difference in the normalized number of reads (dRPKM SEN-SR), There are a total of 937 SEN downregulated mRNAs that have been identified in this way (shown in the lower left quadrant of FIG. 7B). FIG. 7B shows the differential expression of protein coding mRNAs in SR versus SEN hADSCs. Fold-change values (log2 SEN/SR) are shown on the x-axis and RPKM differences (log2 SEN-SR) are shown on the y-axis, SEN downregulated protein coding mRNAs are shown (lower left quadrant). SEN downregulated proteins have been identified by comparing protein expression levels across SR versus SEN replicate samples. There are 986 proteins that have shown significantly lower levels of expression among SEN replicates compared to SR replicates (shown in the lower right quadrant of FIG. 7C). The heat map in FIG. 7C depicts differential expression of proteins in SR versus SEN hADSCs. Normalized protein expression levels are shown for three replicate samples each of SR versus SEN hADSCs (see z-score scale). SEN downregulated proteins are shown in the lower right quadrant.
[0099]Having identified SEN downregulated mRNAs and proteins in this way, the mirSVR prediction algorithm was applied to search for potential target genes of SA-miRNAs (FIGS. 5C and 5D) among these mRNAs and proteins. The mirSVR algorithm has been chosen because it combines miRNA-mRNA binding site sequence analysis with several additional sources of contextual information, including gene expression data from miRNA transfection experiments, in order to make target predictions (FIG. 8). Accordingly, mirSVR has been shown to yield a relatively low rate of false positive predictions for miRNA target identification (Betel, Koppal et al, 2010). mirSVR also provides scores in order to rank the predicted targets. For this study, a conservative approach is taken for miRNA prediction by only selecting targets with a score
[0100]Collectively, the SA-miRNA target genes captured by this approach represent numerous biological pathways (FIG. 14) relevant to the establishment and/or maintenance of the senescence phenotype pathways in hADSCs.
PUM
Property | Measurement | Unit |
Volume | 1.0E9 | L |
Volume | 0.0 ~ 6.0E9 | L |
Fraction | 0.22 | fraction |
Description & Claims & Application Information
We can also present the details of the Description, Claims and Application information to help users get a comprehensive understanding of the technical details of the patent, such as background art, summary of invention, brief description of drawings, description of embodiments, and other original content. On the other hand, users can also determine the specific scope of protection of the technology through the list of claims; as well as understand the changes in the life cycle of the technology with the presentation of the patent timeline. Login to view more.
Similar technology patents
Exhaust geometry for particle grouping
ActiveUS20120090306A1increase quantityreduce quantity
Owner:PEMRED
Method for transmission by using scheduling signaling, and apparatus
ActiveUS10356809B2increase quantity
Owner:HUAWEI TECH CO LTD
Manufacturing method of semiconductor device
Owner:SEMICON COMPONENTS IND LLC
Classification and recommendation of technical efficacy words
- increase expression level
- increase quantity
Process for Preparing High Levels of Interferon Beta
InactiveUS20090215121A1increase expression level
Owner:CADILA HEALTHCARE LTD
TAT-041 and methods of assessing and treating cancer
InactiveUS20070269434A1increase expression level
Owner:CHELSKY DANIEL +6
Treatment of renal cell carcinoma
ActiveUS11078278B2increase expression levelincrease
Owner:BRISTOL MYERS SQUIBB CO
Composition for promoting expression of aquaporin 3, and use thereof
PendingUS20200281834A1increase expression levelimprove skin moisture richness
Owner:SUNTORY HLDG LTD
Methods for preparing human thrombopoietin polypeptides by mammalian cell cultures
Owner:CAYOTA GUZICOVSKY ALFONSO +2
Method for blocking crank calls by using cloud computing and a system thereof
InactiveUS20120309365A1increase quantitynot be correct
Owner:NETQIN MOBILE BEIJING
Heat exchanger and method of producing the same
Owner:WALEO ENGINE COOLING
Small-size trampoline
InactiveUS20060172861A1increase quantitysave packing and transporting cost
Owner:SHEN TAI IND
Loop thermosyphon cooling device
InactiveUS20140116653A1increase quantityhigh heat dissipation efficiency
Owner:COOLING HOUSE
Aerosol transfer device for medical aerosol generators or medical aerosol generator systems
ActiveUS20060137685A1limit to depositionincrease quantity
Owner:LA DIFFUSION TECHN FR