System and method for evaluating speech perception in complex listening environments

a speech perception and listening environment technology, applied in the field of speech perception evaluation in complex listening environments, can solve the problems of lack of signal distortion, hearing loss, and degrading auditory skills with increasing hearing loss, and achieve the effects of enhancing different cues in speech perception, enhancing “place and manner” cues, and improving performance benefits

Active Publication Date: 2019-08-22
THE US REPRESENTED BY THE SEC OF THE DEFENSE
View PDF0 Cites 4 Cited by
  • Summary
  • Abstract
  • Description
  • Claims
  • Application Information

AI Technical Summary

Benefits of technology

[0096]FIG. 2 shows the mean estimate of the 50% SRT for each condition of the experiment, as calculated using the Tillman-Olsen technique used in the original QuickSIN test (Killion et al., 2004; Wilson et al., 1973). The results have been divided into three panels. The left panel shows performance in the four-talker babble conditions, where the masker was derived directly from the four-talker babble track on the QuickSIN CD.
[0097]The leftmost point in the left panel shows performance in the baseline four-talker babble condition of the experiment, which was essentially identical to the current clinical version of the QuickSIN test. This point shows that the mean SRT value in the babble condition was 1.0 dB, which is very close to the 1.9 dB mean SRT value reported in the original normative evaluation of the QuickSIN. Moving from that point to the right, we see that the addition of visual cues in the AV condition reduced the SRT by approximately 4 dB, which is comparable to the AV advantage reported for IEEE sentences by Grant et al. (1998). Similarly, the addition of BMLD cues in the N0Spi condition resulted in a reduction in the SRT of approximately 5.7 dB, which is comparable to the roughly 6 dB BMLD for speech reported by Levitt and Rabiner (1967). The combination of AV and BMLD cues in the AV+N0Spi cues resulted in a net reduction in the SRT of 9.1 dB, which is very close to the 9.8 dB reduction that would be predicted from the sum of the visual benefit in the AV condition and the BMLD in the N0Spi condition. We are unaware of any studies that have specifically examined the performance benefits obtained from stimuli that contain both audiovisual and BMLD cues, but the fact that the two benefits are very nearly additive suggests that they must be obtained from enhancing different cues in the perceived speech signals. This is consistent with the idea that the visual cues effectively enhance the “place and manner” cues in a voice waveform (which tend to occur at high frequencies), whereas the BMLD effectively enhances the voicing cues in a speech signal [which tend to occur at lower frequencies (Levitt and Rabiner, 1967)].
[0098]The middle panel of FIG. 2 shows performance in the three spatial conditions of the experiment, where the masker was composed of two spatially separated four-talker babble tracks. In the baseline spatial condition, the mean SRT50 was 0.7 dB, which was very close to the SRT50 found in the baseline babble condition. However, it should be noted that the similarity in these two SRT50 values is somewhat misleading because the spatial condition simulates a situation where the single four-talker babble noise in the baseline condition is replaced by two independent spatially separated four-talker babble noises that are each presented at the same overall level as the original noise track. Thus the spatial SRT50 really represents a case where the spatial release obtained by processing the target and masker waveforms with HRTFs almost exactly counterbalances the 3 dB decrease in overall SNR and the reduction in “dip-listening” opportunities caused by the addition of a second independent four-talker babble to the stimulus. Because of these differences, we believe it is only appropriate to make direct comparisons across conditions with the same number of masking talkers, so we have divided the results from the four-talker conditions and the eight-talker conditions into separate panels when displaying the results.
[0099]The SRT for the spatial condition increased 4.3 dB when a modest amount of room reverberation was added to the signal and by an additional 4.7 dB when the target talker in the reverberant environment was modified to speak at a rate 50% faster than the normal speaking rate in the IEEE corpus. Thus it seems that even normal hearing listeners have a substantial amount of difficulty understanding speech in listening environments that combine modest levels of room reverberation with speech signals that are produced without the slow and clear articulation normally used in clinical speech tests. These are exactly the types of speech distortions that are likely to occur in the public spaces that the elderly and hearing-impaired listeners tend to report having the most difficultly with, like bars, restaurants, and cafeterias.
[0100]The right panel of FIG. 2 shows performance in the SSN condition of the experiment, which produced a mean SRT50 value of 0.4 dB. The SSN condition differs from the standard babble condition in two ways. First, it contains a noise masker that is acoustically much different than the target speech signal and therefore much less likely to cause informational masking than the standard four-talker babble (Brungart, 2001). However, this reduction in informational masking is apparently offset by the elimination of pauses and gaps in the four-talker babble that would ordinarily let listeners “dip listen” to portions of the target signal that occur at a relatively high local SNR. The net effect is that listeners performed very similarly with the SSN and four-talker babble maskers.
[0101]FIG. 3 compares the mean values obtained in the two subjective SRT values obtained in each listening condition to the objective SRT50 values that were calculated using the method described in the previous section. In general, these results show very good agreement between the pattern of performance obtained across the different listening conditions for the subjective SRT100 and SRT0 values and the general pattern obtained using the traditional SRT50 measure of speech perception. As would be expected, the mean SRT50 value in each of the eight conditions fell somewhere between subjective estimates obtained for the SRT0 and the SRT100. In most cases, the mean SRT50 value fell roughly halfway between the SRT0 and the SRT100 estimates. However, there were two clear exceptions. The first was in the AV conditions of the experiment, where the SRT0 value was only slightly below the SRT50 value. In these conditions, it is likely that the visual cues available in the stimulus rapidly became more useful when a small amount of auditory information was introduced. This is consistent with the audio-only and audiovisual performance curves for IEEE sentences in noise presented by Grant and Braida (1991), which showed much more rapid increase in performance with SNR at low SNR values in the AV condition than in the audio alone condition.

Problems solved by technology

These auditory skills are known to degrade with increasing hearing loss.
Hearing difficulties due to hearing loss are often first apparent in difficult listening environments that involve noisy reverberant spaces, multi-talker conversations, rapid speaking rates, and other complicating factors that are typically not present in the clinical spaces or in the standardized tests used to assess hearing loss (Pienkowski, 2016).
This means that they lack the signal distortions that occur due to room reverberation in the kinds of indoor listening environments where most voice communication occurs.
The inability of current clinical speech-in-noise tests to capture the complexities of real-world speech communication is a significant problem in the assessment and treatment of hearing loss.
Virtually all practitioners of clinical audiology have encountered patients who perform acceptably in clinical testing, but report that they have substantial difficulty understanding speech in real world environments like bars and restaurants.
While some listening conditions were expected to be easier for speech communication than the standard QuickSIN condition due to the ability of a normal-hearing listener to benefit from the binaural release from masking, and from integrating audio and visual speech cues, hearing loss can potentially degrade these abilities, resulting in worse-than-normal performance in these conditions.
On the other hand, some listening conditions were expected to be more difficult than the standard condition.
However, without validating modified QuickSIN listening (simulation) conditions on hearing impaired individuals, it is not clear whether the simuli conditions would be effective in detecting speech perception impairment of a listener.

Method used


Image

  • System and method for evaluating speech perception in complex listening environments
  • System and method for evaluating speech perception in complex listening environments
  • System and method for evaluating speech perception in complex listening environments

Examples


example 1

nt of the Prototype Stimuli Using QuickSIN Sound Track

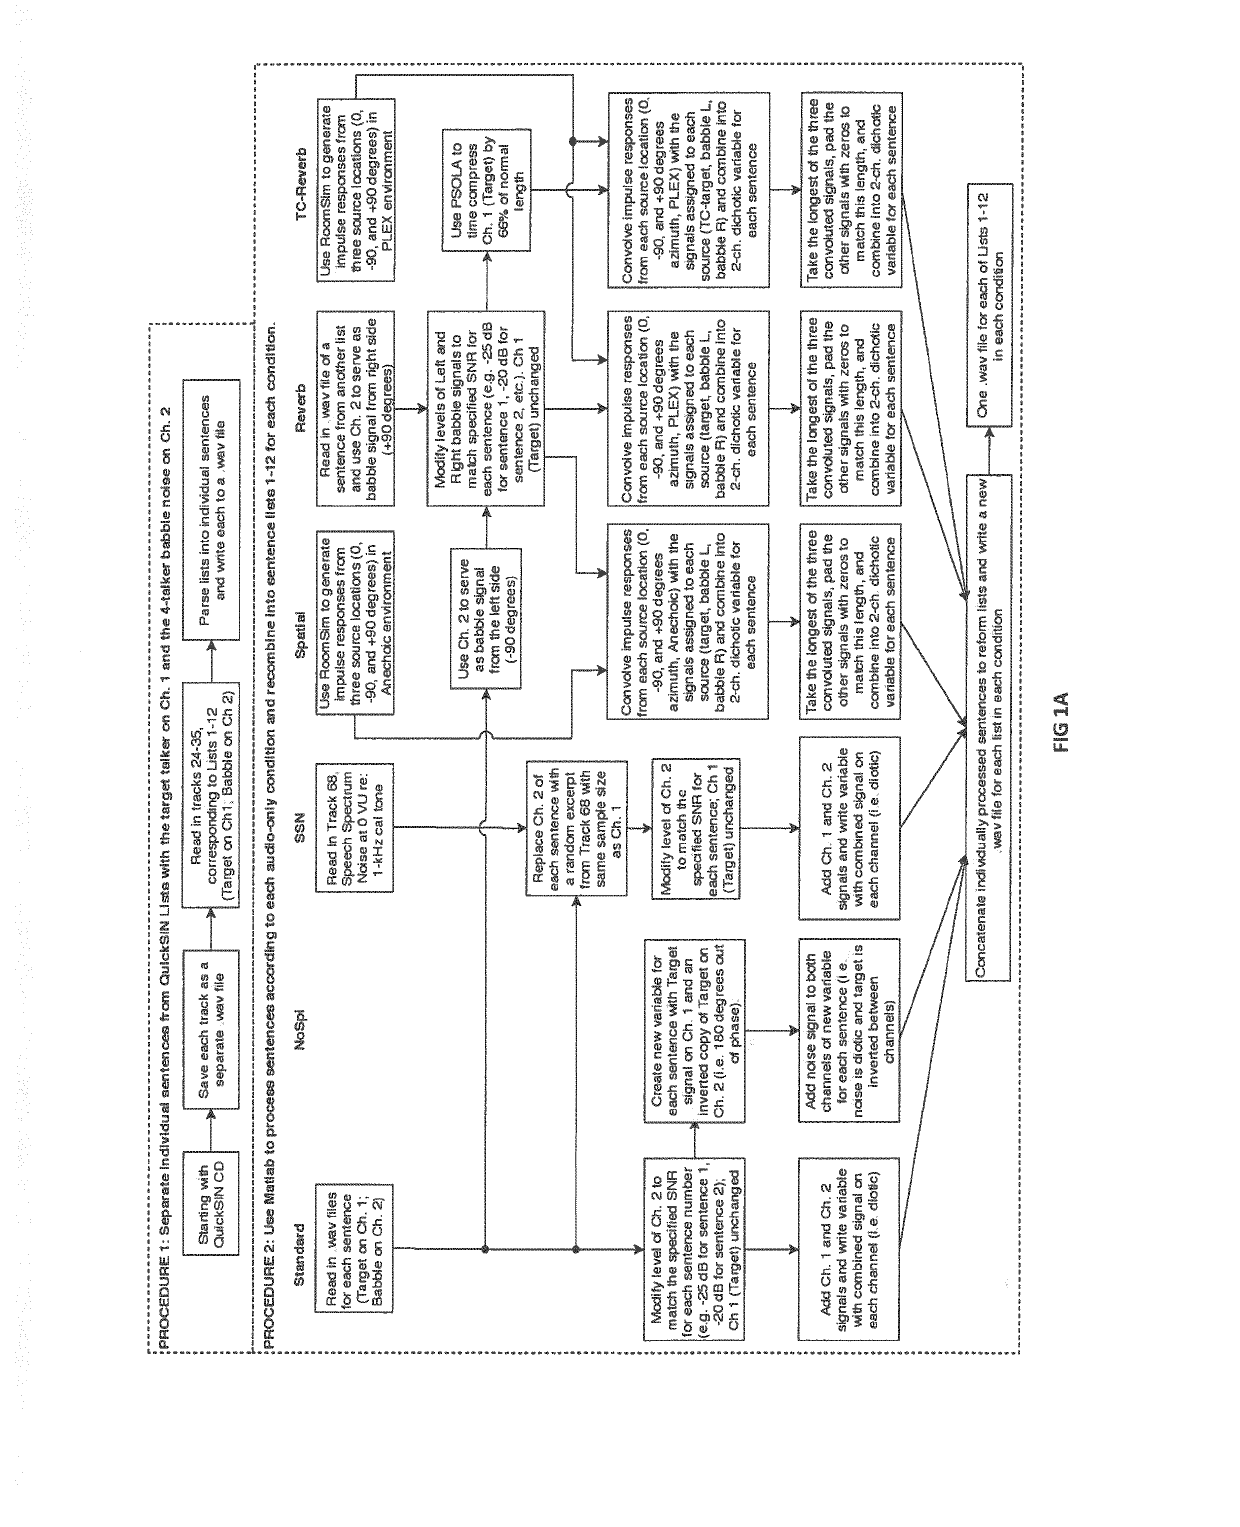
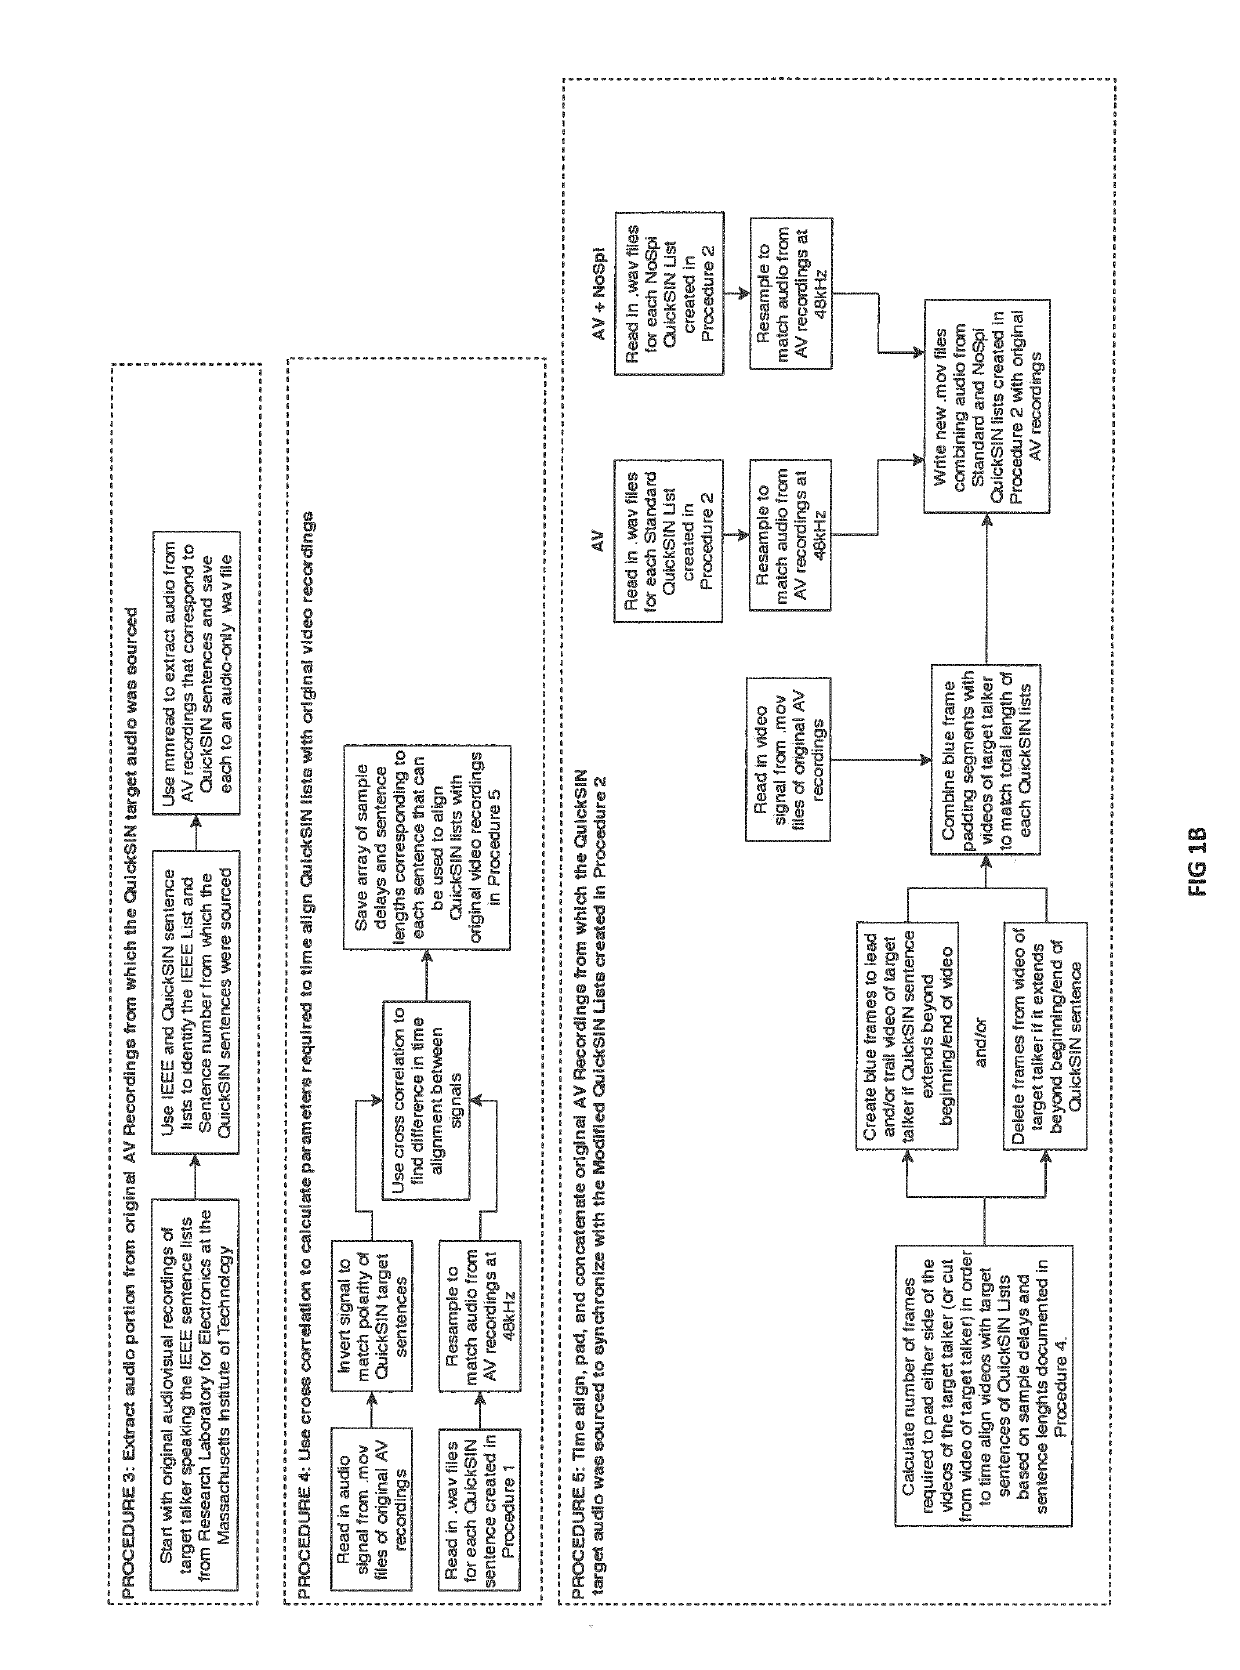
[0080]All of test stimuli conditions (i.e. simulation environment) used in Examples 1 and 2 were constructed by modifying the stimuli that were developed from the original QuickSIN test. The QuickSIN is a clinical speech-in-noise test designed to rapidly determine the minimum signal to noise ratio (SNR) a listener requires to correctly identify 50% of the keywords in a low-context sentence in the presence of a four-talker babble noise. The minimum SNR required for 50% correct keyword identification performance is referred to as the “speech reception threshold” or the SRT50. The QuickSIN estimates the SRT50 value of a listener by presenting a series of six sentences from the IEEE corpus at SNR values ranging from 25 to 0 dB. The target talker is always presented at a fixed level, usually at 70 dB hearing level (HL), and the SNR value is varied by adjusting the masker level relative to the target to present the first sentence at 25...

example 2

Speech Perception in Normal Hearing Participants in Complex Listening Environment

1. Methods

[0086]A. Participants

[0087]A total of 49 volunteer listeners (28 male, 21 female) with normal hearing participated in the study. All were recruited from the local community of employees, military members, and military dependents at the Walter Reed National Military Medical Center in Bethesda, Md. Their ages ranged from 20 to 45 yr (mean: 28.3 yr, r¼ 6.5 yr). All were given a full audiometric evaluation as part of their participation in the study, and all had hearing thresholds less than or equal to 20 dB in both ears at 250, 500, 1000, 2000, 3000, 6000, and 8000 Hz.

[0088]B. Equipment

[0089]The experiment was conducted with the listeners in quiet sound-treated listening booths while wearing Sennheiser HDA200 audiometric headphones connected to a GSI-61 audiometer (Grason-Stadler). The stimuli were generated with a control PC running MATLAB® with a soundcard (RME Hammerfall) connected to the auxi...

example 3

g Speech Perception Normal and Hearing Impaired Participants in Complex Listening Environment

I. Methods

A. Participants

[0129]Participants between 19 to 57 years of age, who were either civilian staff members or were eligible for health care, were recruited for this study at Walter Reed Army Medical Center (Washington D.C.) or at Walter Reed National Military Medical Center (Bethesda, Md.). Audiometric thresholds were either taken from the listener's health records, if measured within six months of the start of testing, or were measured clinically as part of the study. Listeners were divided in three groups, H1 (normal to near-normal), H2 (mild), and H3 (moderate to severe), according to the hearing profiles described in the US Army standard for medical fitness [AR40-501] (U.S. Department of Army, 1960). Those in the H1 group were subdivided into two groups: normal-hearing (H1NH), having thresholds ≤20 dBHL between 250 to 8000 Hz, and mild hearing loss (H1HL). FIG. 8 shows the mean an...


PUM


Abstract

The present application describes a plurality of test simulation environment mimic complex listening environment of everyday life, comprising a speech component, and a noise component. The application also describes an auditory testing system and method for evaluating a listener's speech perception and method to test hearing prosthesis or hearing protection device's effect on a person's speech perception in a complex listening environment

Description

CROSS-REFERENCE TO RELATED APPLICATION[0001]This application claims the benefit of priority from, and hereby incorporates by reference, U.S. Provisional Patent Application No. 62 / 631,700 filed on Feb. 17, 2018.STATEMENT REGARDING FEDERALLY SPONSORED RESEARCH OR DEVELOPMENT[0002]This invention was made with United States government support awarded by DMRDP Grant D61-I-10-J8-261.BACKGROUNDTechnical Field[0003]The present technology pertains generally to a method and system for evaluating a person's speech perception in complex listening environments, and more particularly to a system and method to evaluate speech perception using auditory stimuli that mimic real listening conditions spanning the range of auditory environments listeners would encounter in everyday life.Background[0004]Good hearing is essential to our ability to socialize, communication and work. A normal-hearing listener can communicate even in very complex listening scenarios using various auditory skills and processe...

Claims


Application Information

Patent Timeline
Patent Type & Authority Applications(United States)
IPC IPC(8): H04R25/00G10L21/0208H04R3/04H04S7/00
CPCH04R25/30G10L21/0208H04R3/04H04S7/303H04R2225/31G10L2021/02082H04S2420/01A61B5/123A61B5/7275G16H50/30A61B5/12G10L25/48
Inventor BRUNGART, DOUGLAS S.SHEFFIELD, BENJAMIN M.
Owner THE US REPRESENTED BY THE SEC OF THE DEFENSE
Why Eureka
Try Eureka