Cancer stem cell

Inactive Publication Date: 2020-02-06
CANCERSTEM TECH INC
0 Cites 0 Cited by

AI-Extracted Technical Summary

Problems solved by technology

However, it has been found that not all cancer cells forming cancer tissue have such properties, but cancer cells developing or progressing cancer are cancer stem cells that rarely exist in cancer cells.
However, cancer stem cells rarely exist in cancer cells constituting cancer tissue, and also cancer stem cells...

Benefits of technology

[0017]According to the cancer stem cells of the present invention, tumor tissue can be formed in model animal even with as low as 200 or less cells (in one particularly preferred aspect, one cell), and thus a tumor animal model can be more easily created. In addition, the cancer stem cells of the present invention can be used for screening of a cancer therapeutic agent, evaluation of efficacy of a cancer therapeutic agen...

Abstract

The purpose of the present invention is to provide: a cancer stem cell having an excellent ability to form tumor tissue; and a method for establishing the cancer stem cell. Cells having a low metabolic function of 26S proteasome are isolated and concentrated from a cancer stem cell group containing cancer stem cells, thereby obtaining cancer stem cells which can form tumor tissue in a living body even when the number of cells is 200 or less.

Application Domain

Compound screeningApoptosis detection +7

Technology Topic

Stem cell populationTumor tissue +8

Image

  • Cancer stem cell
  • Cancer stem cell
  • Cancer stem cell

Examples

  • Experimental program(3)

Example

Example 1
Separation and Characteristic Analysis of Cancer Stem Cell
[0083]1. Separation of Cancer Stem Cell
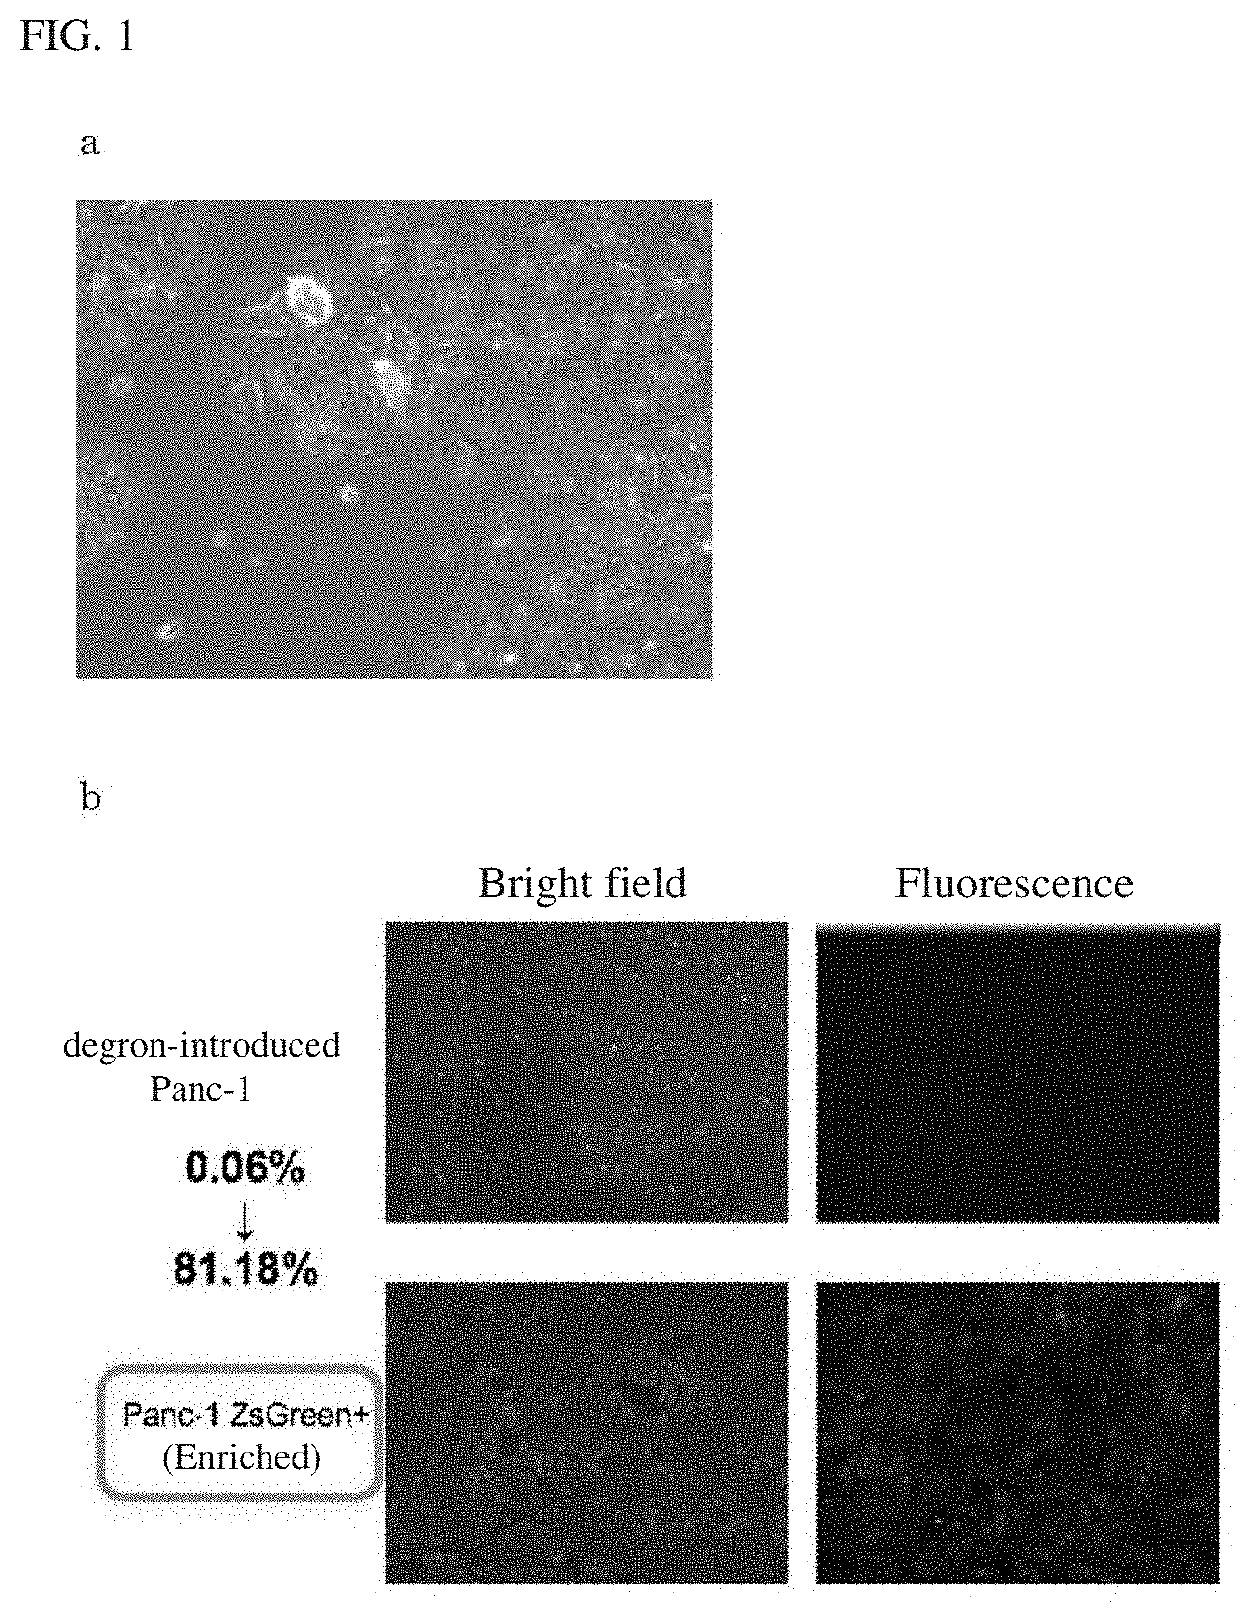
[0084]A pancreatic cancer cell line (Pane-1) was transduced with a GFP-fluorescently labeled ODC (Ornithine Decarboxylase)-Degron system using a retrovirus vector. The base sequence coding the used ODC-Degron is as set forth in SEQ ID NO: 1. After transduction, culture and selection were performed for 2 to 3 weeks, and the cells were observed. The results are shown in FIG. 1a. As can be seen from FIG. 1a, even when the ODC-degron system was introduced into the pancreatic cancer cell line Panc-1, only about 0:06% cells (cancer stem cells) emitting fluorescence were obtained in total. Such a small number of cancer stem cells do not allow for a series of experiments including drug screening.
[0085]For this reason, next, cells (cancer stem cells) emitting fluorescence (green) were sorted using a cell sorter (SH800Z purity sorting mode by SONY Corporation), followed by 2 weeks of culture in a 10 cm dish containing 10 ml DMEM (10% FBS, 1 mg/ml of G418) for enrichment of the fluorescent cells (cancer stem cells). The results of the observed enriched cells are shown in FIG. 1b. In this way, enrichment of the fluorescent cells (cancer stem cells) provided a cancer stem cell population in which cells having observed fluorescent coloring (i.e., cancer stem cells) accounted for about 81,18% in total. The obtained cancer stem cell population was designated as ZsGreen+.
[0086]2. Characteristic Analysis of Cancer Stem Cell
[0087]As to the obtained cancer stem cell population (ZsGreen+), in order to confirm the characteristics of the cancer stem cells, the ability to form spheres, anticancer drug resistance, ability to express a stem cell marker, and asymmetric division potency were confirmed. For comparison, a non-cancerous stem cell population (ZsGreen−) that was obtained through introduction of the ODC-degron system into the pancreatic cancer cell line Paric-1 and did not emit fluorescence was also subjected to characteristic analysis in the same way.
[0088]As to the ability to form spheres, using 96-well Ultra Low Cluster Plate, each cell population was seeded at 100 to 3000 cells/well and cultured at 37° C. in (DMEM) medium, and then the state of cell was observed over 2 weeks for confirmation,
[0089]As to the anticancer drug resistance, using a 96-well plate, each cell population was seeded at 5000 to 10000 cells/well and cultured at 37° C. for 2 to 4 days in a medium (DMEM medium containing 10% by volume FBS) supplemented with 2 or 5 μM oxaliplatin (L-OHP), and then the number of living cells were counted to determine the cell viability (%).
[0090]As to the expression of stem cell marker, expression of stem cell markers Bmil and CD44v9, and a cancer stem cell-specific marker Dclk1 was measured by qPCR and Western blotting. The expression levels of Bmil and Dclk1 were corrected with the expression level of the housekeeping gene (GAPDH), and the expression level of CD44v9 was corrected with the expression level of the housekeeping gene (Actin).
[0091]As to the asymmetric division potency, using ibidi 35 mm Plate, each cell population was seeded at 1000 to 10000 cells/plate and cultured at 37° C. for 1 day in a medium (DMEM medium containing 10% by volume FBS), and then the condition of cells was continuously observed over 1 week for confirmation. Note that cancer stein cells have the property of asymmetrically dividing to produce daughter cells having different properties, resulting in genetically heterogeneous cell division.
[0092]In FIG. 2, the result of confirmation of the presence or absence of characteristics of cancer stem cells is shown for the cancer stem cell population (ZsGreen+) and the non-cancer stem cell population (ZsGreen−, negative control). In FIG. 2, the result of evaluation of the ability to form spheres is shown in a, the result of evaluation of the anticancer drug resistance in b, the result of evaluation of the ability to express a stem cell marker in c, and the result of evaluation of the asymmetric division potency in d. As a result, the cancer stem cell population (ZsGreen+) has an ability to form spheres, anticancer drug resistance and asymmetric division potency, and observed expression of the stem cell markers and the cancer stein cell-specific marker, confirming that the population has characteristics of cancer stem cells.
[0093]3. Analysis of Tumorigenicity
[0094]Following tests were performed to confirm the tumorigenicity of the obtained cancer stem cell population (ZsGreen+). First, subcutaneous transplantation of the cancer stem cell population (ZsGreen+) was performed to 6 to 8 weeks old. SCID beige mice (n=3) so as to provide 150 cells each. Six weeks later, the site where the cells were transplanted was observed to confirm the presence or absence of tumor formation. For comparison, also for the non-cancer stem cell population (ZsGreen−), the tumorigenicity was analyzed in the same way.
[0095]The obtained result is shown in FIG. 3. As a result, the transplantation of only 150 cells from the cancer stem cell population (ZsGreen+) successfully formed a tumor having a diameter of about 10 mm or more, making it clear that the tumorigenicity is high. On the other hand, the transplantation of 150 cells from the non-cancer stem cell population (ZsGreen−) failed to form a tumor.

Example

Example 2
Separation and Characteristic Analysis of Cancer Stem Cell Highly Expressing CD44v9
[0096]1. Separation of Cancer Stem Cell Highly Expressing CD44v9
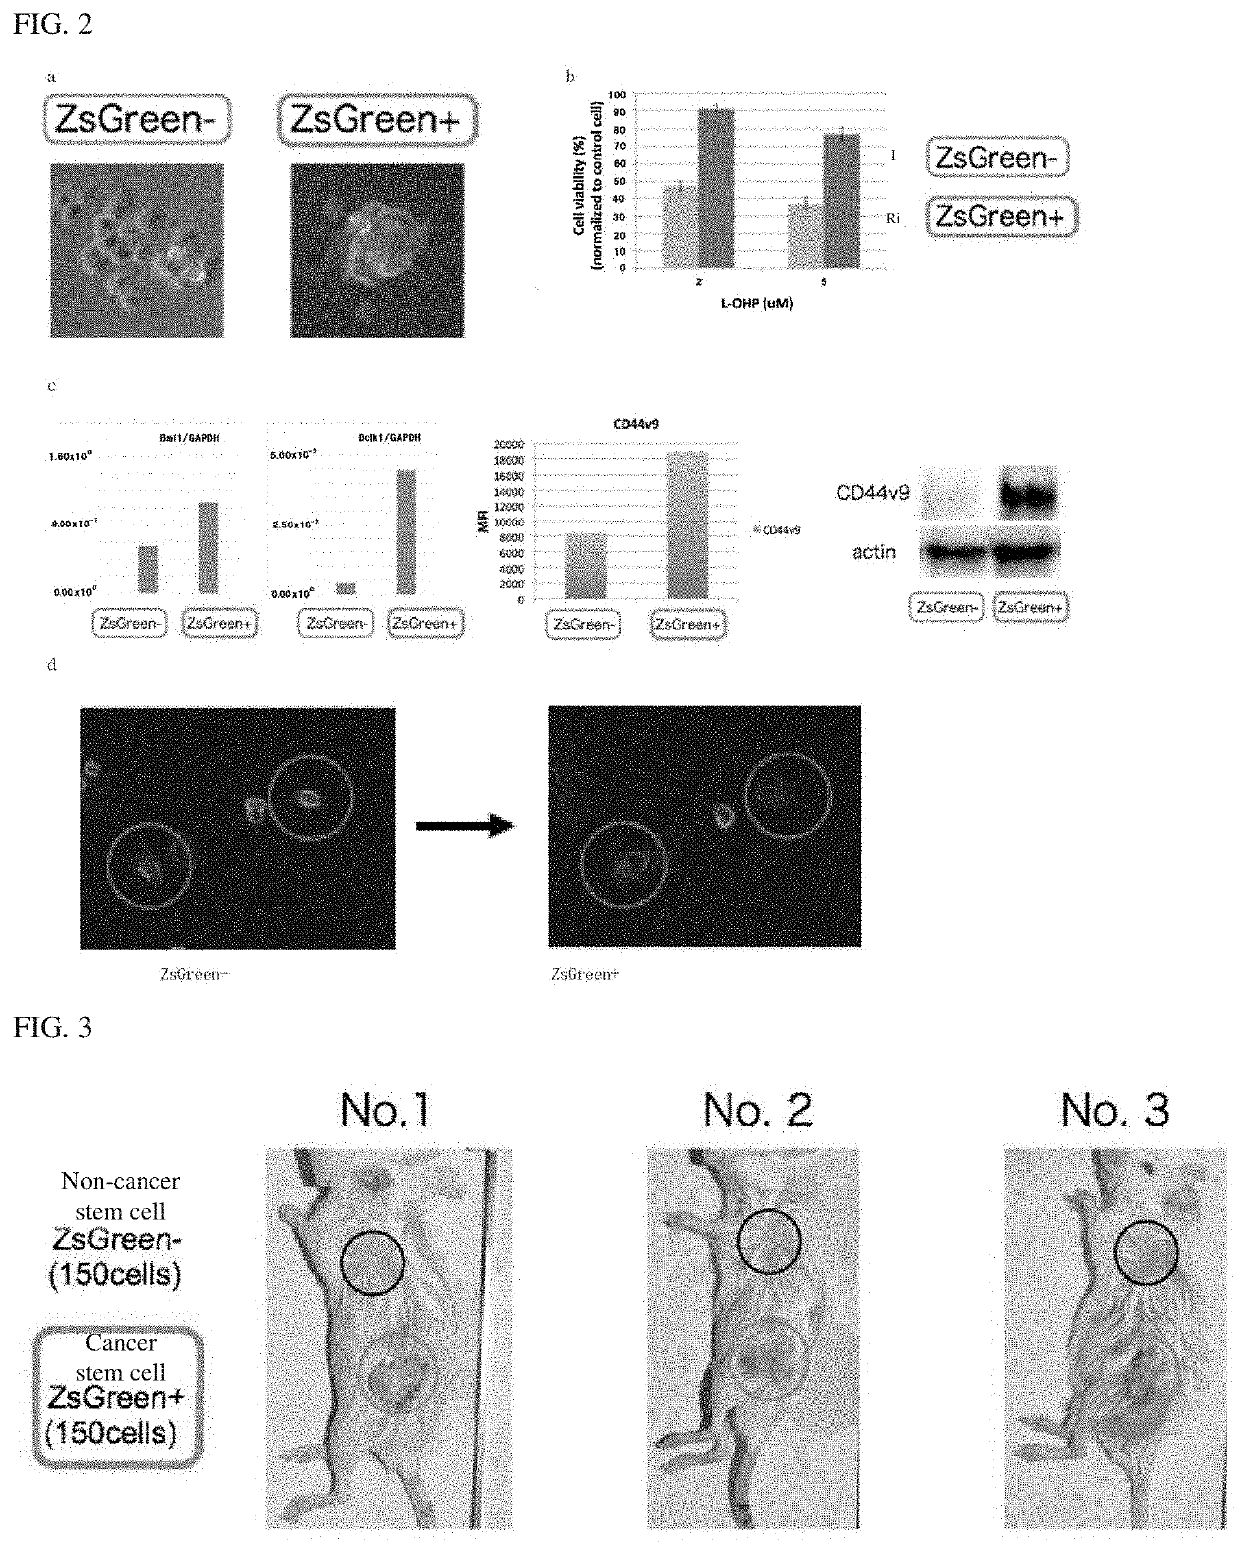
[0097]As to the cancer stem cell population (ZsGreen+) and the non-cancer stem cell population (ZsGreen−) obtained in Example 1, they were divided into a group highly expressing CD44v9 or a group not highly expressing CD44v9 depending on the expression level of CD44v9 by FACS using an anti-CD44v9 antibody. Compared to cells having the lowest expression level of CD44v9 (detection threshold) in the cell population, cells having 10 times or ore expression level of CD44v9 were grouped as high expression of CD44v9, and cells having less than 5 times expression level of CD44v9 were as non-high expression of CD44v9. Hereinafter, a cell population having high expression of CD44v9 is denoted as “ZsGreen+/CD44v9high” in the cancer stem cell population (ZsGreen+), a cell population non-highly expressing CD44v9 in the cancer stem cell population (ZsGreen+) is as “ZsGreen±/CD44v9−”, a cell population having high expression of CD44v9 in the non-cancer stem cell population (ZsGreen−) is as “ZsGreen−/CD44v9high”, and a cell population non-highly expressing CD44v9 in the non-cancer stem cell population (ZsGreen−) is as “ZsGreen−/CD44v9−”.
[0098]2. Analysis of Tumorigenicity
[0099]Under the same condition as that of “3. Analysis of tumorigenicity” described in Example 1, the tumorigenicity was analyzed. The obtained result is shown in FIG. 4. Six weeks after transplantation, for the ZsGreen−/CD44v9high cell population, no tumorigenesis was observed via transplantation of 150 cells, whereas for both of the ZsGreen+/CD44v9high and ZsGreen+/CD44v9 cell populations, formation of a tumor having a diameter of about 15 mm was observed via transplantation of 150 cells.
[0100]3. Gene Analysis By Next-Generation Sequencing
[0101]Intermolecular network pathway analysis was used to analyze genetic differences among the ZsGreen−/CD44v9high, ZsGreen+/CD44v9− and ZsGreen−/CD44v9− cell populations.
[0102]Specifically, using TruSeq stranded mRNA sample prep kit (Illumina, San Diego, Calif.), an mRNA library was prepared according to the manufacturer's instruction. Sequencing was performed using Illumina HiSeq 2500 platform (75-base single-end mode). Base calling was performed using Illumina Casava 1.8.2 software. The resultant sequences were mapped with respect to the mouse reference genome sequence (mm10) using TopHat v2.0.13 in combination with Bowne2 ver. 2.2.3 and SAMtools ver. 0.1.19TopHat v2.0.13. One million read sequences were mapped, and the normalized gene expression level when the length of the transcript (fragment) was 1 kilobase was calculated using Cuffnorm version 2.2,1.
[0103]Next, principal component analysis was performed using omics analysis software Subio platform manufactured by Subio Inc. (ver. 1.19; Subio, Kagoshima, Japan), and pathway analysis was performed using software Ingenuity Pathway Analysis (IPA, QIAGEN Redwood City),
[0104]Compared to the ZsGreen−/CD44v9− cell population, about 600 gene groups having a fold change of ±2, p<0.05 were observed in the ZsGreen−/CD449− cell population. On the other hand, compared to the ZsGreen-/CD44v9− cell population, about 760 gene groups having a fold change of ±2, p<0.05 were observed in the ZsGreen+/CD44v9high cell population. When IPA analysis was performed on the ZsGreen+/CD44v9− and ZsGreen+/CD44v9high cell populations, a clear difference was observed between them, as shown in Table 1. in other words, compared to the ZsGreen+/CD44v9− cell population (vs ZsGreen−/CD44v9−), in the ZsGreend+/CD44v9high cell population (vs ZsGreen−/CD44v9−), activation (activation z-score was set to 2.0 or more) of pathways involved in growth/progression of tumor tissue and metastasis/differentiation/proliferation of tumor cells such as growth of tumor, migration of tumor cell lines, differentiation of tumor cell lines, proliferation of tumor cells and progression of tumor was recognized. On the other hand, in the ZsGreen+/CD44v9−cell population (vs ZsGreen−/CD44v9−), there were no tumor-related activated pathways. From the above results, it has been found that the ZsGreen+/CD44v9high cell population is a group of extremely active tumor cells.
TABLE 1 Activation Diseases or Functions Annotation p-Value Predicted z-score ZsGreen+/CD44v9− CELL POPULATION (VS ZsGreen−/CD44v9−) Organ Degeneration 0.000147 Increased 2.946 hepalic steatosis 0.000479 Increased 2.681 size of lesion 0.00114 Increased 2.452 accumulation of lipid 0.00068 Increased 2.448 Growth Failure 0.000221 Increased 2.395 signaling of cells 0.000472 Increased 2.213 morbidity or mortality 7.51E−07 Increased 2.21 organismal death 5.96E−07 Increased 2.159 concentration of phospholipid 0.000252 Increased 2.102 mitosis of breast cancer cell lines 0.000817 Increased 2 ZsGreen+/CD44v9high CELL POPULATION (VS ZsGreen−/CD44v9−) growth of tumor 8.53E−12 Increased 3.178 cell movement of endothelial 0.000084 Increased 3.054 cell lines migration of endothelial cell lines 3.75E−05 Increased 2.917 synthesis of carbohydrate 0.000114 Increased 2.737 synthesis of polysaccharide 4.17E−05 Increased 2.56 phosphorylation of protein 1.01E−06 Increased 2.551 synthesis of glycosaminoglycan 4.42E−06 Increased 2.55 Concentration of lipid 9.78E−09 Increased 2.516 Cell survival 6.17E−10 Increased 2.494 chemotaxis of cells 8.91E−06 Increased 2.432 cell viability 3.89E−09 Increased 2.423 permeability of vascular tissue 5.45E−05 Increased 2.401 chemotaxis 1.79E−06 Increased 2.399 release of eicosanoid 0.000036 Increased 2.347 metabolism of carbohydrate 4.29E−06 Increased 2.306 release of fatty acid 0.000043 Increased 2.259 synthesis of DNA 8.87E−06 Increased 2.258 migration of tumor cell lines 3.86E−13 Increased 2.249 Organ Degeneration 6.77E−06 increased 2.229 differentiation of tumor cell lines 1.83E−05 Increased 2.195 proliferation of tumor cells 1.56E−10 Increased 2.178 tyrosine phosphorylation 6.22E−07 Increased 2.17 development of abdomen 2.65E−05 Increased 2.133 metastasis of cells 2.16E−09 Increased 2.132 cell movement 3.4E−17 Increased 2.12 movement of vascular endothelial 3.46E−07 Increased 2.087 cells progression of tumor 1.32E−07 Increased 2.068 organization of cytoskeleton 5.89E−05 Increased 2.058 activation of cells 3.95E−08 Increased 2.047 migration of breast cancer cell lines 0.000169 Increased 2.021

Example

Example 3
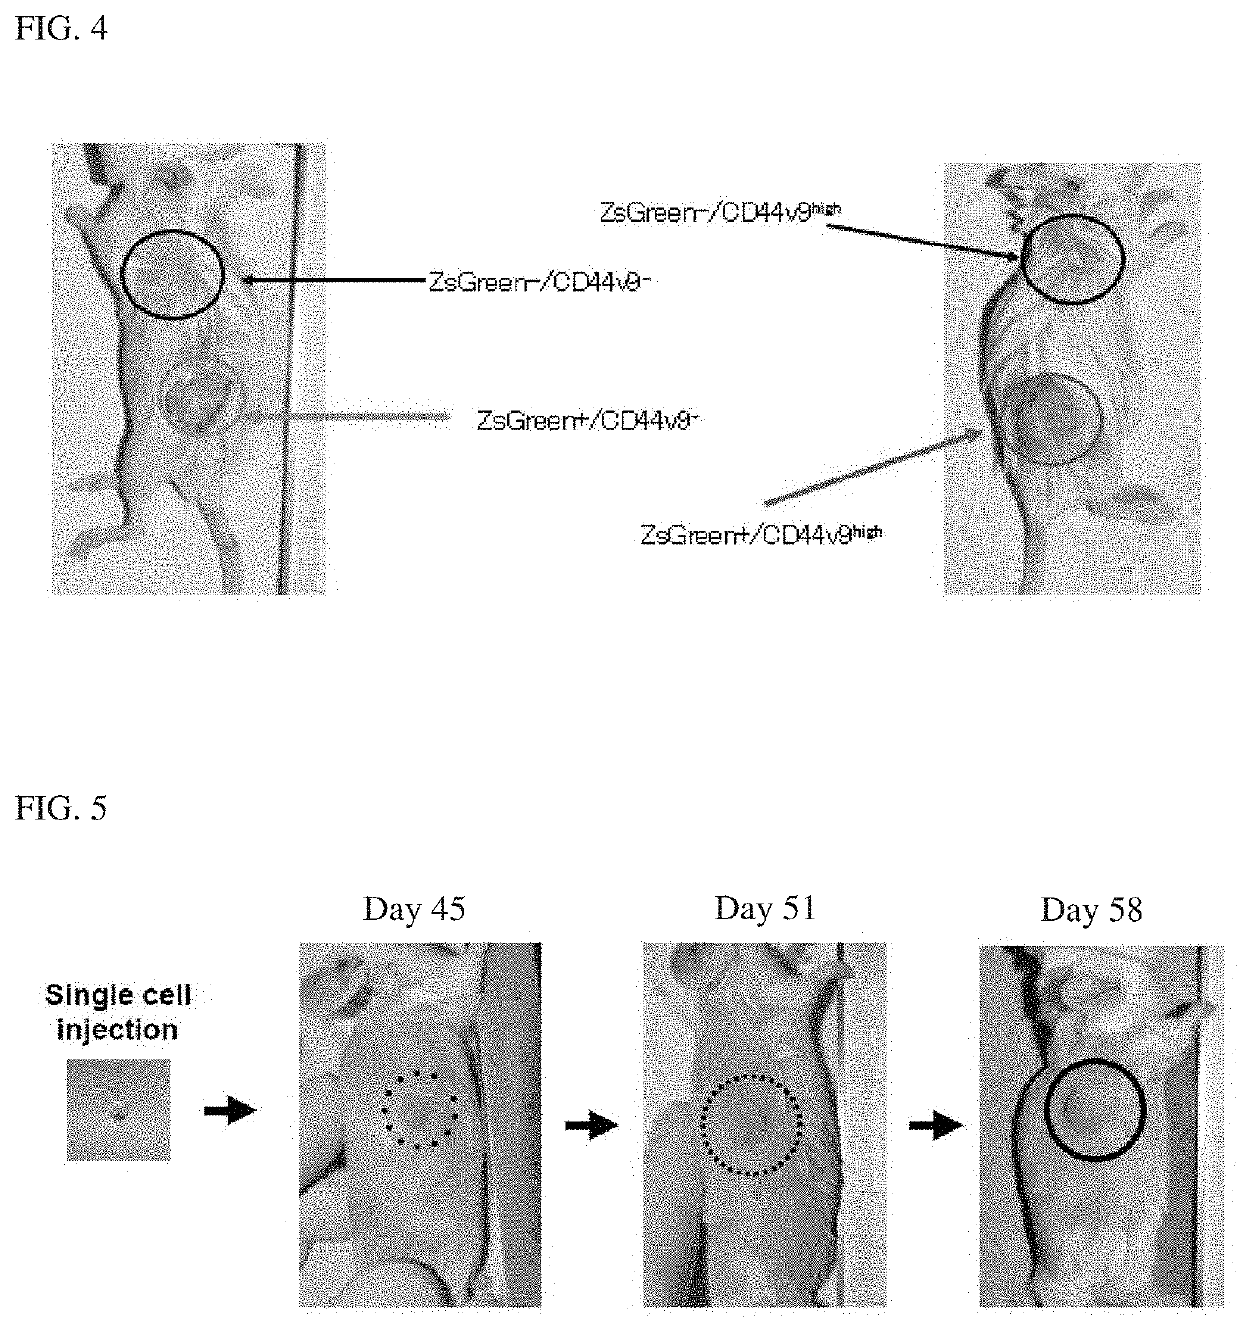
[0105]Establishment of cancer stem cell line from ZsGreen+/CD44v9high cell population and analysis of tumorigenicity thereof.
[0106]1. Establishment of Cancer Stem Cell Line
[0107]The ZsGreen+/CD44v9high cell population was cultured in a medium containing an antibiotic G418, and then mouse-derived cells were removed for cell line establishment. The established cancer stem cell line was subjected to pure culture, and the resultant cells were stocked (1×10⁶ cells/ml of CELLBANKER cell cryopreservation solution). One of the established cancer stem cell lines was designated as “Panc-1 3-4 CST 001 line” and deposited at National Institute of Technology and. Evaluation (Accession Number: NITE BP-02449).
[0108]2. Analysis of Tumorigenicity
[0109]The tumorigenicity of the established cancer stem cell lines was analyzed. For the test method, the same condition as that of “3. Analysis of tumorigenicity” described in Example 1 was adopted, except that the number of cells to be administered was one and the cell was transplanted in an embedded state in a base (DMEM: matrigel (volume ratio)=1:1, 100 μl in total).
[0110]The obtained result is shown in FIG. 5. As a result, even when only one cell from the established cancer stem cell line was transplanted, tumor formation was observed on the day 45th after transplantation, and drastic increase in tumor tissue was observed over the next two weeks.
<160> NUMBER OF SEQ ID NOS: 1
<210> SEQ ID NO: 1
<211> LENGTH: 858
<212> TYPE: DNA
<213> ORGANISM: Homo sapiens
<400> SEQENCE: 1
atggcccagt ccaagcacgg cctgaccaag gagatgacca tgaagtaccg catggagggc 60
tgcgtggatg gccacaagtt cgtgatcacc ggcgagggca tcggctaccc cttcaagggc 120
aagcaggcca tcaacctgtg cgtggtggag ggcggcccct tgcccttcgc cgaggacatc 180
ttgtccgccg ccttcaacta cggcaaccgc gtgttcaccg agtaccccca ggacatcgtc 240
gactacttca agaactcctg ccccgccggc tacacctggg accgctcctt cctgttcgag 300
gacggcgccg tgtgcatctg caacgccgac atcaccgtga gcgtggagga gaactgcatg 360
taccacgagt ccaagttcta cggcgtgaac ttccccgccg acggccccgt gatgaagaag 420
atgaccgaca actgggagcc ctcctgcgag aagatcatcc ccgtgcccaa gcagggcatc 480
ttgaagggcg acgtgagcat gtacctgctg ctgaaggacg gtggccgctt gcgctgccag 540
ttcgacaccg tgtacaaggc caagtccgtg ccccgcaaga tgcccgactg gcacttcatc 600
cagcacaagc tgacccgcga ggaccgcagc gacgccaaga accagaagtg gcacctgacc 660
gagcacgcca tcgcctccgg ctccgccttg cccccgcggt cacggccaat gtggcaactc 720
atgaaacaga tccagagcca tggcttcccg ccggaggtgg aggagcagga tgatggcacg 780
ctgcccatgt cttgtgccca ggagagcggg atggaccgtc accctgcagc ctgtgcttct 840
gctaggatca atgtgtag 858

PUM

PropertyMeasurementUnit
Electrical conductance26.0S
Therapeutic

Description & Claims & Application Information

We can also present the details of the Description, Claims and Application information to help users get a comprehensive understanding of the technical details of the patent, such as background art, summary of invention, brief description of drawings, description of embodiments, and other original content. On the other hand, users can also determine the specific scope of protection of the technology through the list of claims; as well as understand the changes in the life cycle of the technology with the presentation of the patent timeline. Login to view more.
Why Eureka
Try Eureka