

Systems and method for electrophoretic fractionation of the microbiome
a technology of electrophoretic fractionation and microbiome, which is applied in the field of systems and methods for electrophoretic fractionation of the microbiome, can solve the problems of difficult comprehensive characterization of the species present in the sample, the difficulty of deep surveying the species present at low levels in the microbiome, and the complexity of the environmental microbiome that presents formidable challenges to their characterization
- Summary
- Abstract
- Description
- Claims
- Application Information
AI Technical Summary
Benefits of technology
Problems solved by technology
Method used
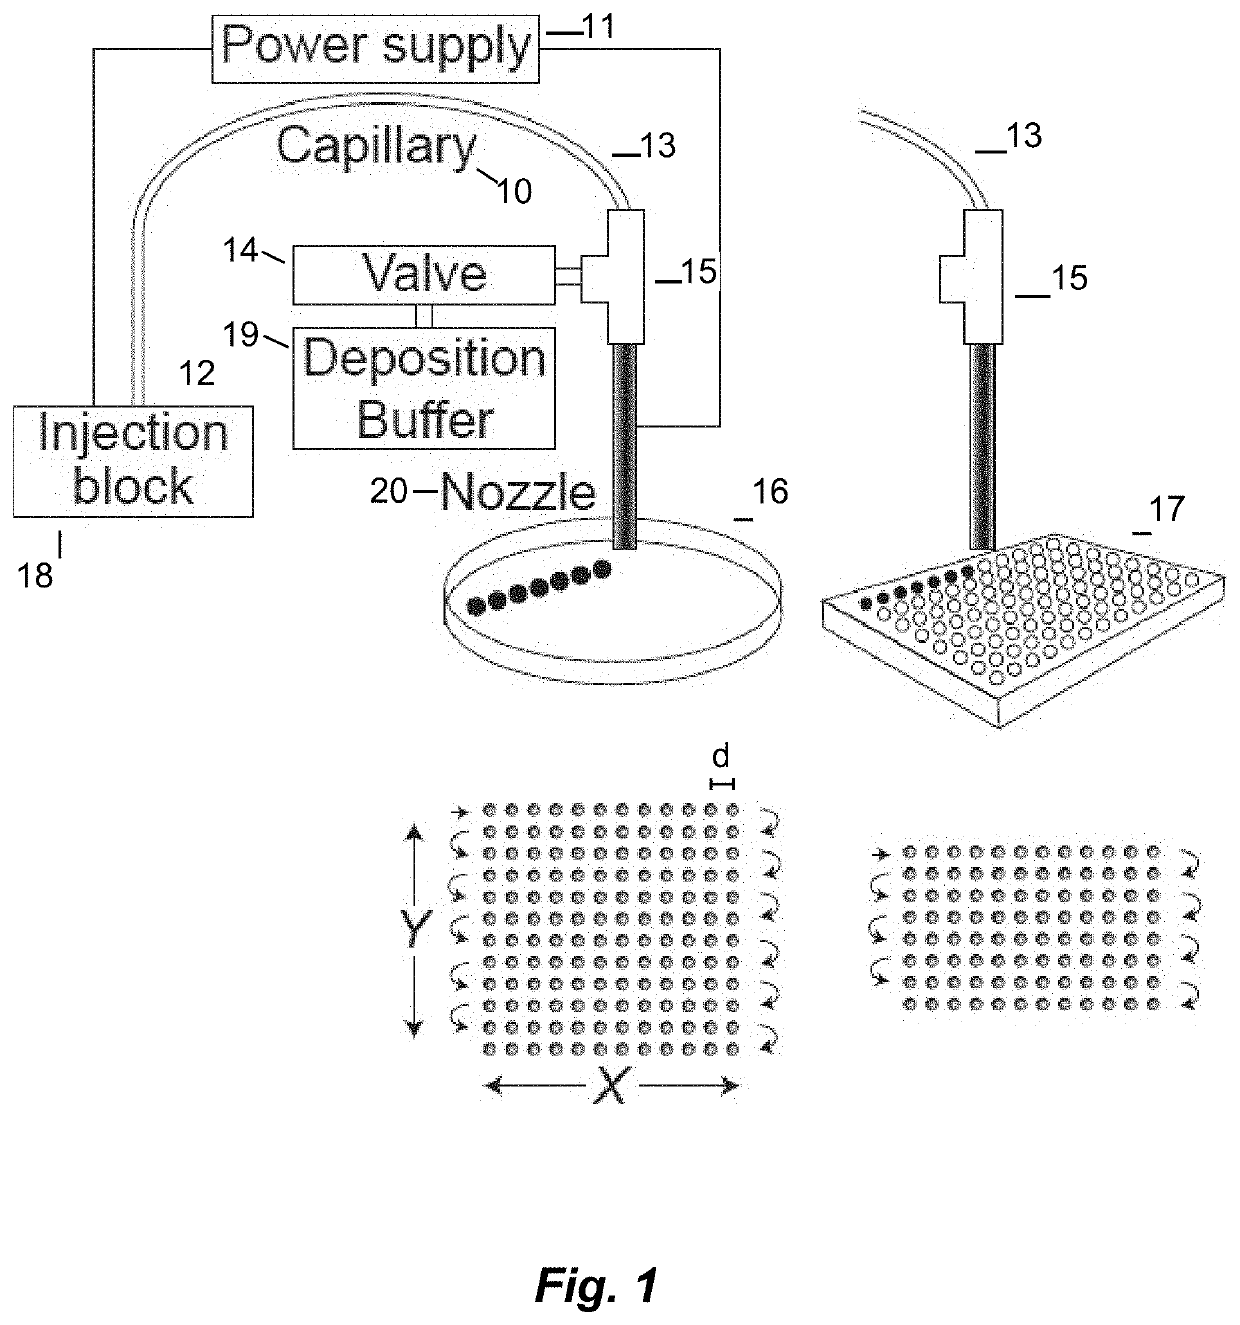
Image

Examples
example 2
r Treatment Plant Microbiome
[0139]In another example of electrophoretic fractionation and sequencing of a microbiome, a 2 L aliquot of primary effluent was collected at a wastewater treatment facility. The sampling site was post-settling and pre-chlorination. Microorganisms were isolated by centrifugation and washed three times with sterile-filtered PBS. The washed cells were suspended in PBS supplemented with glycerol (22%) for long-term storage at −80° C. Aliquots were thawed and dilute in sterile PBS prior to analysis.
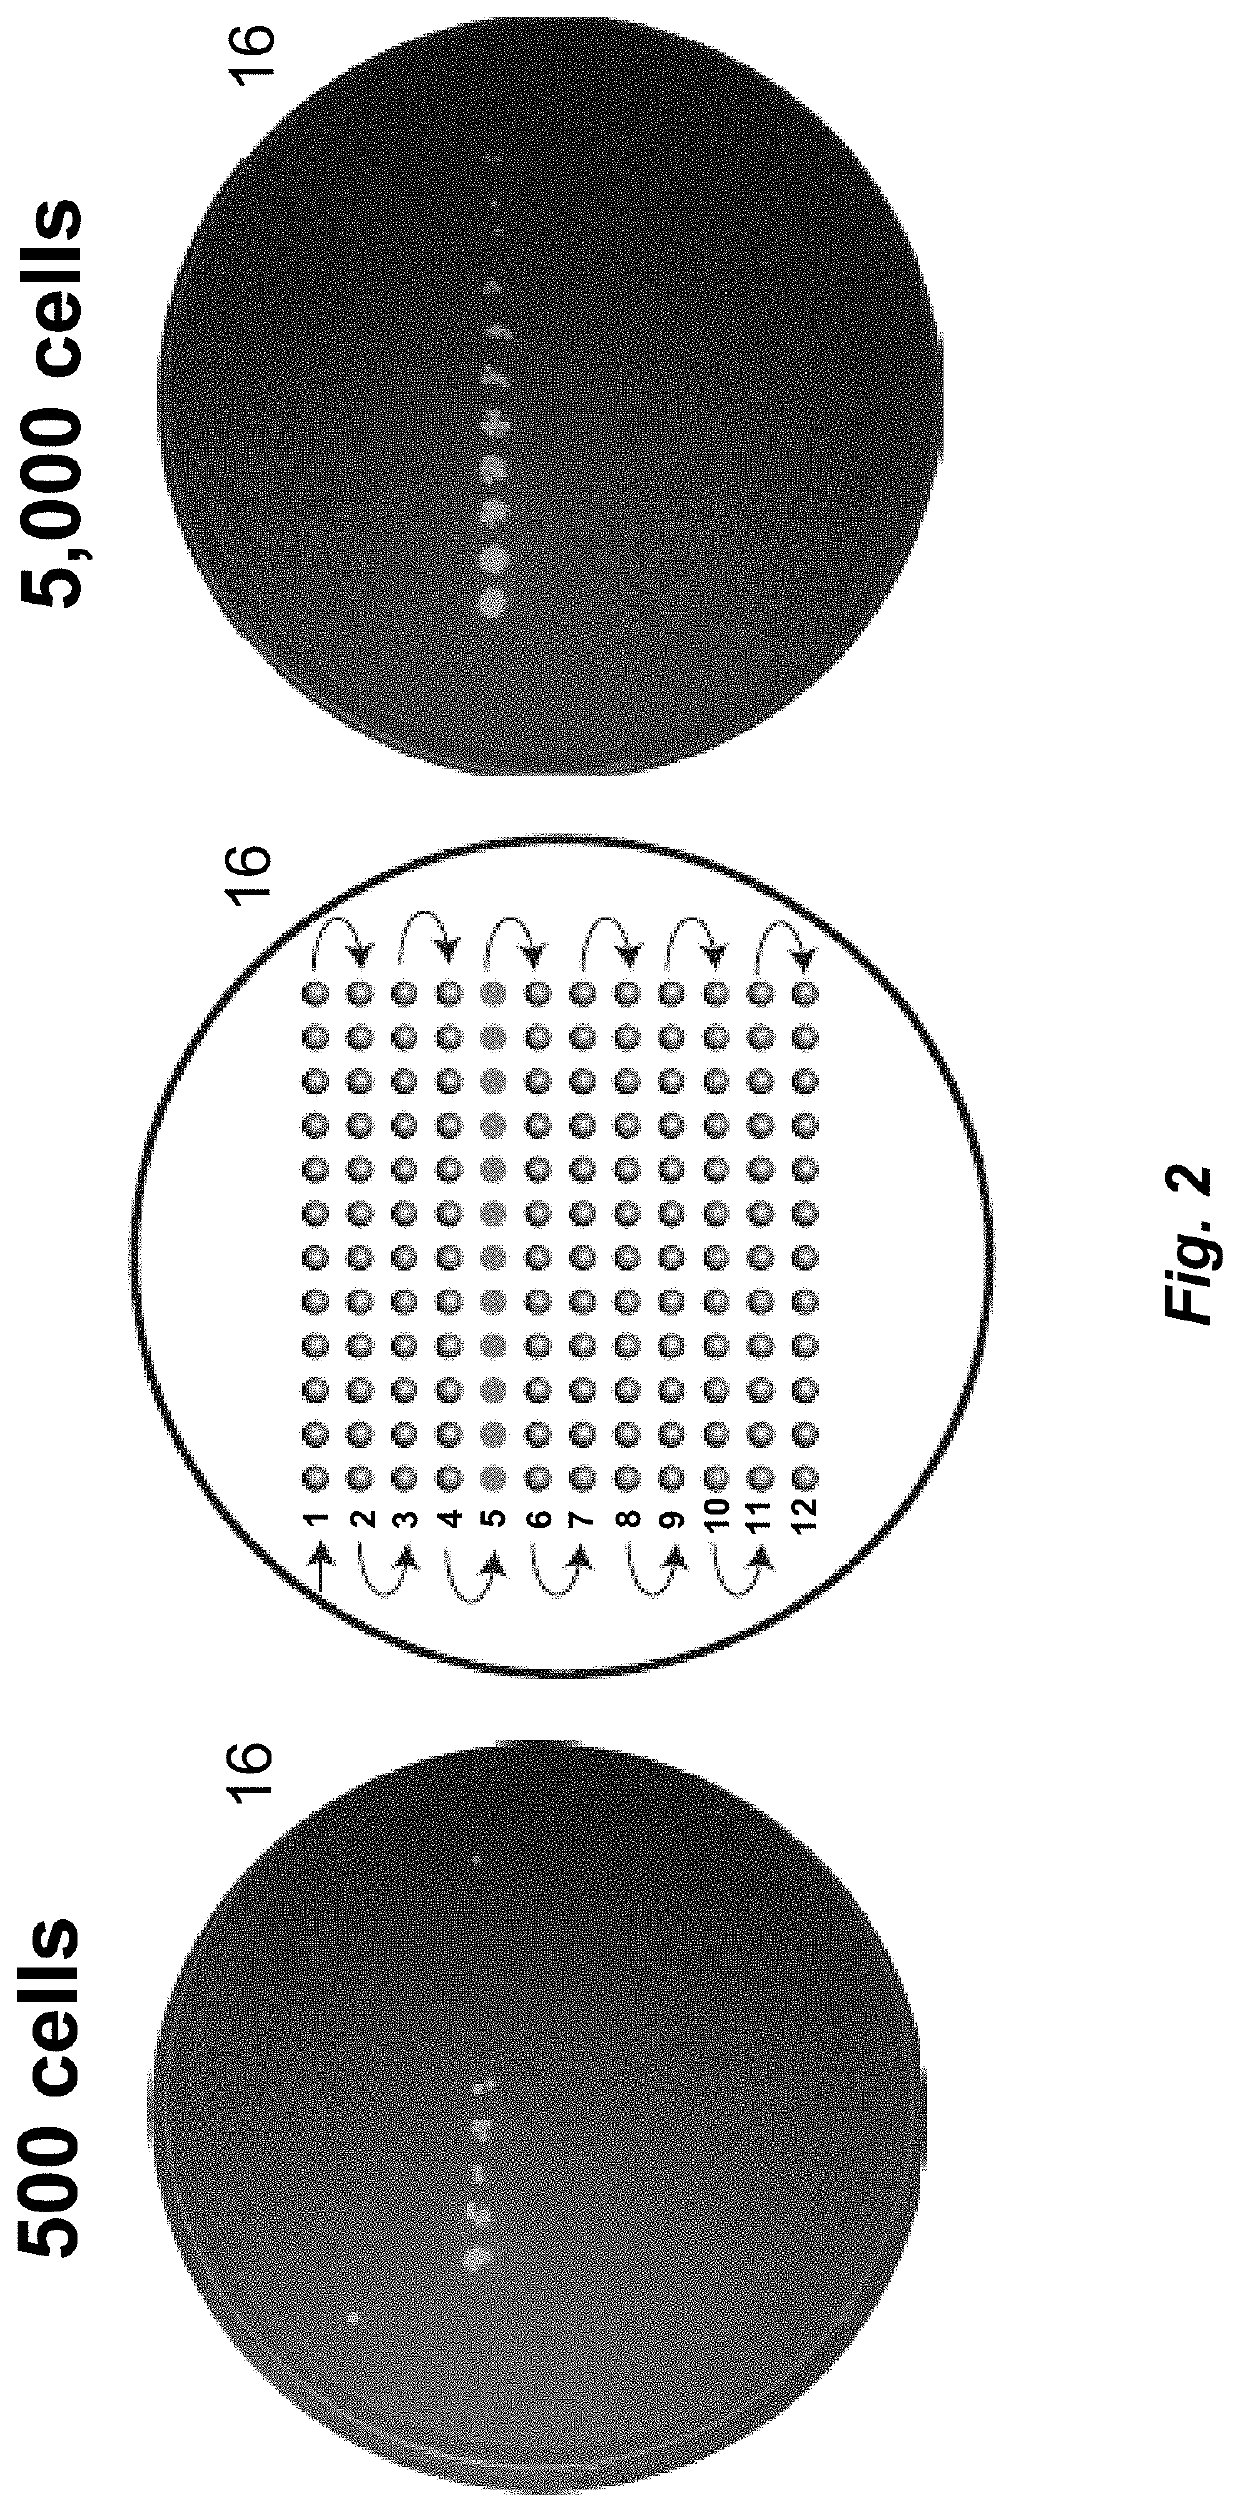
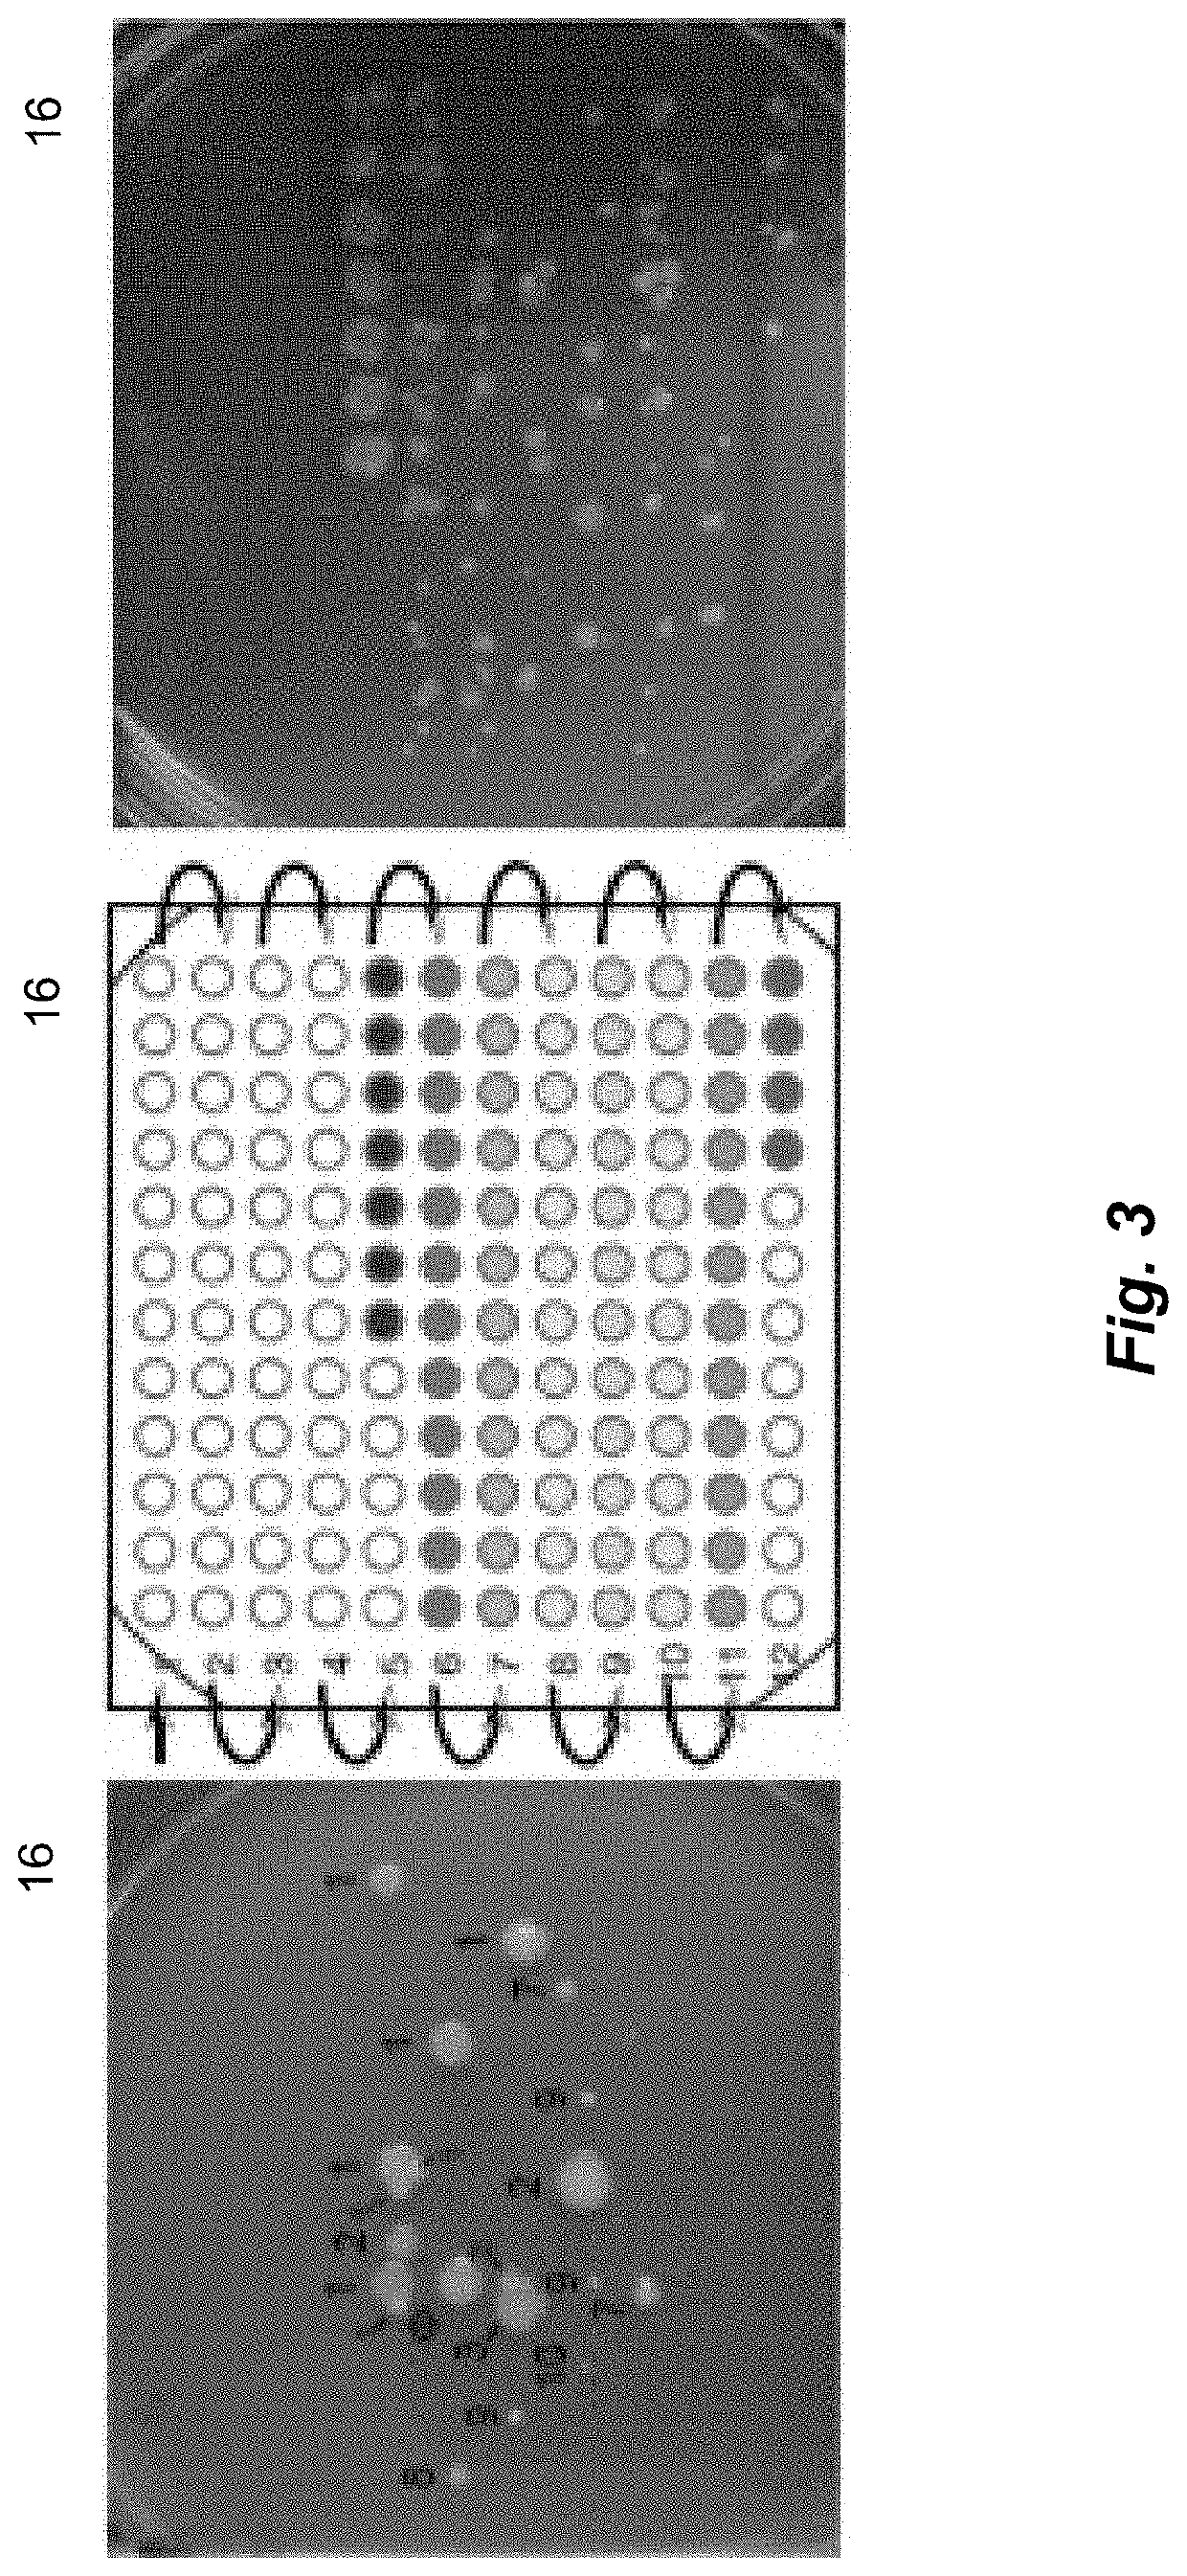
[0140]The collected sample was divided into multiple subsamples of the wastewater microbiome containing approximately 1,000 and 100,000 microbial cells; these subsamples were injected and separated. Fractionated samples were deposited onto collector plates. These collector plates included those having a cell growth medium such as agar, as well as a microtiter plate. In some instances, the fractionated sample was collected on a plate with LB agar, in triplicate (for ...
example 3
n of a Total Organism Electropherogram (TOE) for an Environmental Microbiome using Real-Time PCR
[0145]Roughly 100,000 microbial cells from the waste-water microbiome were injected into the capillary. The microbiome was separated, and fractions were deposited into 80 wells of a microtiter plate. Real-time PCR was used to quantify the number of bacteria within each well. The period between drops was increased to 15 seconds to accommodate separation window of about 20 minutes. Real-time PCR was performed by amplification across the 16S rRNA gene. Amplification was observed for all wells. The Ct values from the PCR reactions were used to estimate the number of bacteria per well. Intensity was calculated according to Equation 1:
Intensity=normalization factor*2−Ct (Eq. 1)
where the normalization factor is determined by depositing a known number of E. coli cells into wells. The plot of intensity vs time resembles a conventional electropherogram, in this case where the abundance correspond...
example 4
ration Sequencing of 16s rRNA of Microbes from the Environmental Microbiome—OTU Electropherograms and Bar-Charts
[0147]After 40 cycles of amplification using real-time PCR to generate the data of FIG. 4, the plates were sequenced. The forward and reverse reads were returned and were about 300 bp in length. Sequences were clustered into OTUs based on similarity and mapped to a microbial genome database; 228 OTUs were observed for the unfractionated sample and a total of 660 OTUs was observed for the fractionated sample. FIG. 5 presents the number of OTUs as a function of migration time (this is referred to as an OTU electropherogram) along with the TOE.
[0148]Roughly 50 OTUs were observed per well for the first seven minutes (wells 1-35). The OTU count jumped to ˜420 in coincidence with the spike in total cells observed per well for well 33. The number of OTUs decayed to ˜100 / well by the end of the run.
[0149]FIG. 6 presents color-coded bar charts where the size of each bar is proportio...
PUM
| Property | Measurement | Unit |
|---|---|---|
| Fraction | aaaaa | aaaaa |
| Diameter | aaaaa | aaaaa |
| Diameter | aaaaa | aaaaa |
Abstract
Description
Claims
Application Information