Method and Device for Determining a Measure of Causal Influence Between Components of Complex Systems

a causal influence and component technology, applied in the direction of relational databases, instruments, diagnostic recording/measuring, etc., can solve the problems of high-dimensionality data, inability or very difficult parameter optimization of non-linear time series models, and inability to calculate the number of temporal values, etc., to achieve the effect of reducing dimension representation, reducing dimensionality, and increasing size or complexity

Pending Publication Date: 2022-02-24
WISMÜLLER AXEL W E
View PDF3 Cites 3 Cited by
  • Summary
  • Abstract
  • Description
  • Claims
  • Application Information

AI Technical Summary

Benefits of technology

[0069]The disclosed lsXGC method enables linear or nonlinear causality analysis or relevance analysis between elements of a multivariate high dimensionality dataset to be performed by reducing dimensionality and by augmentin

Problems solved by technology

However, applying Granger causality or some other causality measure to evaluate causality between pairs of time-series of high-dimensional multivariate time-series (an ensemble of time-series X∈N×T where N≥3 is the number of time-series and T the number of temporal values) is problematical.
High-dimensionality data renders many standard statistical techniques invalid or computationally expensive (the “curse of dimensionality”).
The relatively low number T makes parameter optimization of non-linear time series models impossible or very challenging.
A fundamental problem of fMRI data analysis concerns the accurate analysis of the effective functional connectivity of voxels at fine-grained spatial and temporal resolution scales, based on the acquisition capabilities of state-of-the-art neuro-imaging techniques.
But because of its complexity, a satisfactory understanding of neural mechanisms is likely to require identification of directed functional connectivity.
Although various non-linear extensions of GC have been proposed in the literature, such methods cannot be applied to large-scale effective connectivity analysis at a whole-brain neuroimaging voxel resolution scale.
The reasons for such restrictions were previously discussed above: besides computational expense, the extendibility to multivariate analysis of high-dimensional dynamic systems with a low

Method used


Image

  • Method and Device for Determining a Measure of Causal Influence Between Components of Complex Systems
  • Method and Device for Determining a Measure of Causal Influence Between Components of Complex Systems
  • Method and Device for Determining a Measure of Causal Influence Between Components of Complex Systems

Examples


Embodiment Construction

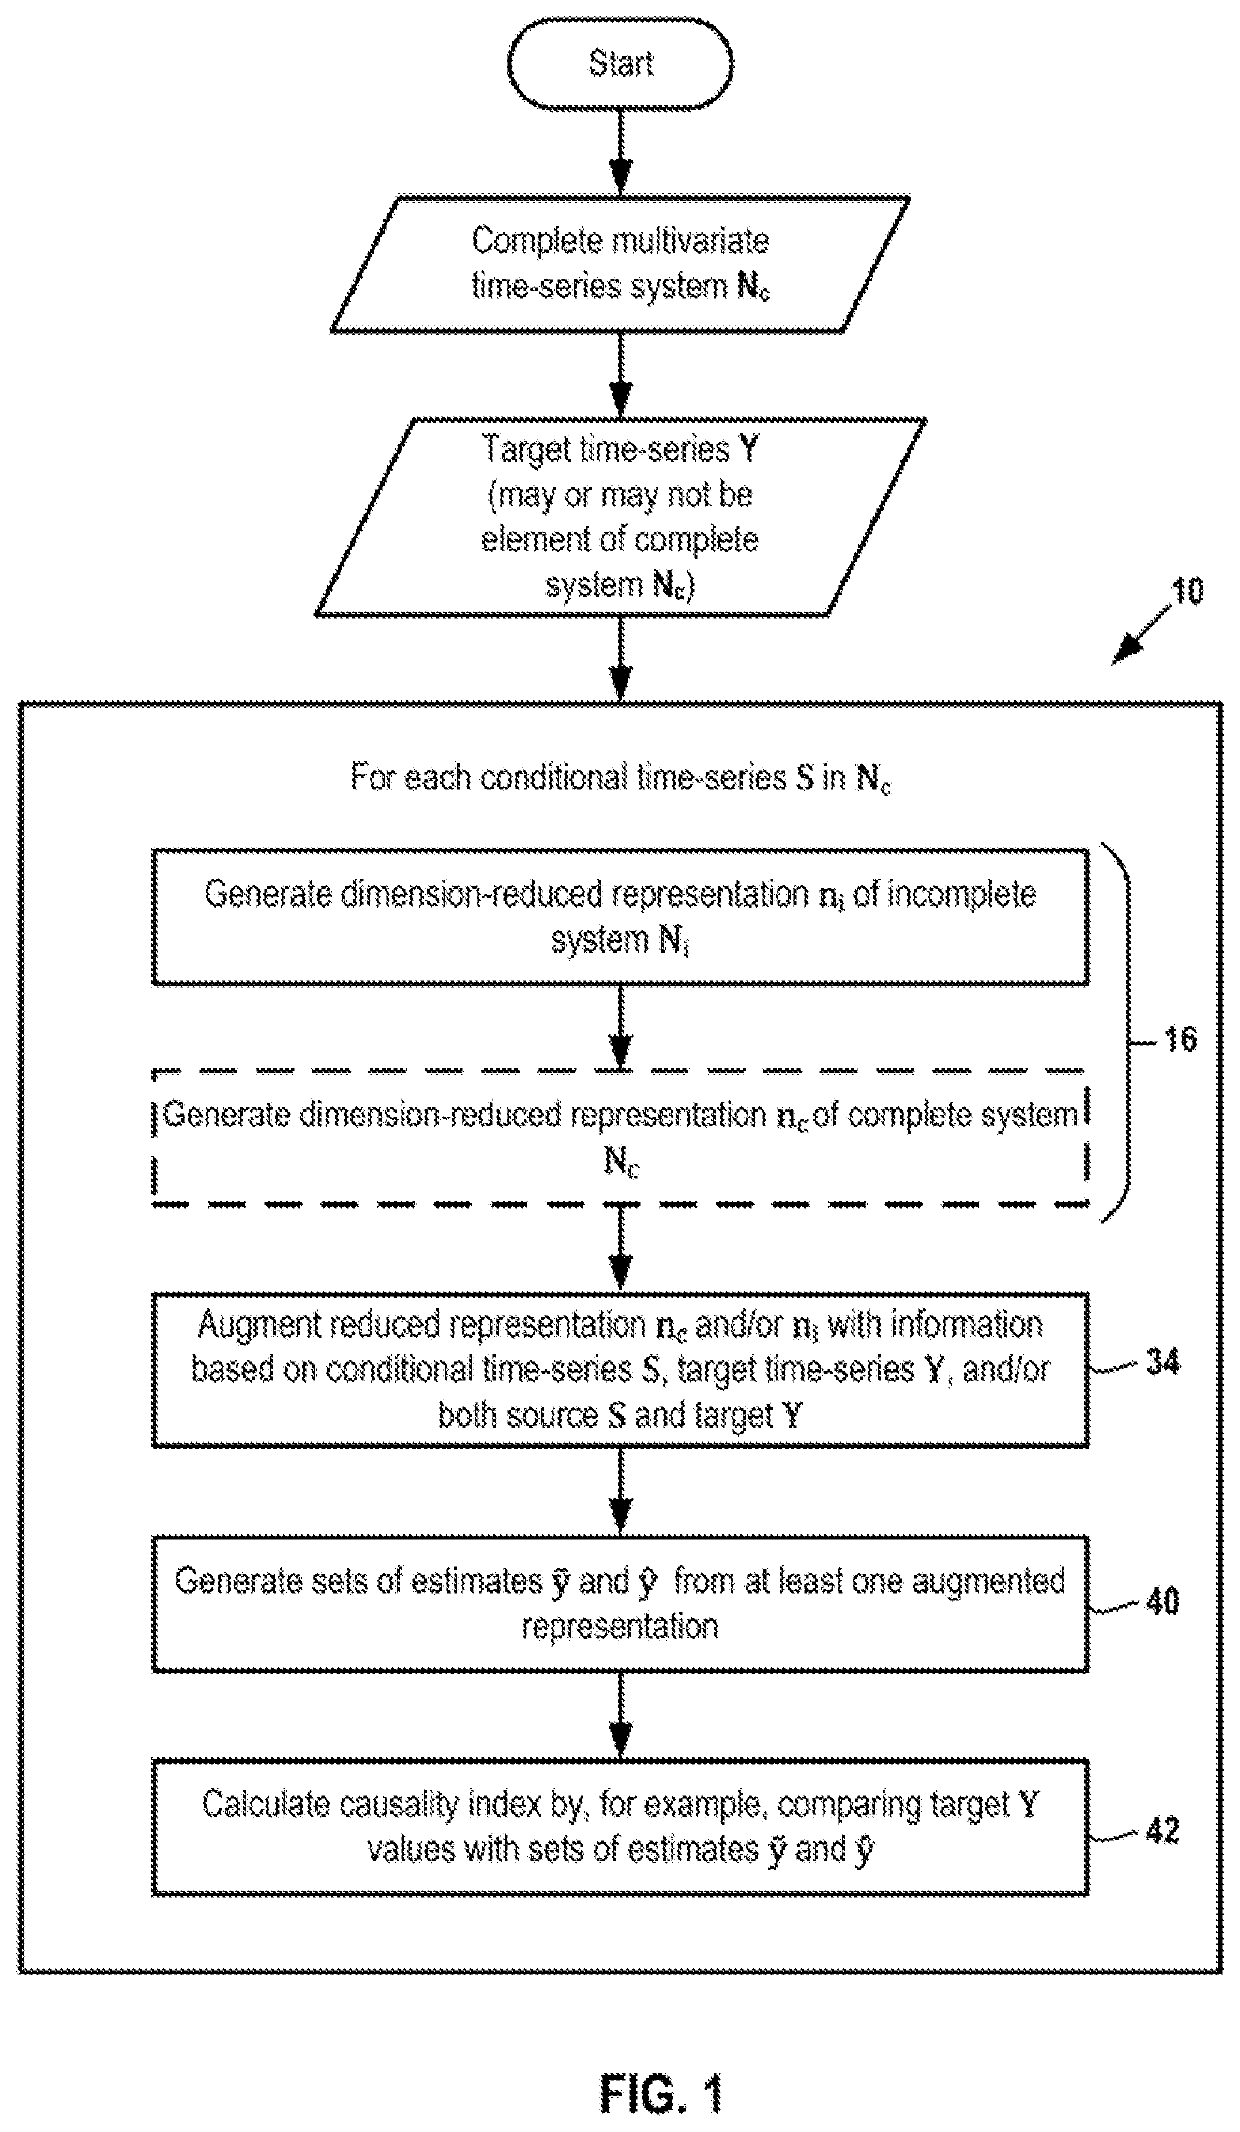
[0083]FIG. 1 illustrates the main steps of the lsXGC method 10 as applied to a high-dimension multivariate time-series dataset 12. The dataset defines a complete multivariate time-series system Nc∈N×T having simultaneously measured values. The complete system Nc includes as a subset one or more time-series defining a conditional source time-series or source S. It is desired to evaluate the causal influence of each source S on a dataset 14 defining a target time-series or target Y having values simultaneously measured with those of the complete series Nc. A source S may include more than one row of the N rows of Nc. The target Y may or may not be an element or subset of the complete system Nc.

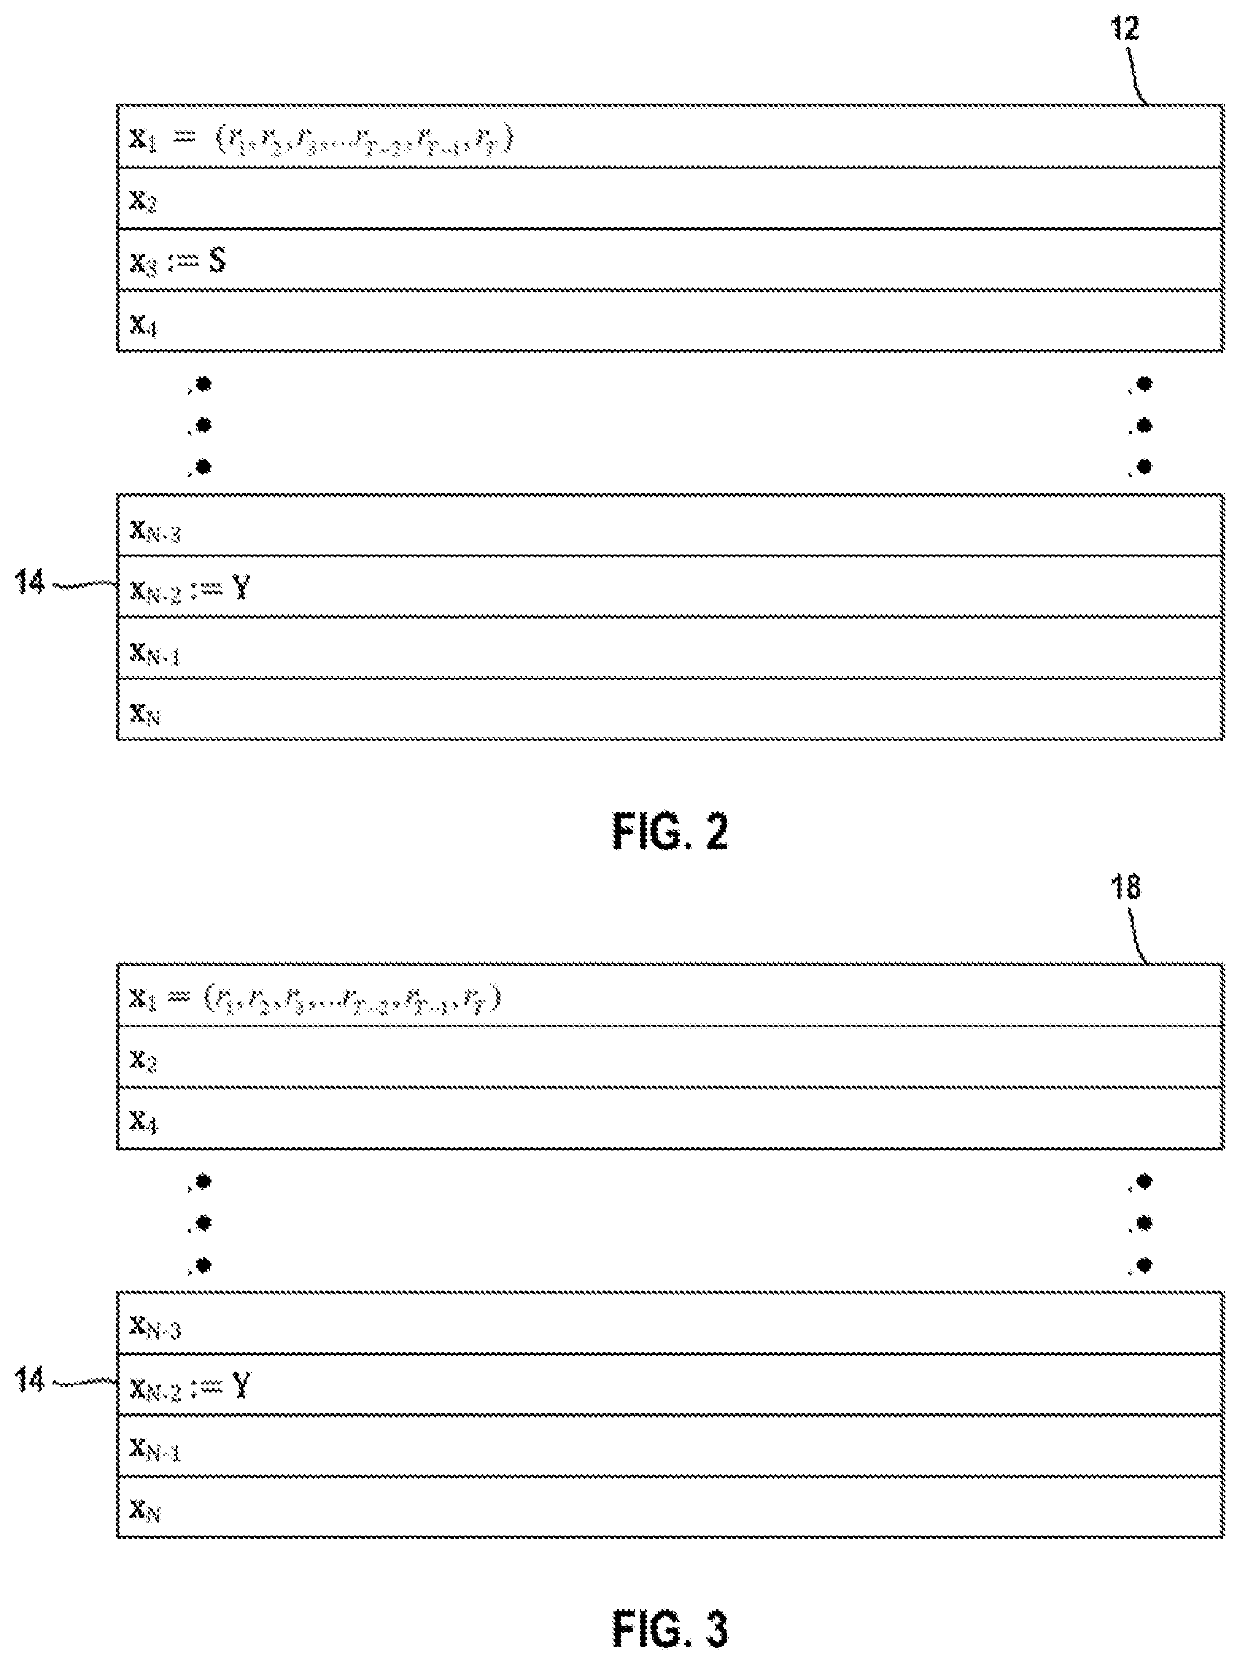
[0084]FIG. 2 illustrates the dataset 12 defining the complete system Nc that includes N time-series x1, x2, x3, . . . , xN-3, xN-2, xN-1, and xN. Each time-series is a series of T data points indexed or stored in time order. FIG. 2 illustrates the members of the time-series x1=(r1, r2, r3, . . ....


PUM


Abstract

Disclosed is a computer-implemented method for determining a measure of the causal interdependence of a source dataset S and a target dataset Y in the simultaneous presence of a non-empty confounding dataset B. The method includes a dimensional modification step to reduce the complexity of the data and an augmentation step to add information to the dimensionally modified data without a significant increase in size or complexity of the data. The augmented dimensionally modified data is used to calculate a measure of the causality or relatedness between the source dataset S and the target dataset Y. The method enables linear or nonlinear causality analysis of high-dimension multivariate time-series or features datasets, such as time-series datasets generated by functional MRI full-brain scans.

Description

RELATED APPLICATION[0001]This application claims priority to and the benefit of the filing date of my pending US provisional patent application with appendices filed Mar. 7, 2019 at Ser. No. 62 / 814,953 titled “Method and Device for Determining a Measure of Causal Influence Between Components of Complex Systems” and having Attorney Docket No. 1-2604-P, incorporated by reference as if fully set forth herein.FIELD OF THE DISCLOSURE[0002]This disclosure relates to methods and related devices for determining relationships between components of high-dimensional multivariate systems, and in particular, high-dimensional multivariate systems that are underdetermined.BACKGROUND OF THE DISCLOSURE[0003]High-dimensional multivariate systems include datasets D that can be arranged as having N rows of data, each row having T columns of data values, that is, D∈N×T, where N≥3. A multivariate dataset D may be a time-series dataset or may be a features dataset. A time-series dataset has columns of sim...

Claims


Application Information

Patent Timeline
IPC IPC(8): G06F16/28G06F16/2455G06F16/22G06F17/18
CPCG06F16/288G06F17/18G06F16/2264G06F16/24558A61B5/055A61B5/7267A61B5/7203A61B5/318A61B5/369G06F2218/12G06F18/213G06F18/23G06F18/2135
Inventor WISMÜLLER, AXEL W. E.
Owner WISMÜLLER AXEL W E
Why Eureka
Try Eureka