Condition assessment of nonlinear processes

a nonlinear process and condition assessment technology, applied in the field of condition assessment of nonlinear processes, can solve the problems of requiring a relatively large amount of data and computing power, unable to detect differences in brain wave activity between conventional methods, and difficult or even impossible comparison of conditions or states

Inactive Publication Date: 2002-11-19
LOCKHEED MARTIN ENERGY SYST INC
View PDF13 Cites 245 Cited by
  • Summary
  • Abstract
  • Description
  • Claims
  • Application Information

AI Technical Summary

Problems solved by technology

Inherent nonlinearity and high levels of noise in systems such as those described by example above make condition or state comparisons extremely difficult or even impossible through the use of linear or traditional nonlinear analyses.
For example, conventional methods cannot detect differences in brain wave activity between baseline, pre-seizure, seizure, or postseizure states.
Conventional methods, in those instances where they can be of use, however, require a relatively large amount of data and a relatively large amount of computing power.
This makes real-time monitoring difficult or impossible simply because of the cost or availability of the data acquisition, storage, and manipulation means.
Even existing nonlinear methods of monitoring process data cannot always detect differences on the scale required for a given process.
In some cases, this is simply because the method is insufficiently sensitive, or the measurements of the changes in state or condition are not robust enough to be reliable.
In other cases, the methods require large amounts of storage and computing capability that are not available as a practical matter, or at all.

Method used


Image

  • Condition assessment of nonlinear processes
  • Condition assessment of nonlinear processes
  • Condition assessment of nonlinear processes

Examples


example 2

Application to Bondarenko Model

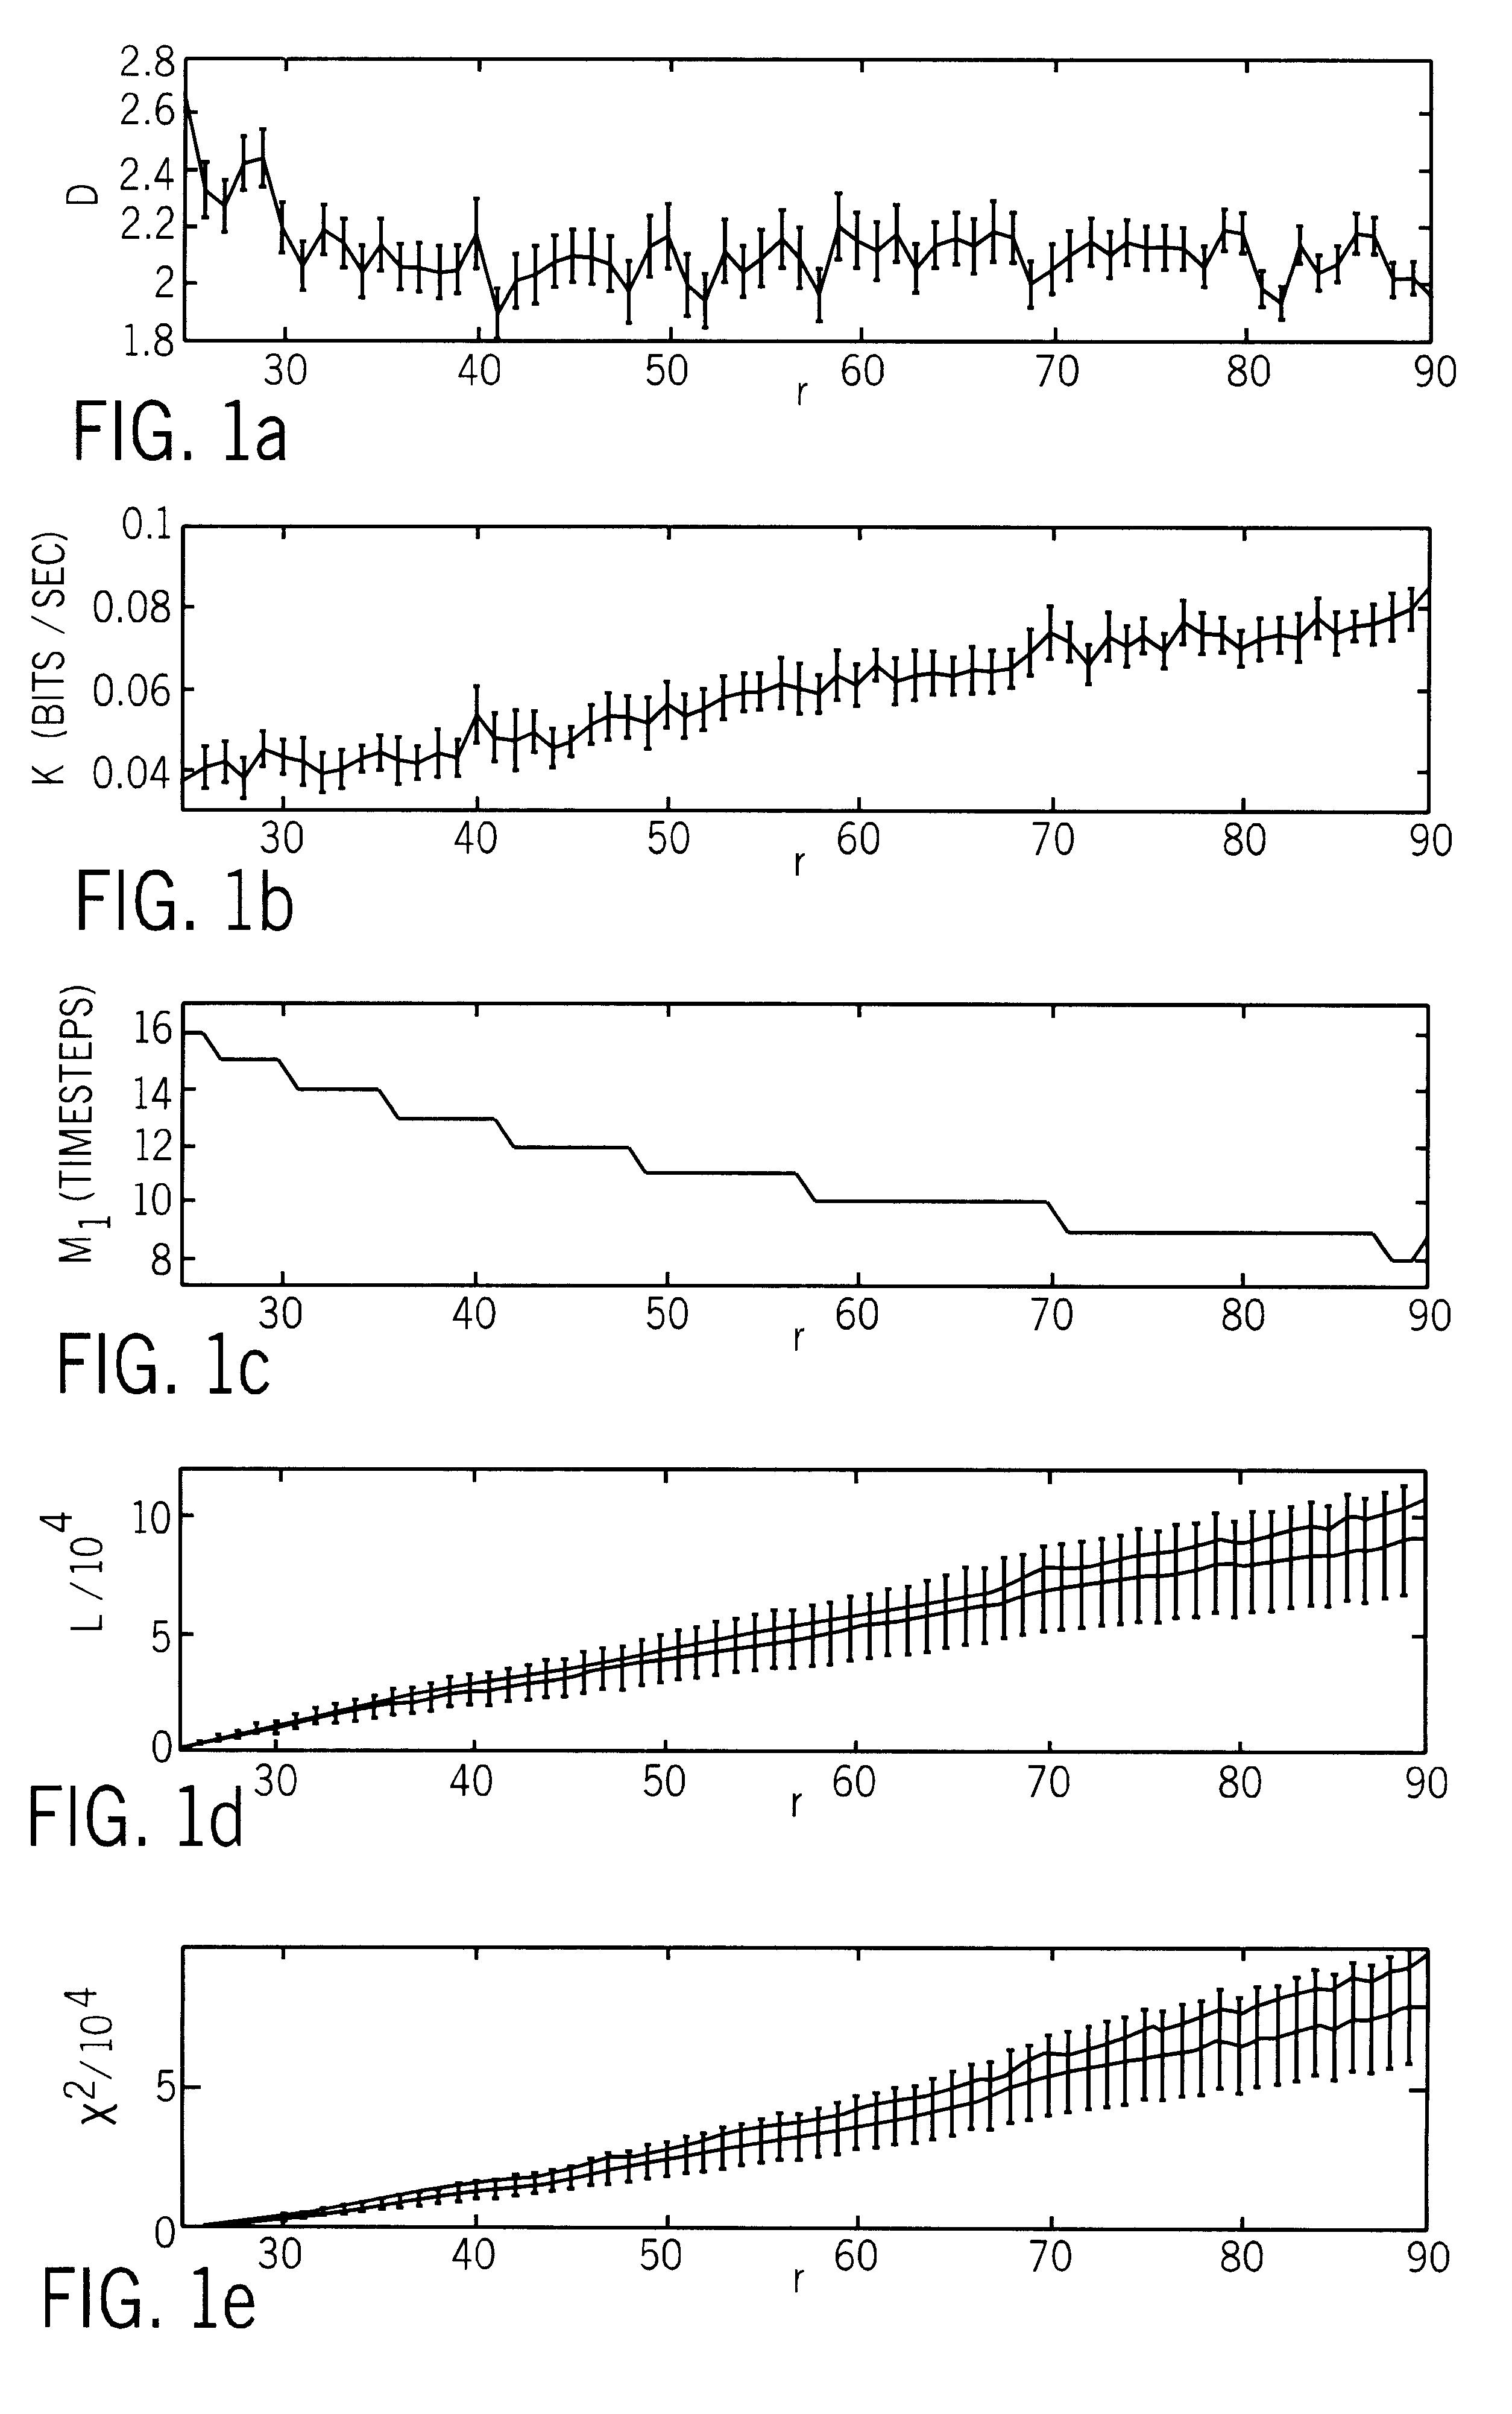
The phase-space measures were also assessed by testing them on the Bondarenko neuron model [31], which is a coupled set of time-delayed ordinary differential equations: ##EQU1##

The signal from the i-th neuron is u.sub.i (t). The indices, i and j, run from 1 to M=10 for ten neurons. The matrix, a.sub.ij, is a set of coupling coefficients having uniformly random values, -2.ltoreq.a.sub.ij.ltoreq.2. The time delay is a constant, .tau..sub.j =10. The function, f(x)=c tanh(x), simulates nonlinear neural response to signals from neighboring neurons. Dissimilarity was measured within a region where the Bondarenko system is known to behave chaotically: 5.ltoreq.c.ltoreq.16. The model was integrated using a standard fourth-order Runge-Kutta method with a timestep of h=0.3. A time of 4.times.10.sup.8 h was allowed for the solution to achieve stationarity after initiating the integration with random impulses, u.sub.j (t=0)=.rho..sub.j with .rho..sub.j having unif...

example 3

Application to EEG Data

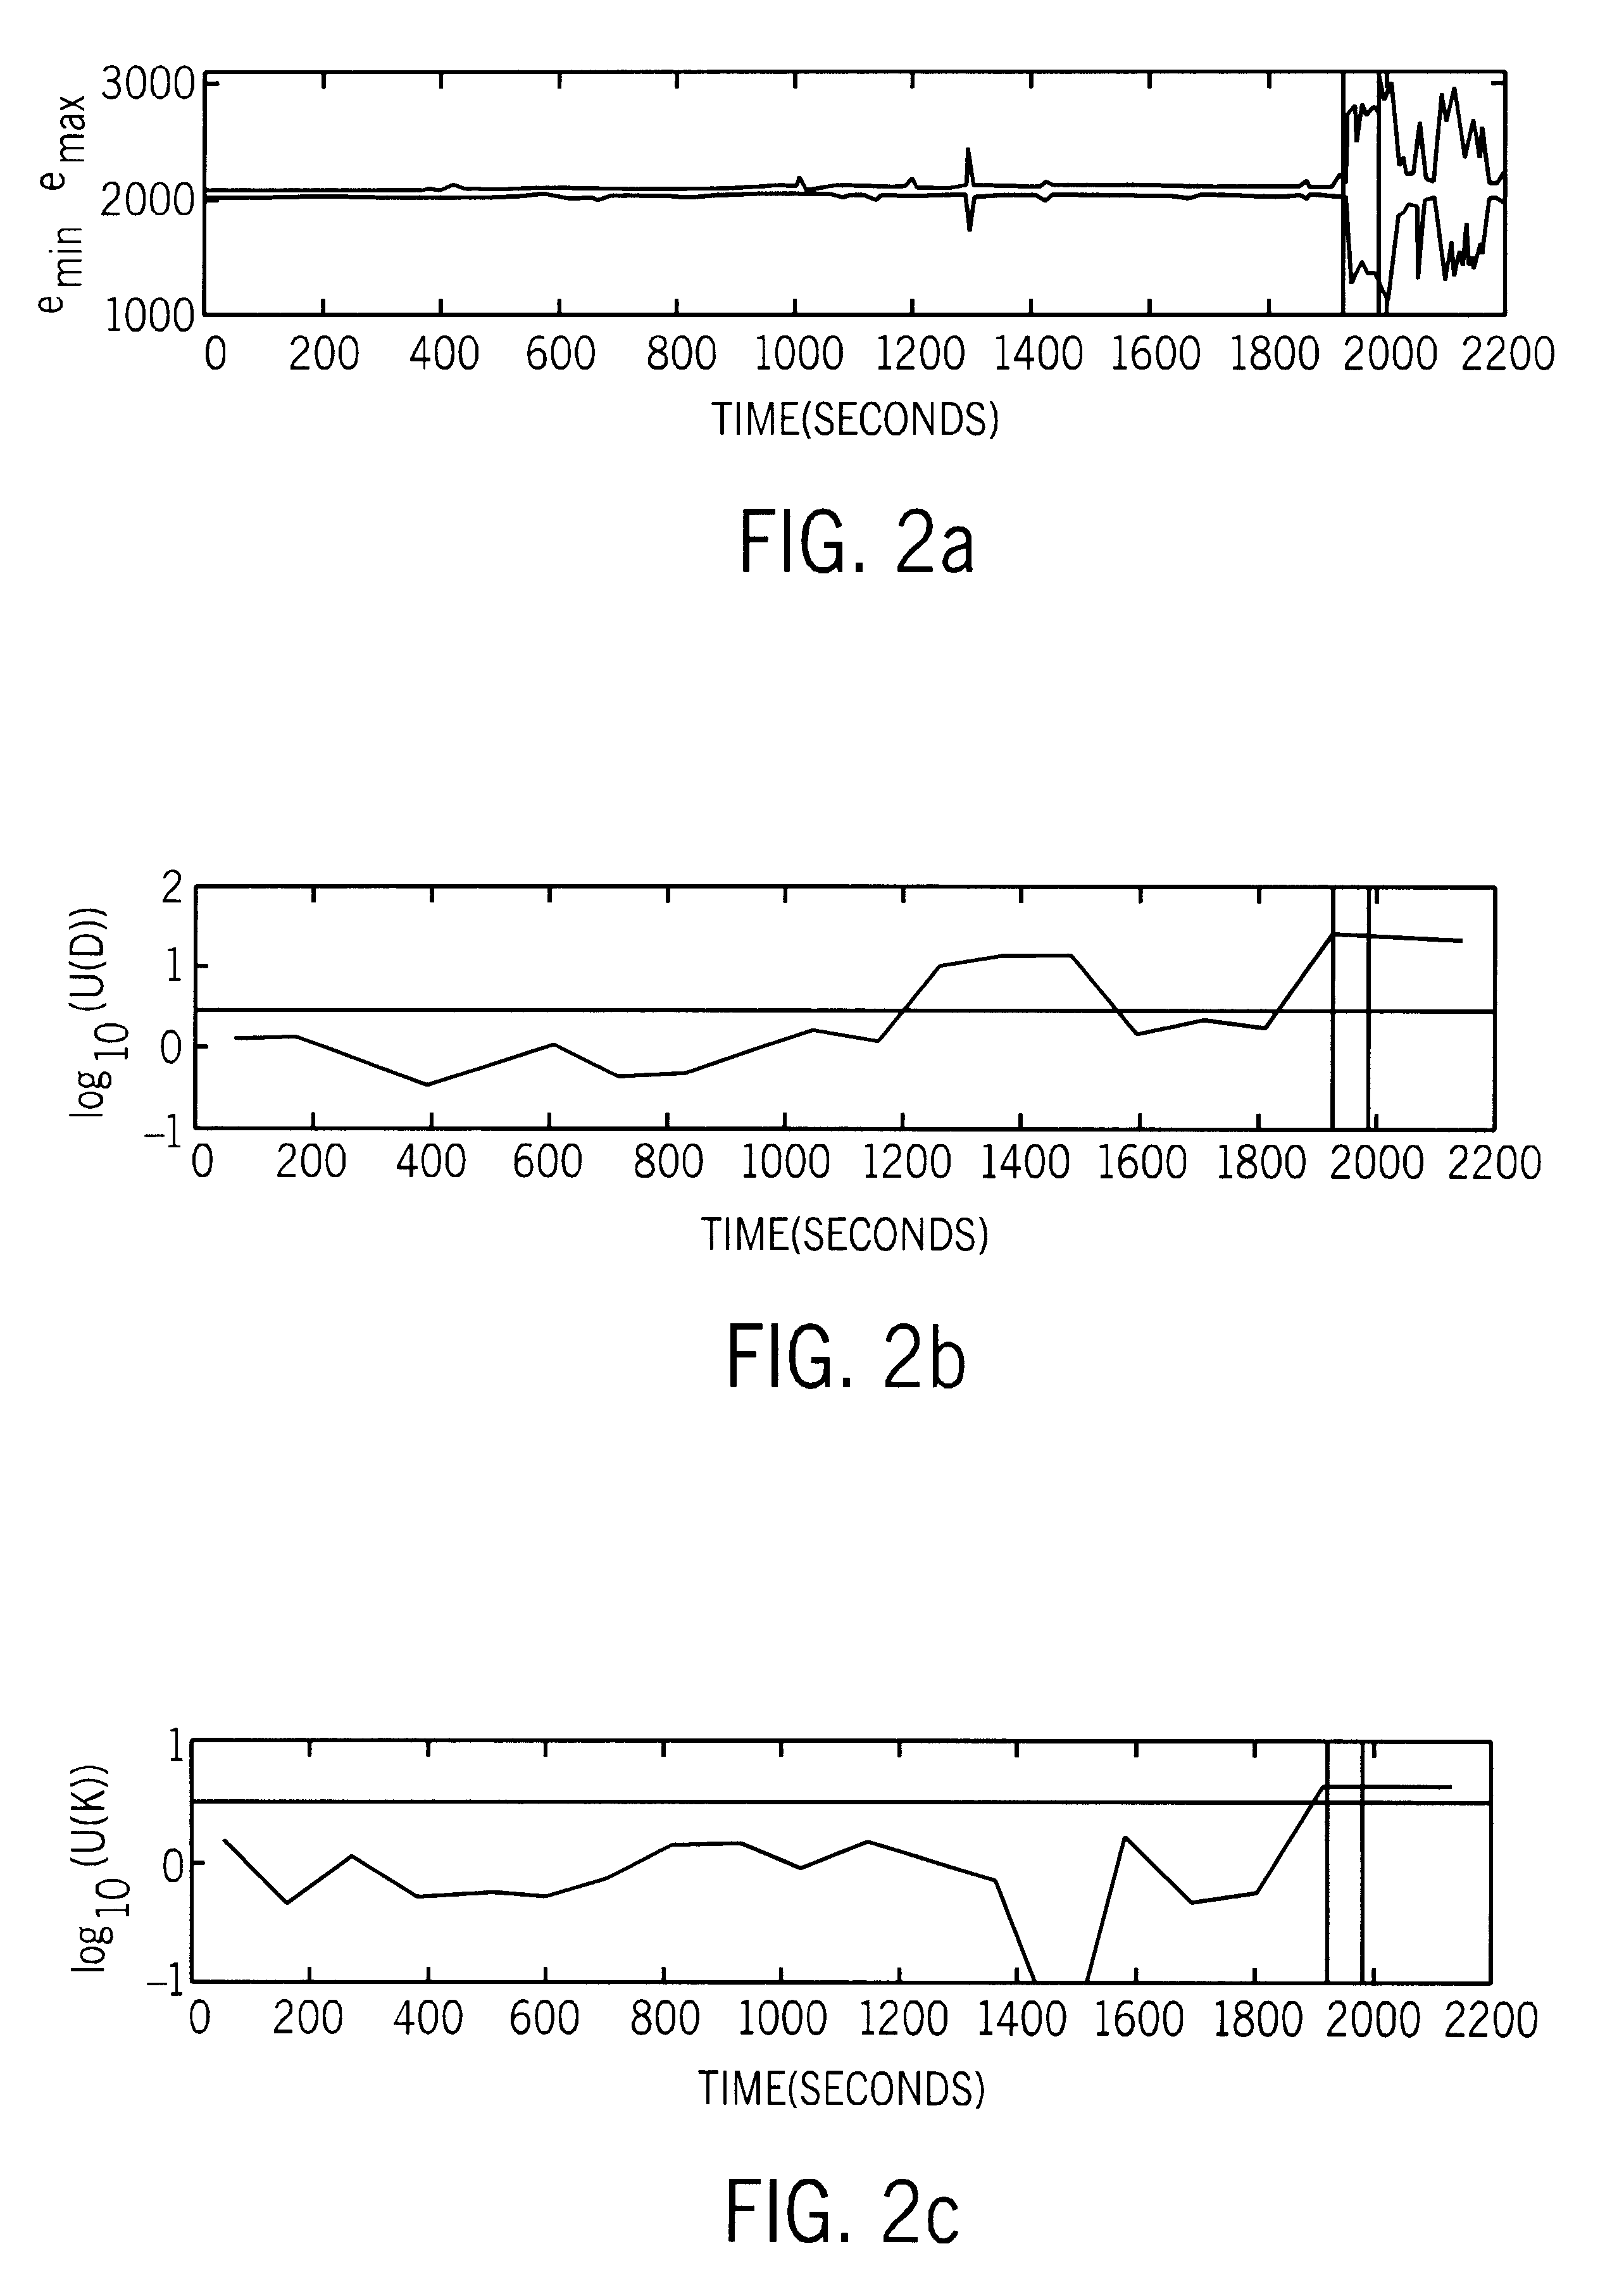
The invention has been demonstrated using sixteen-channel, analog scalp data in the bipolar montage from archival VHS tapes [27]. Only one channel (channel 13, closest to the patient's right eye) is used. This data is digitized at a sampling rate of 512 Hz with 12-bit precision, corresponding to integers between -2,048 and +2,047. Table 1 summarizes these nine datasets with monitoring periods of 1,380-3,115 seconds, and with the clinical seizure beginning at times that range over 966-2,775 seconds.

The invention has also been applied to digital EEG scalp data from other clinical sites in the 10 / 20 International System of electrode placement, sampled at 200 Hz. These data have 10-11 bits of precision, with signal amplitudes between 0-3,000 depending on the dataset. These data have 23-32 channels with monitoring periods of 2,217-20,000 seconds. The clinical seizures begin at times that range over 1,930-15,750 seconds. Only one clinically designated channel was ex...


PUM


Abstract

There is presented a reliable technique for measuring condition change in nonlinear data such as brain waves. The nonlinear data is filtered and discretized into windowed data sets. The system dynamics within each data set is represented by a sequence of connected phase-space points, and for each data set a distribution function is derived. New metrics are introduced that evaluate the distance between distribution functions. The metrics are properly renormalized to provide robust and sensitive relative measures of condition change. As an example, these measures can be used on EEG data, to provide timely discrimination between normal, preseizure, seizure, and post-seizure states in epileptic patients. Apparatus utilizing hardware or software to perform the method and provide an indicative output is also disclosed.

Description

The current invention relates to methods and apparatus for analyzing nonlinear data and particularly time-series nonlinear data derived from any of a variety of nonlinear processes or processes having a nonlinear component, and more particularly relates to methods and apparatus for detecting and measuring changes in states of nonlinear systems, conditions of nonlinear processes, and structure of nonlinear data.Nonlinear processes, from which nonlinear data can be derived, are ubiquitous. The number and kind of such processes cannot be fully listed, but examples include: brain waves; heart waves;electrical transients in power systems; fluid (air or water) flow over surfaces such as those of automobiles, airplanes, or submarines; weather and climate dynamics; machine tool-part interaction (e.g., tool chatter); nuclear reactor instabilities; fusion plasma instabilities; earthquakes; turbulent flow in conduits; fatigue and stress crack growth; and planetary or satellite motion. Applicat...

Claims


Application Information

Patent Timeline
Patent Type & Authority Patents(United States)
IPC IPC(8): A61B5/0476G06K9/00
CPCG06K9/00536A61B5/0476A61B5/4094A61B5/369G06F2218/12A61B5/372
Inventor HIVELY, LEE M.GAILEY, PAUL C.PROTOPOPESCU, VLADIMIR A.
Owner LOCKHEED MARTIN ENERGY SYST INC
Why Eureka
Try Eureka