Method for calibrating spectrophotometric apparatus

a spectrophotometric and apparatus technology, applied in the direction of instruments, liquid/fluent solid measurements, chemical methods analysis, etc., can solve the problems of unreliable method, reagentless spectrophotometric apparatus calibration used to measure the concentration of analytes, and compromise specimen integrity, etc., to achieve simple and reliable results

Inactive Publication Date: 2004-03-23
TYCO HEALTHCARE GRP LP
View PDF5 Cites 38 Cited by
  • Summary
  • Abstract
  • Description
  • Claims
  • Application Information

AI Technical Summary

Benefits of technology

The present invention provides a method to provide a simple reliable method of using primary calibration algorithms in a second apparatus that do not require representative samples for which the apparatus was designed. Rather, the standard samples used to calibrate a second apparatus can be any stable samples that produce a range of absorbances at all relevant wavelengths.

Problems solved by technology

The presence of such interferents affects the ability to perform tests on the serum or plasma and as such can be said to compromise specimen integrity.
Visual inspection can be used to determine the presence of interferents in serum and plasma but such a method relies on the experience and knowledge of the observer and is therefore unreliable.
Unlike many blood analytical apparatus, calibration of reagentless spectrophotometric apparatus used to measure the concentration of analytes or interferents in a serum or plasma sample is a cumbersome time intensive exercise.
Each apparatus used for the purposes of determining the concentration of interferents must be calibrated according to procedures known in the art, for example, the process described herein, in the section titled "Primary Calibration," and over the lifetime of an apparatus can amount to a considerable amount of time and cost.
Furthermore, in settings where a large number of apparatus is needed to perform multiple sample measurements (such as blood banks for example) the time required for calibration can become a real burden on the efficiency of the of the quality control process.
A limitation of this method is that the number of samples required must be at least one more than the number of terms used in the primary calibration equation, because a mathematical system of "simultaneous equations" is used to generate a new constant for each term in the primary calibration algorithm.

Method used


Image

  • Method for calibrating spectrophotometric apparatus
  • Method for calibrating spectrophotometric apparatus
  • Method for calibrating spectrophotometric apparatus

Examples


example 1

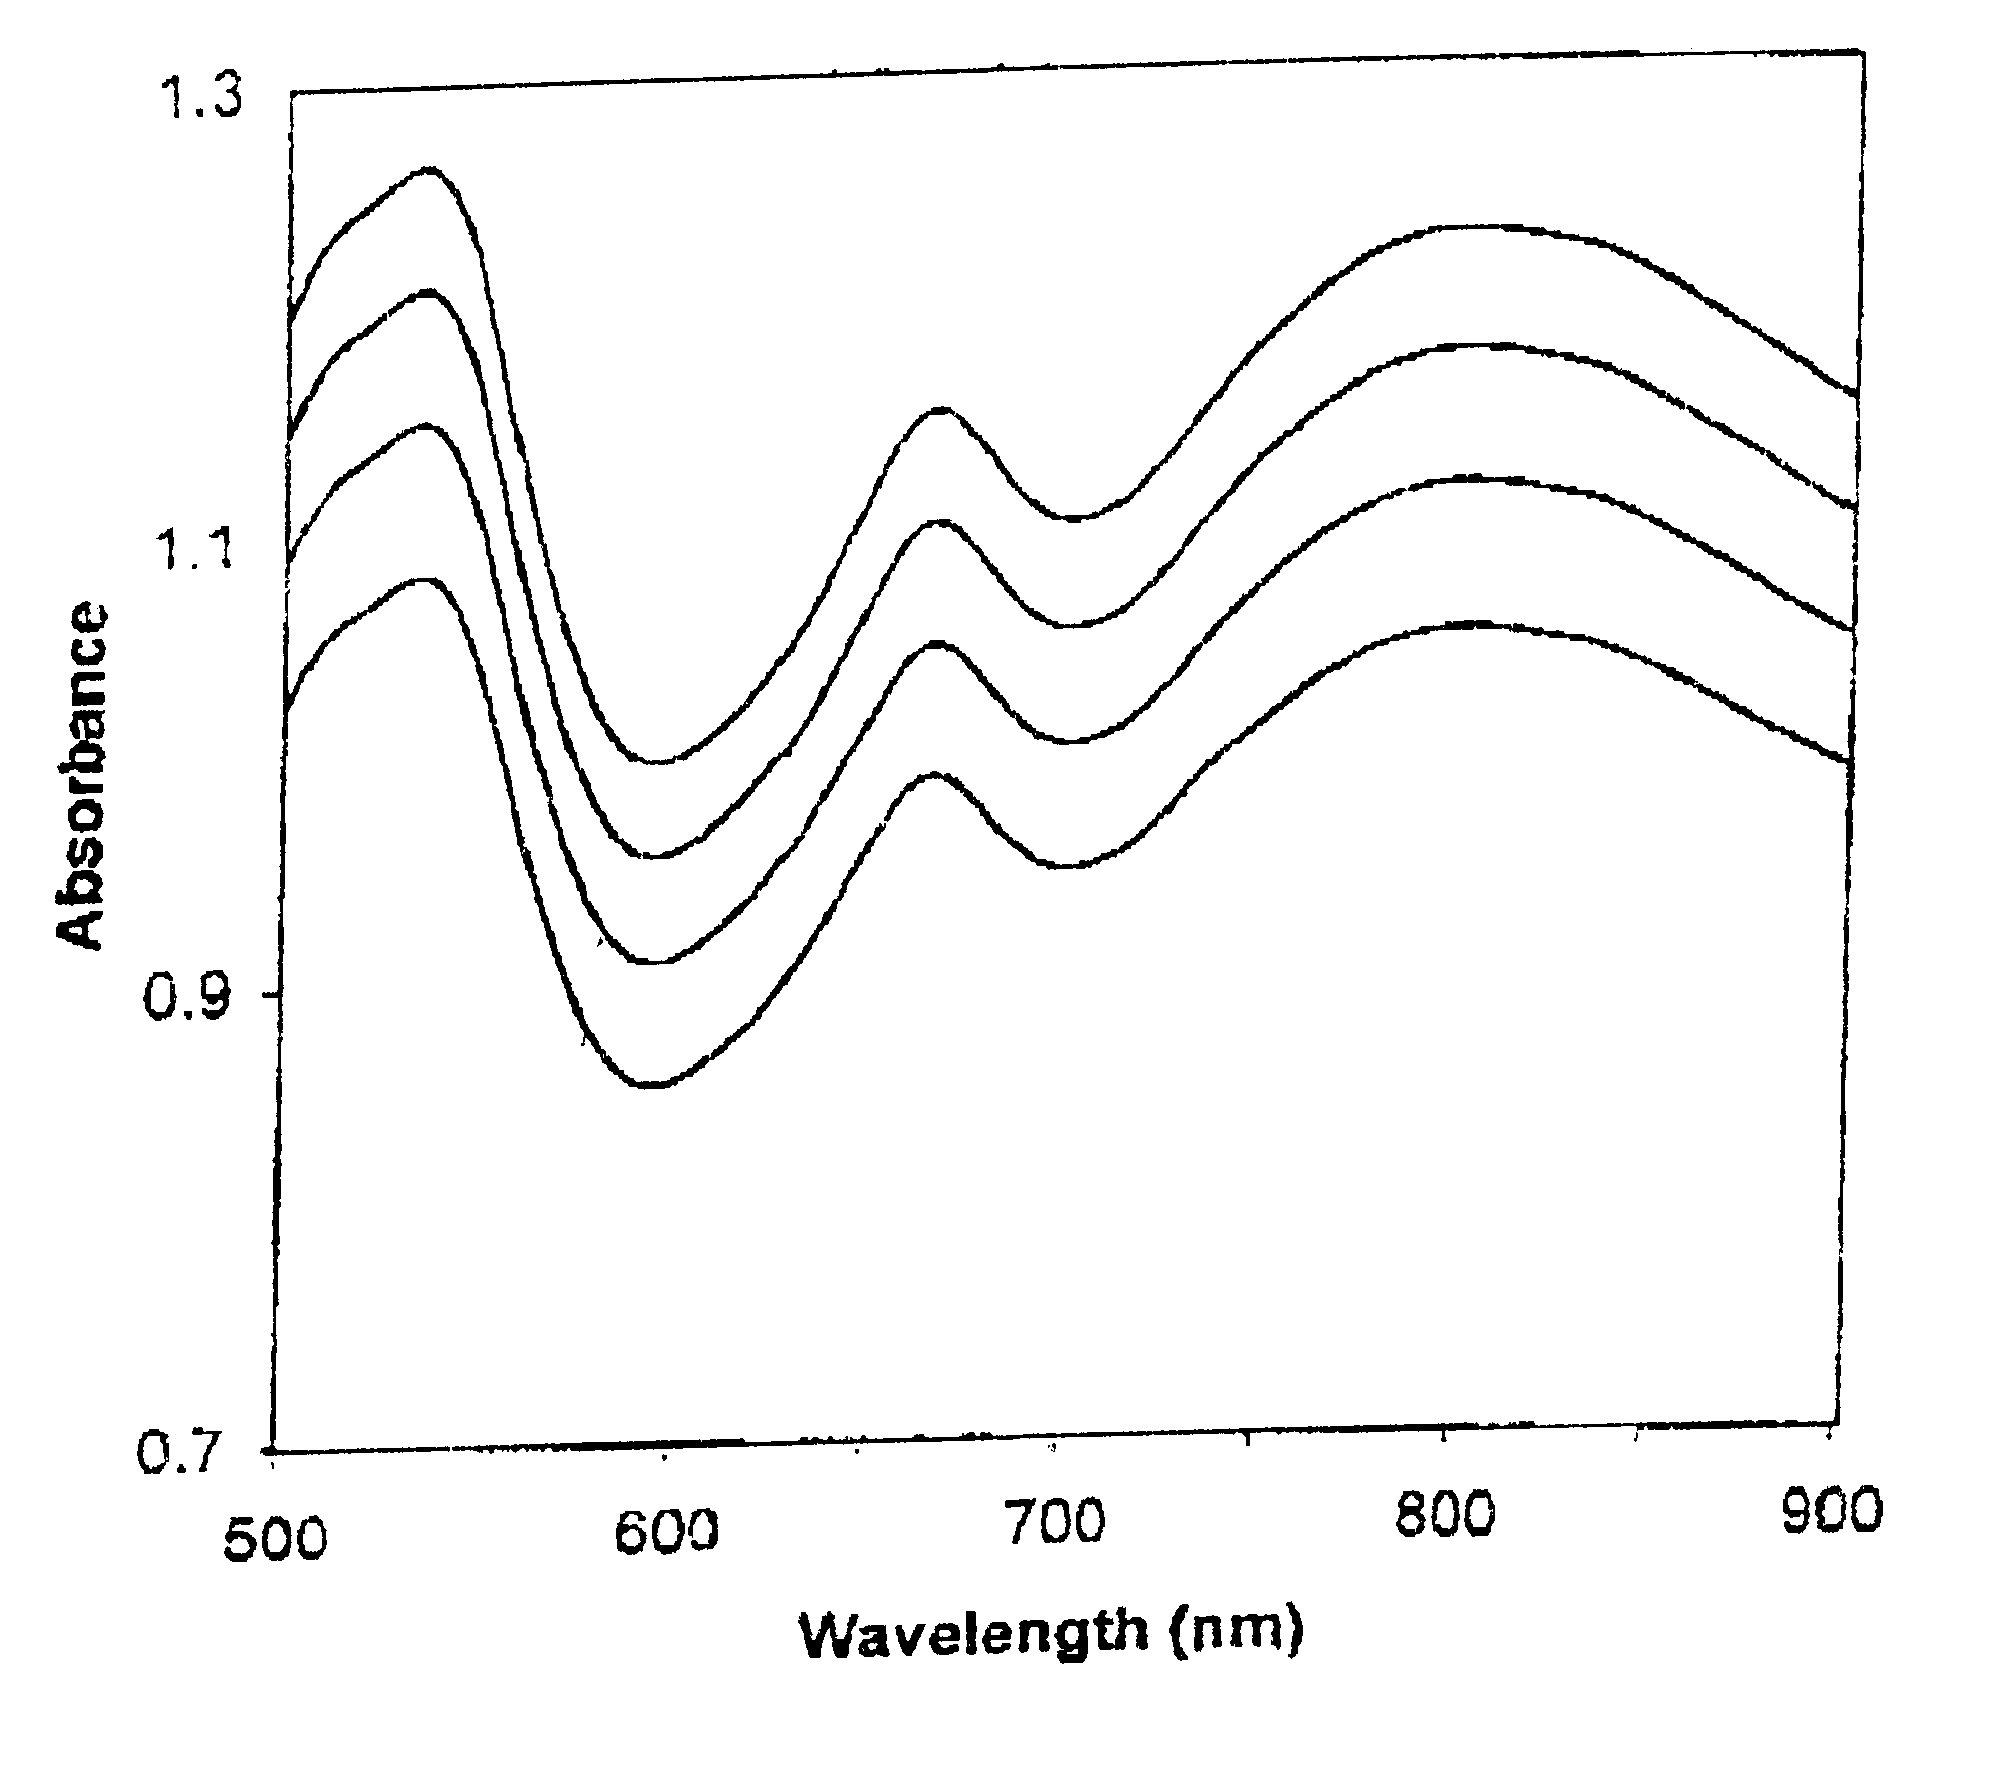
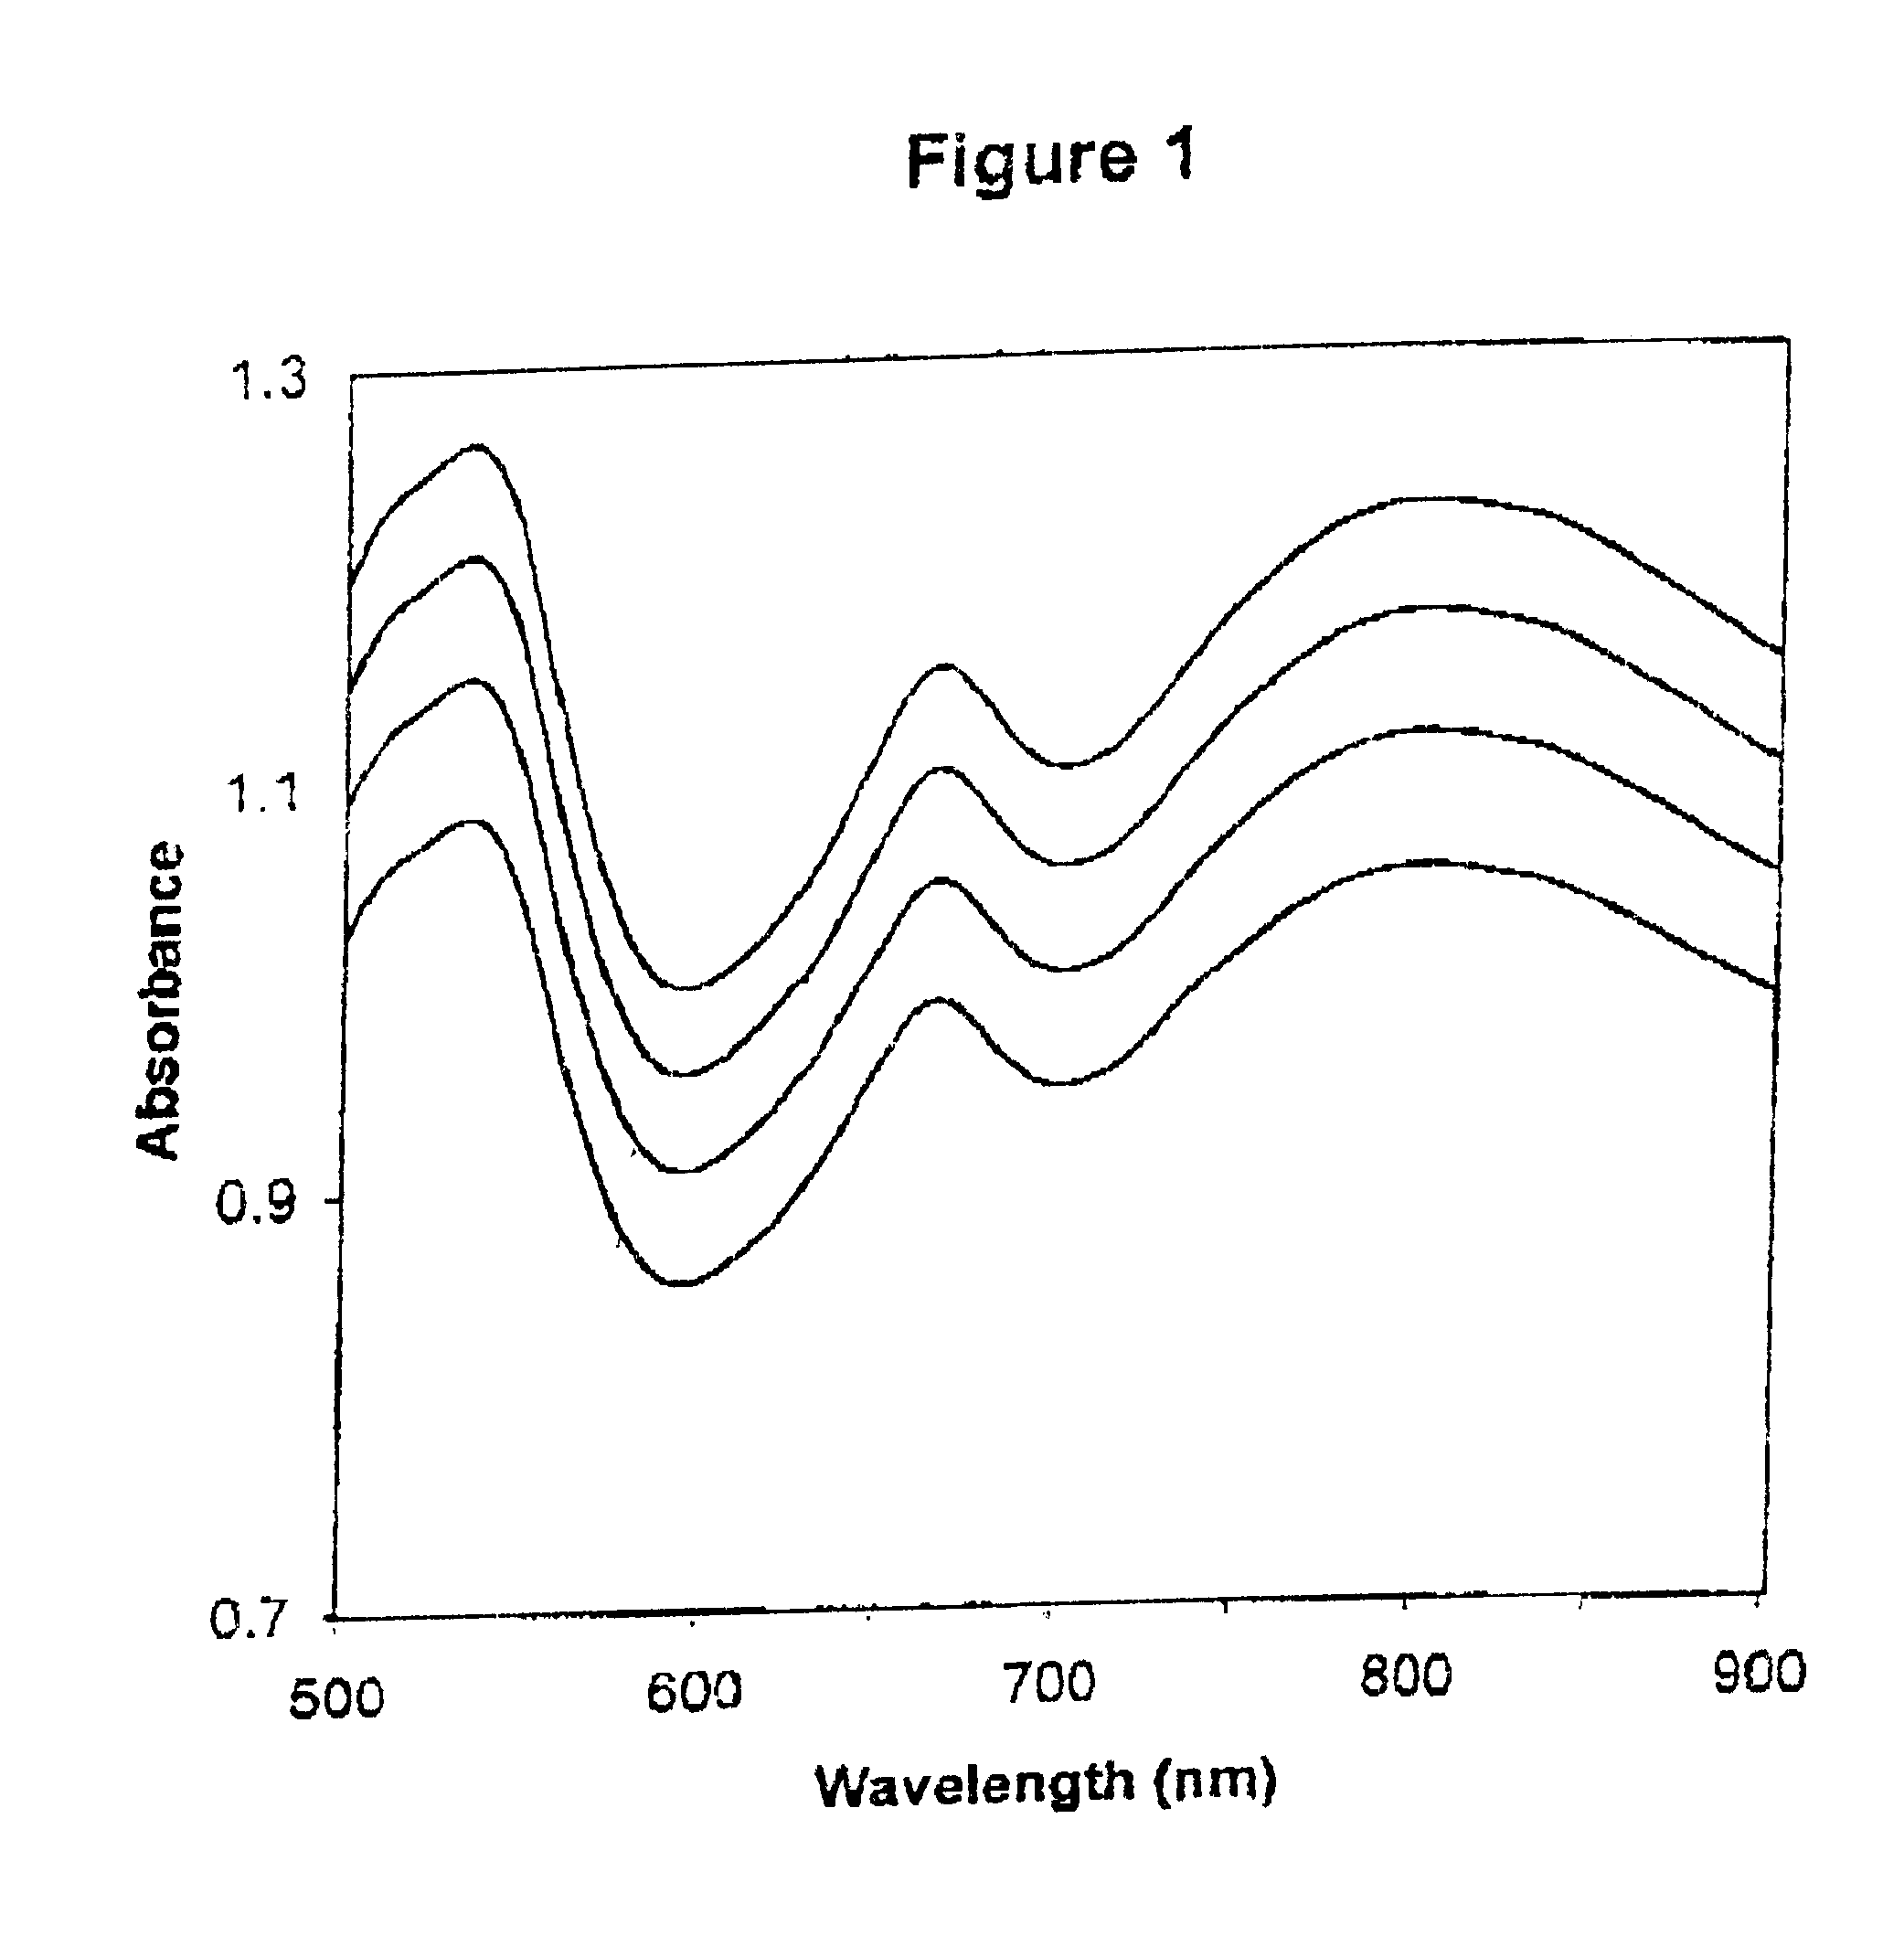
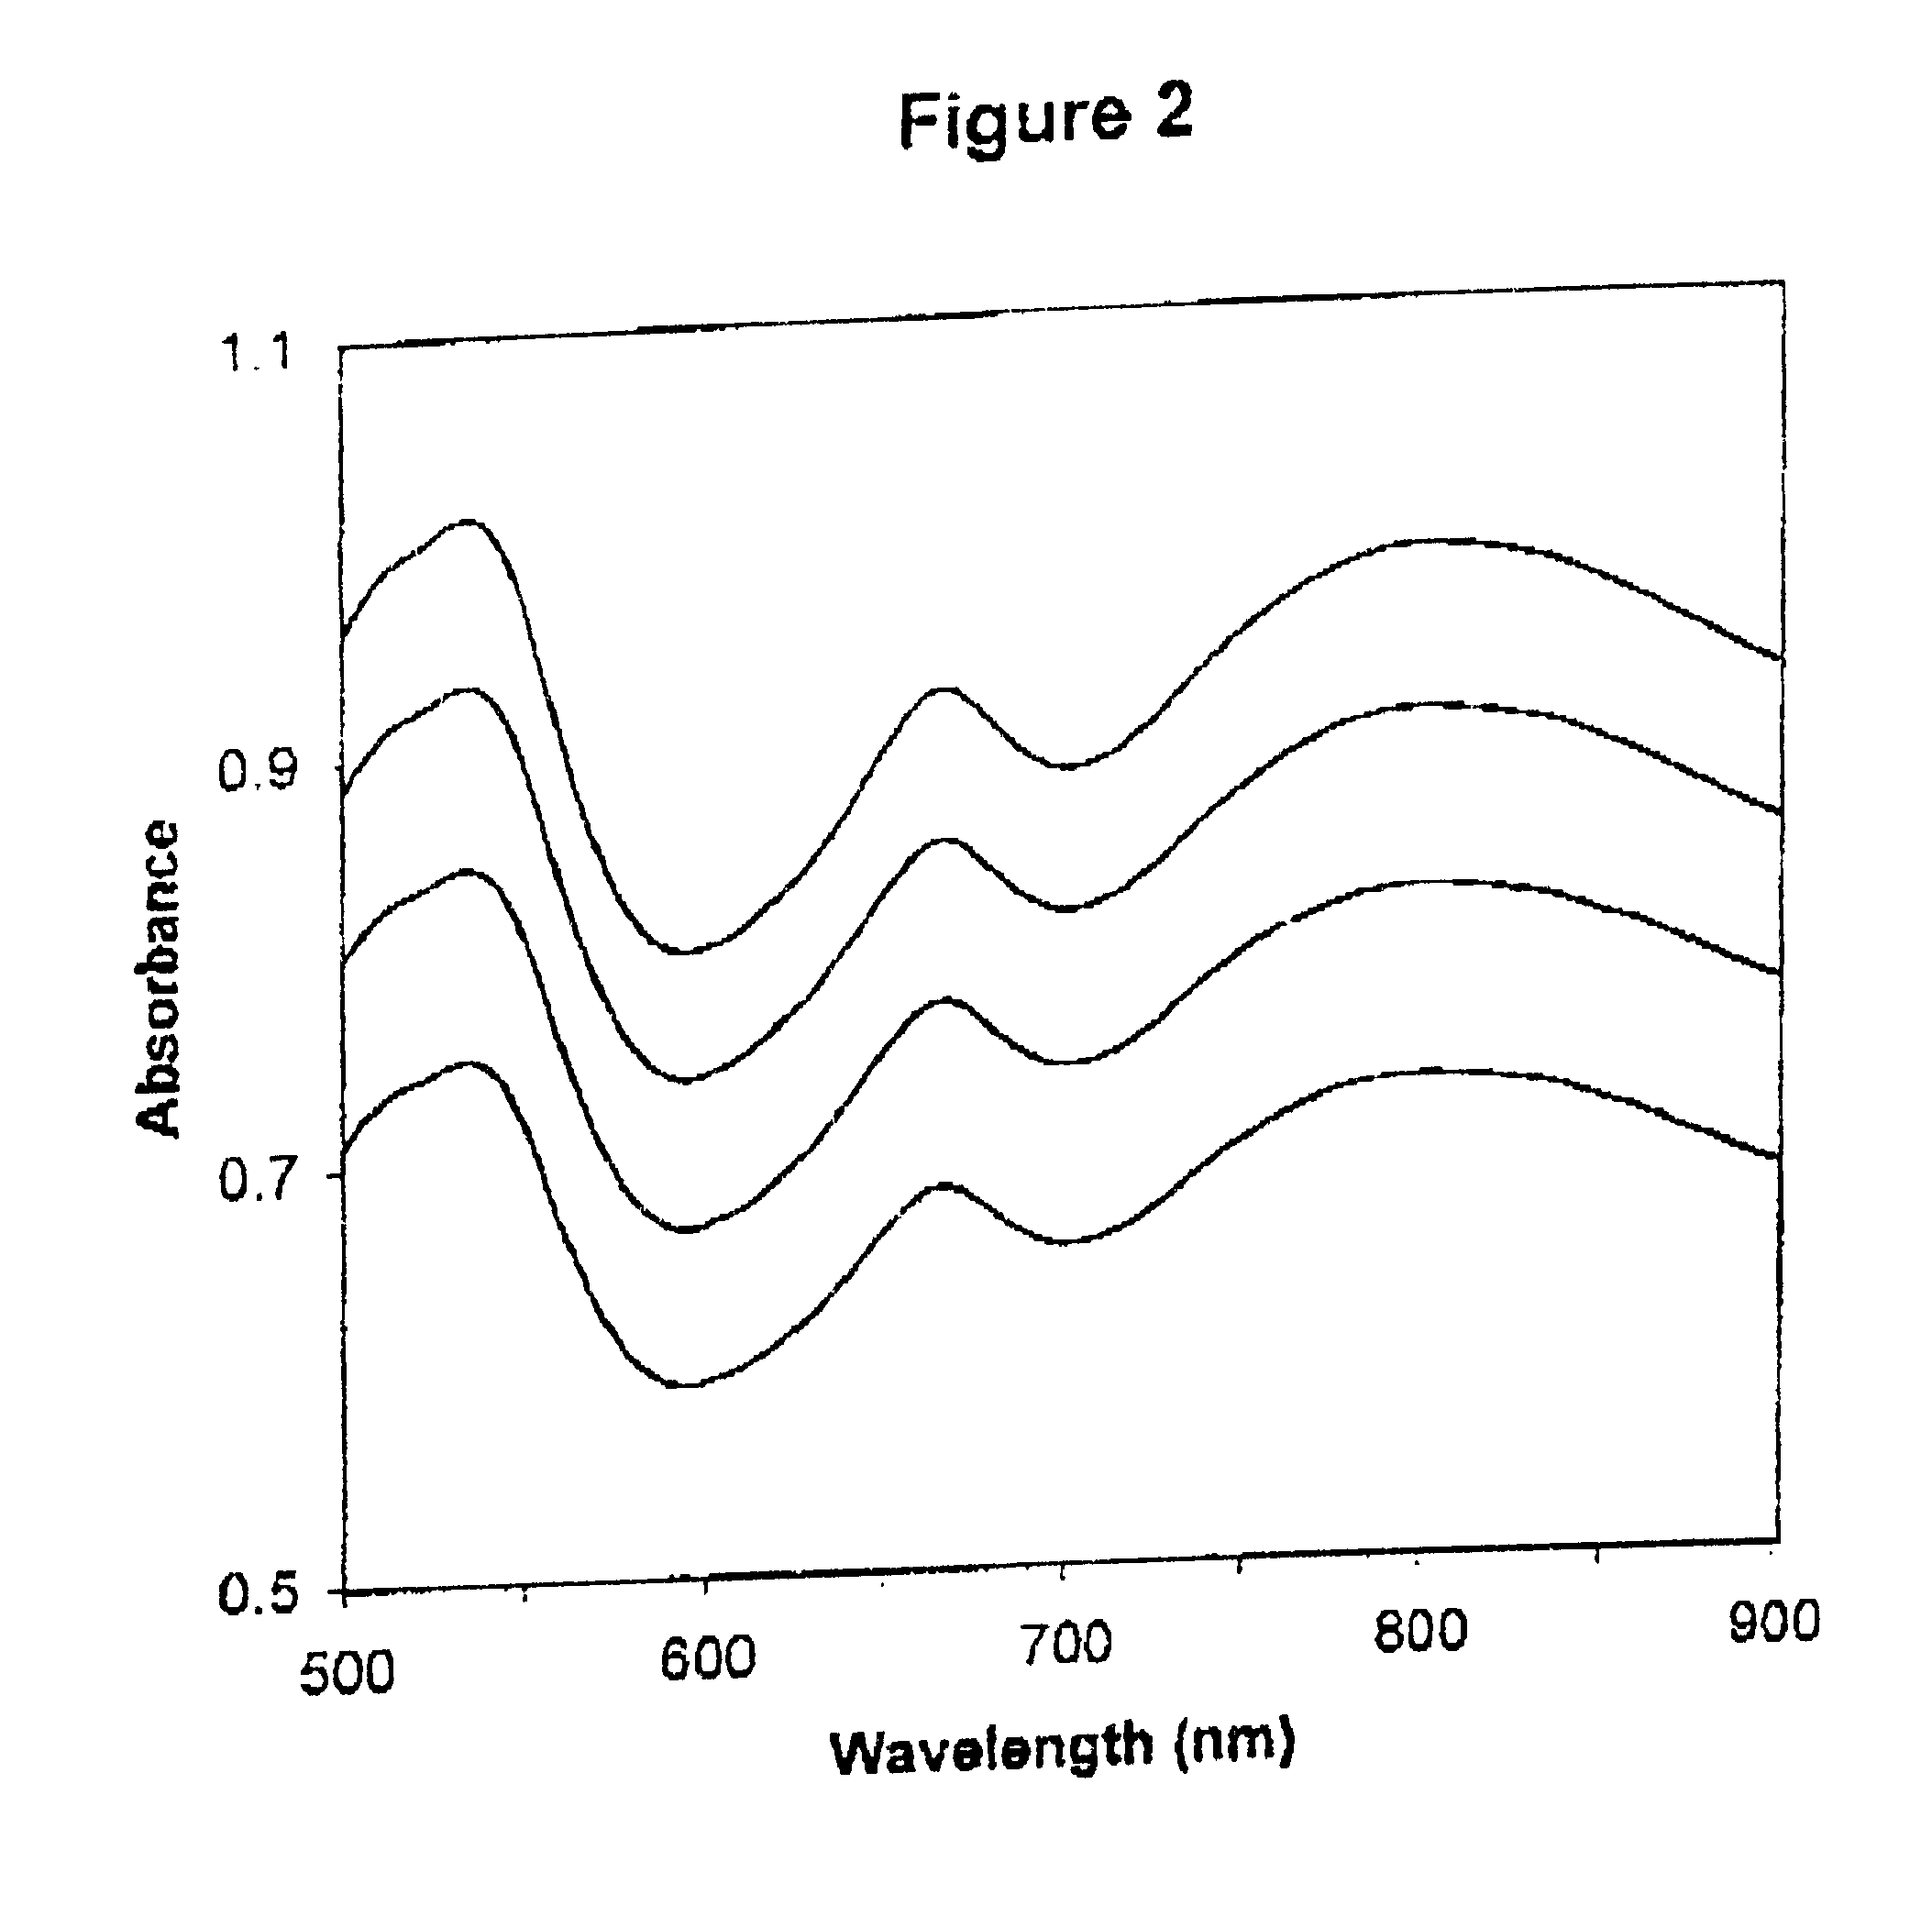
The absorbance spectra of four calibrators when tested on a first apparatus are shown in FIG. 1; the absorbance spectra obtained from a second apparatus are shown in FIG. 2. The first linear regression plots and equations for standard wavelengths 500 nm, 550 nm, 600 nm, 650 nm, 700 nm and 750 nm are shown in FIGS. 3, 4, 5, 6, 7, and 8 respectively. Table 1 shows the y-intercepts and slopes for the wavelengths chosen as examples.

The slopes are very similar for the wavelength example shown in Table 1, but there are more significant differences for the y-intercepts. These numbers are very different from apparatus to apparatus. The large R.sup.2 values (very close to 1) indicates the high correlation between the absorbances of the two apparatuses, and hence the reliability of the photometric corrections.

The y-intercepts and slopes in Table 1 were derived from the first linear regression Plots of absorbances for the calibrators obtained on the first apparatus (x-axis) and second apparatu...

example 2

For illustration, a primary Hb calibration algorithm was developed for apparatus #1, (a "First Apparatus"), and the same calibration algorithm was applied to data generated from five other apparatuses (#2, #3, #4, #5 and #6, all of which are second apparatus). In this example, calibration between instruments is illustrated using the first derivative of the absorbance spectra.

The absorbance spectra for the same sample was shown for only three of the apparatus for clarity (#2, #4 and #6); they demonstrated the full range of variability in the absorbance spectra for a standard set of wavelengths for the six apparatus used, without photometric correction (FIG. 9). When the first derivative of absorbance was calculated and plotted (FIG. 10), most of the variability disappeared, especially at wavelengths 593 nm and 608 nm, which were used in the calibration algorithm for hemoglobin, shown below:

g / L Hb=-0.22-75.96.times.(1st derivative of absorbance at 593 nm)+81.45.times.(1st derivative o...

example 3

Upon examination of the spectra in FIG. 9, it may be seen that photometric correction would be necessary if the raw absorbances at any wavelength were used in the calibration algorithm. Upon examination of the first derivative of absorbance spectra of the same synthetic fluid tested on the same 3 different apparatus (#2, #4, #6) in FIG. 9, it is observed that there are no differences in the apparatus at 593 nm and 608 nm, using a standard set of wavelengths. It can be appreciated by those skilled in the art that the requirement of photometric correction depends on the required accuracy of the predicted analyte.


PUM

PropertyMeasurementUnit
wavelengthsaaaaaaaaaa

Abstract

Described is a method for calibrating a spectrophotometric apparatus. This method involves obtaining a first set of absorbance measurements of a set of calibrators on a First Apparatus that is in control at wavelengths from a first wavelength calibration table. A second wavelength calibration table on a second apparatus is established, wherein the first and the second wavelength calibration tables may be the same or different. A second set of absorbance measurements of the set of calibrators is obtained on the Second Apparatus, at wavelengths from the second wavelength calibration table. First and second interpolated absorbances are determined, for the first and the second absorbance measurement, respectively, for at least one wavelength of a Standard Set of Wavelengths. Using the first and the second interpolated absorbances, a linear regression equation for each wavelength of said Standard Set of Wavelengths is determined. The linear regression equation and at least one Primary Calibration Algorithm are incorporated onto the Second Apparatus, to produce a calibrated apparatus. The present invention is also directed to a medium storing instructions adapted to be executed by a processor to determine analyte concentration within a sample. Furthermore, the present invention provides an apparatus for determining analyte concentration of a sample, and a system for determining presence of an analyte in a sample.

Description

This invention is in the field of spectrophotometric determinations of concentrations of analytes in samples. The invention further relates to methods of calibrating spectrophotometers. Particularly, the method relates to the calibration of spectrophotometric apparatus designed to measure interferents in serum and plasma.BACKGROUND OF INVENTIONClinical laboratory tests are routinely performed on serum or plasma of whole blood. In a routine assay, red blood cells are separated from plasma by centrifugation. Red blood cells and various plasma proteins may also be separated from serum by clotting prior to centrifugation. Hemoglobin (Hb), light-scattering substances like lipid particles, bile pigments bilirubin (BR) and biliverdin (BV) are typical substances which will interfere with and affect spectrophotometric and other blood analytical measurements and are therefore referred to as interferents. The presence of such interferents affects the ability to perform tests on the serum or pl...

Claims


Application Information

Patent Timeline
Patent Type & Authority Patents(United States)
IPC IPC(8): G01N21/27G01N21/47G01N21/25
CPCG01N21/274G01N21/4785
Inventor SAMSOONDAR, JAMES
Owner TYCO HEALTHCARE GRP LP
Why Eureka
Try Eureka