Method and apparatus for analyzing composition of defects

a composition analysis and defect technology, applied in the field of methods and apparatus for analyzing defects composition, can solve the problems of reducing yield, affecting the quality of composition analysis, and increasing the amount of time required for composition analysis, and achieves high efficiency and high precision

Active Publication Date: 2005-03-22
HITACHI LTD
View PDF8 Cites 18 Cited by
  • Summary
  • Abstract
  • Description
  • Claims
  • Application Information

AI Technical Summary

Benefits of technology

The present invention eliminates these problems and provides a method and device for analyzing the composition of defects that can observe defects and analyze the composition of the defects with high precision and high efficiency.

Problems solved by technology

When defects and particles are generated on a semiconductor wafer due to inadequacies or abnormalities in the production conditions of the manufacturing device, the probability that defects will be generated in the products becomes higher and results in lowering yield.
In this case, because it is impossible to implement inspection of all wafers for each manufacturing process because of time and energy constraints, ordinarily inspections are implemented with respect to sampled lots and wafers per step comprising several processes (process group).
Also, the amount of time necessary for composition analysis is usually long in comparison with the amount of time necessary for the review.
However, error is included in the coordinates obtained from the inspection device.
Moreover, in addition to this, a setting error is also included in the stage position of the SEM (thus, defect positions).
For this reason, it is difficult to reliably irradiate the electron beam on defects of a size close to the error dimension of the stage.
In the conventional examples of each of the aforementioned patent publications, consideration is not given to highly precise and efficient control methods that can reliably irradiate the electron beam on defects of this size.
However, in the aforementioned conventional examples, consideration is not given to such circumstances, and when composition analysis is automatically carried out, the same analysis conditions must be set even if there are changes in such circumstances.

Method used


Image

  • Method and apparatus for analyzing composition of defects
  • Method and apparatus for analyzing composition of defects
  • Method and apparatus for analyzing composition of defects

Examples


first embodiment

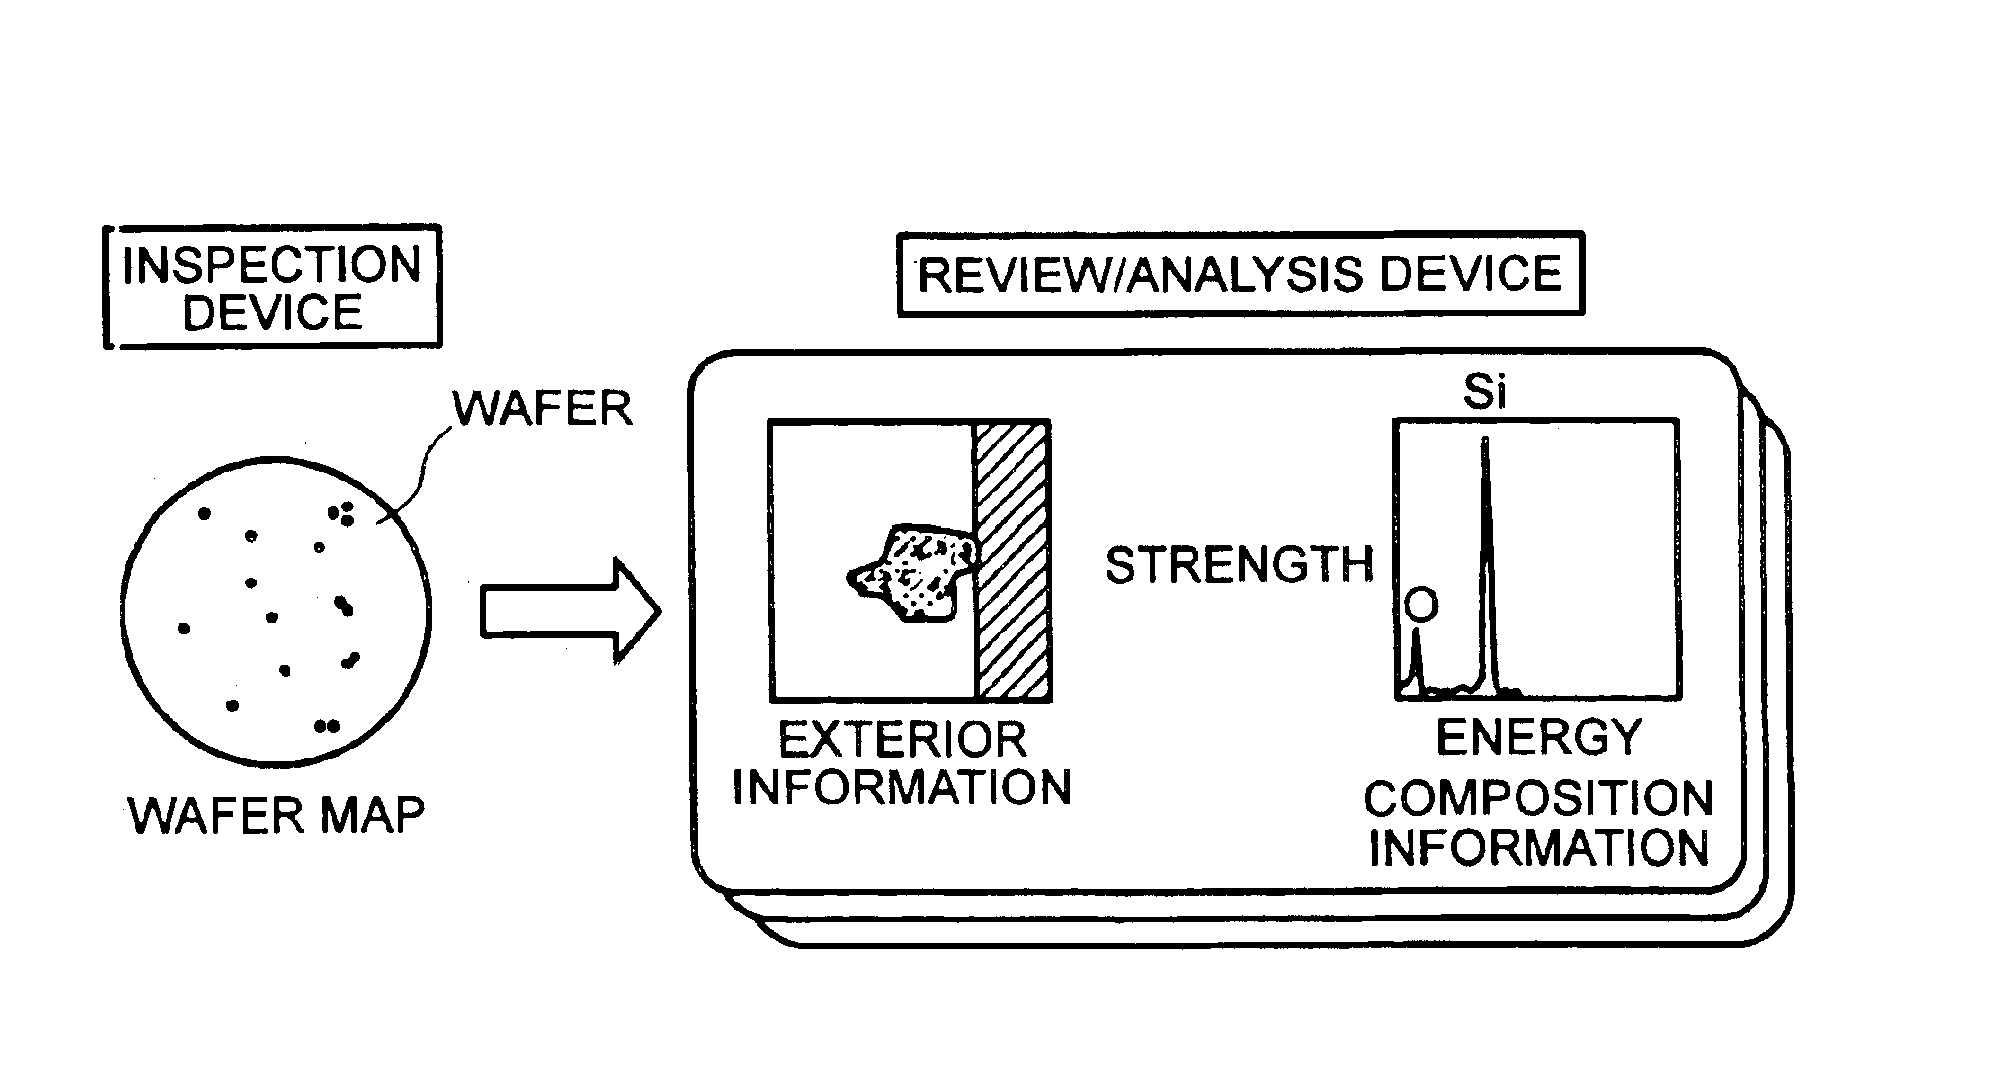
As described above, in the first embodiment, because the target defects for composition analysis can be selected on the basis of the review of the defect images, narrowing-down of the target defects for composition analysis that is effective and in accordance with the standard that the user demands can be implemented.

It should be noted that, in a case where all of the defects detected by the inspection device 18 serve as targets for composition analysis or a case where the user selects defects to serve as targets for composition analysis, the processing operation for review of steps 101 to 112 is not always necessary. When only composition analysis of defects is necessary, steps 101 to 112 can be omitted.

FIG. 7 is a flow chart showing a second embodiment of the method of analyzing the composition of defects according to the invention. The same reference numerals will be given to steps corresponding to those in FIG. 6 and overlapping description will be omitted. The second embodiment...

sixth embodiment

In this manner, in the sixth embodiment also, the reference composition spectrum of the defect corresponding position of the proximate chip can be acquired.

FIG. 12 is a flow chart showing a seventh embodiment of the method of analyzing the composition of defects according to the invention. In the third embodiment of FIG. 8, steps 300 to 122 are replaced with the series of processing operations shown in FIG. 12, and the same reference numerals will be given to steps corresponding to those in FIG. 8.

In FIG. 12, first, the EB conditions are set to conditions for EDX analysis between steps 300 and 122 in order to acquire the reference composition spectrum and the defect composition spectrum (step 700). At this time, because the defect corresponding position of the proximate chip coincides with the irradiation position of the electron beam EB due to steps 108 and 109 of FIG. 8, the electron beam EB is irradiated onto the proximate chip, whereby the defect corresponding position is irradi...

seventh embodiment

In this manner, in the seventh embodiment also, the reference composition spectrum of the defect corresponding position of the proximate chip can be acquired.

FIG. 13 is a flow chart showing an eighth embodiment of the method of analyzing the composition of defects according to the invention. In the fourth embodiment of FIG. 9, a step 800 for acquiring the composition reference spectrum is added, and the same reference numerals will be given to steps corresponding to those in FIG. 9.

In FIG. 13, at the time it is determined that the review-processed defect is to serve as the target of composition analysis (step 300), because the EB conditions have already been set to conditions for EDX analysis due to the steps of FIG. 9 and the defect corresponding position of the proximate chip coincides with the irradiation position of the electron beam EB due to steps 108 and 109, the electron beam EB is irradiated on the defect corresponding position and the reference composition spectrum is acqu...


PUM

PropertyMeasurementUnit
compositionsaaaaaaaaaa
compositionaaaaaaaaaa
energy dispersive X-aaaaaaaaaa

Abstract

In order to be able to detect an irradiation position of an electron beam matching a defect position and conduct composition analysis of a defect with high precision and high efficiency, in the present invention, when a composition analysis target defect is selected and irradiation conditions of the electron beam are set for EDX analysis, a low-resolution reference image of low resolution is acquired using the electron beam at a defect corresponding position corresponding to the position of this defect on a chip in the vicinity of a target chip including defects, and a low-resolution defect image of the same low resolution is next acquired at the defect position of the target chip. Then, by comparing these low-resolution images, the defect position is acquired, the electron beam is slanted and irradiated on this defect position to acquire a composition spectrum of the defect.

Description

BACKGROUND OF THE INVENTIONThe present invention relates to a method and device that are mainly used in the production process of semiconductor electronic circuits and are for reviewing and analyzing, on the basis of inspection information, the composition of particles and defects generated on a semiconductor wafer.The production of semiconductor devices is configured by numerous processes. These can be broadly divided into a substrate step for creating transistor elements on a substrate and a wiring step for creating wirings that connect these elements. These steps are respectively configured by a combination of plural processes, such as a thin-film deposition process, a photo lithography process, an etching process, an impurity doping process, a anneal process, a polarization process and a cleaning process. The number of such manufacturing steps can sometimes reach several hundreds of steps.When defects and particles are generated on a semiconductor wafer due to inadequacies or ab...

Claims


Application Information

Patent Timeline
Patent Type & Authority Patents(United States)
IPC IPC(8): G01N23/225G01N23/22G01R31/26H01J37/252H01L21/66H01J37/147G01Q30/02G06T7/00
CPCG06T7/0004G06T2207/30148
Inventor OBARA, KENJITAKAGI, YUJISHIBUYA, HISAEHOSOYA, NAOKI
Owner HITACHI LTD
Why Eureka
Try Eureka