Method and system for trend detection and analysis

a trend detection and analysis technology, applied in the field of trend detection and analysis in data, can solve the problems of reducing the confidence of operators or service technicians, conventional data analysis methods, and large number of false alerts, so as to diminish and reduce the effect of extraneous data points

Inactive Publication Date: 2006-05-02
PRATT & WHITNEY CANADA CORP
View PDF4 Cites 36 Cited by
  • Summary
  • Abstract
  • Description
  • Claims
  • Application Information

AI Technical Summary

Benefits of technology

[0009]Accordingly, an object of the present invention is to provide improved data analysis techniques and processes, which are also amenable to automation.
[0014]According to another broad aspect of the present invention, there is provided a method for smoothing a data set for use in data analysis of the data set having a plurality of data points, comprising: providing the data set to be analyzed; locating potentially bad data points in at least a portion of the data set using an odd-man out recursive technique; preparing a baseline set by discarding the potentially bad data points from the at least a portion of the data set; and calculating a baseline value from the baseline set; and smoothing the data set to diminish an effect of extraneous data points and obtain smoothed data, wherein the smoothing includes using a two-pass weighted average and regression technique.
[0015]According to another broad aspect of the present invention, there is provided a method for smoothing a time-based data set for use in data analysis of the data set having a plurality of data points, comprising: providing the data set to be analyzed; locating potentially bad data points in at least a portion of the data set using an odd-man out recursive technique; preparing a baseline set by discarding the potentially bad data points from the at least a portion of the data set; calculating a baseline value from the baseline set; and smoothing the data set to diminish an effect of extraneous data points and obtain smoothed data, wherein the smoothing includes using a Fast Fourier Transform (FFT) algorithm to transfer the time-based data set into a frequency based data set; attenuating low frequencies of the frequency-based data set; and using an inverse Fourier Transform (IFT) algorithm to transfer the attenuated frequency based data set into an attenuated time-based data set.
[0018]According to another broad aspect of the present invention, there is provided a system for removing very low frequency noise from a time-based data set for use in data analysis of the time-based data set having a plurality of data points, comprising: a data provider for providing the time-based data set to be analyzed; a baseline determiner for determining a baseline value from at least a portion of the data set; a low frequency noise data smoother for smoothing the data set to diminish an effect of extraneous data points and obtain smoothed data, wherein the smoothing includes using a Fast Fourier Transform (FFT) algorithm to transfer the time-based data set into a frequency based data set; attenuating low frequencies of the frequency-based data set; and using an inverse Fourier Transform (IFT) algorithm to transfer the attenuated frequency based data set into an attenuated time-based data set.

Problems solved by technology

Conventional data analysis methods of the type described, however, when used on complex data, typically suffer from large numbers of false alerts (e.g. if thresholds are set too close to normal operating levels, or alert conditions are otherwise improperly marked) and / or of large numbers of missed alerts (e.g. if the thresholds are set too expansively, or alert conditions are otherwise missed).
While false alerts reduce the operator's or service technician's confidence in the trend detection process, missed or delayed alerts can result in serious maintenance issues downstream.
Sources of error include the use of statistical smoothing techniques, such as 15-point rolling average and exponential smoothing, which make data “too smooth” by improperly removing critical data points.
Another problem encountered when doing data analysis of this type is the presence of noise in the engine parameters.
However, other types of noise, such as low frequency noise may cause an automatic analysis system to miscalculate alerts.
For example, in the operation of a machine, the seasonal variation in environmental operating conditions may affect parametric data relating to temperature, humidity, etc., yet the prior art does not adequately account for such factors.
Still another problem is how to calculate an accurate baseline for use in analyzing engine performance data.
However, the prior art does not account for the fact that there may be an immediate deterioration in the data as parts and subassemblies may settle somewhat, causing “slippage” (actually or metaphorically) in the system which may cause a baseline calculated from these first data points to be inaccurate.
The difficulty is, however, that the first data points are typically the “best” baseline data available, and so they should not simply be ignored indiscriminately.
Some of these problems have been addressed without success by the prior art systems.
Others of these problems have not even been recognized by the prior art.

Method used


Image

  • Method and system for trend detection and analysis
  • Method and system for trend detection and analysis
  • Method and system for trend detection and analysis

Examples


Embodiment Construction

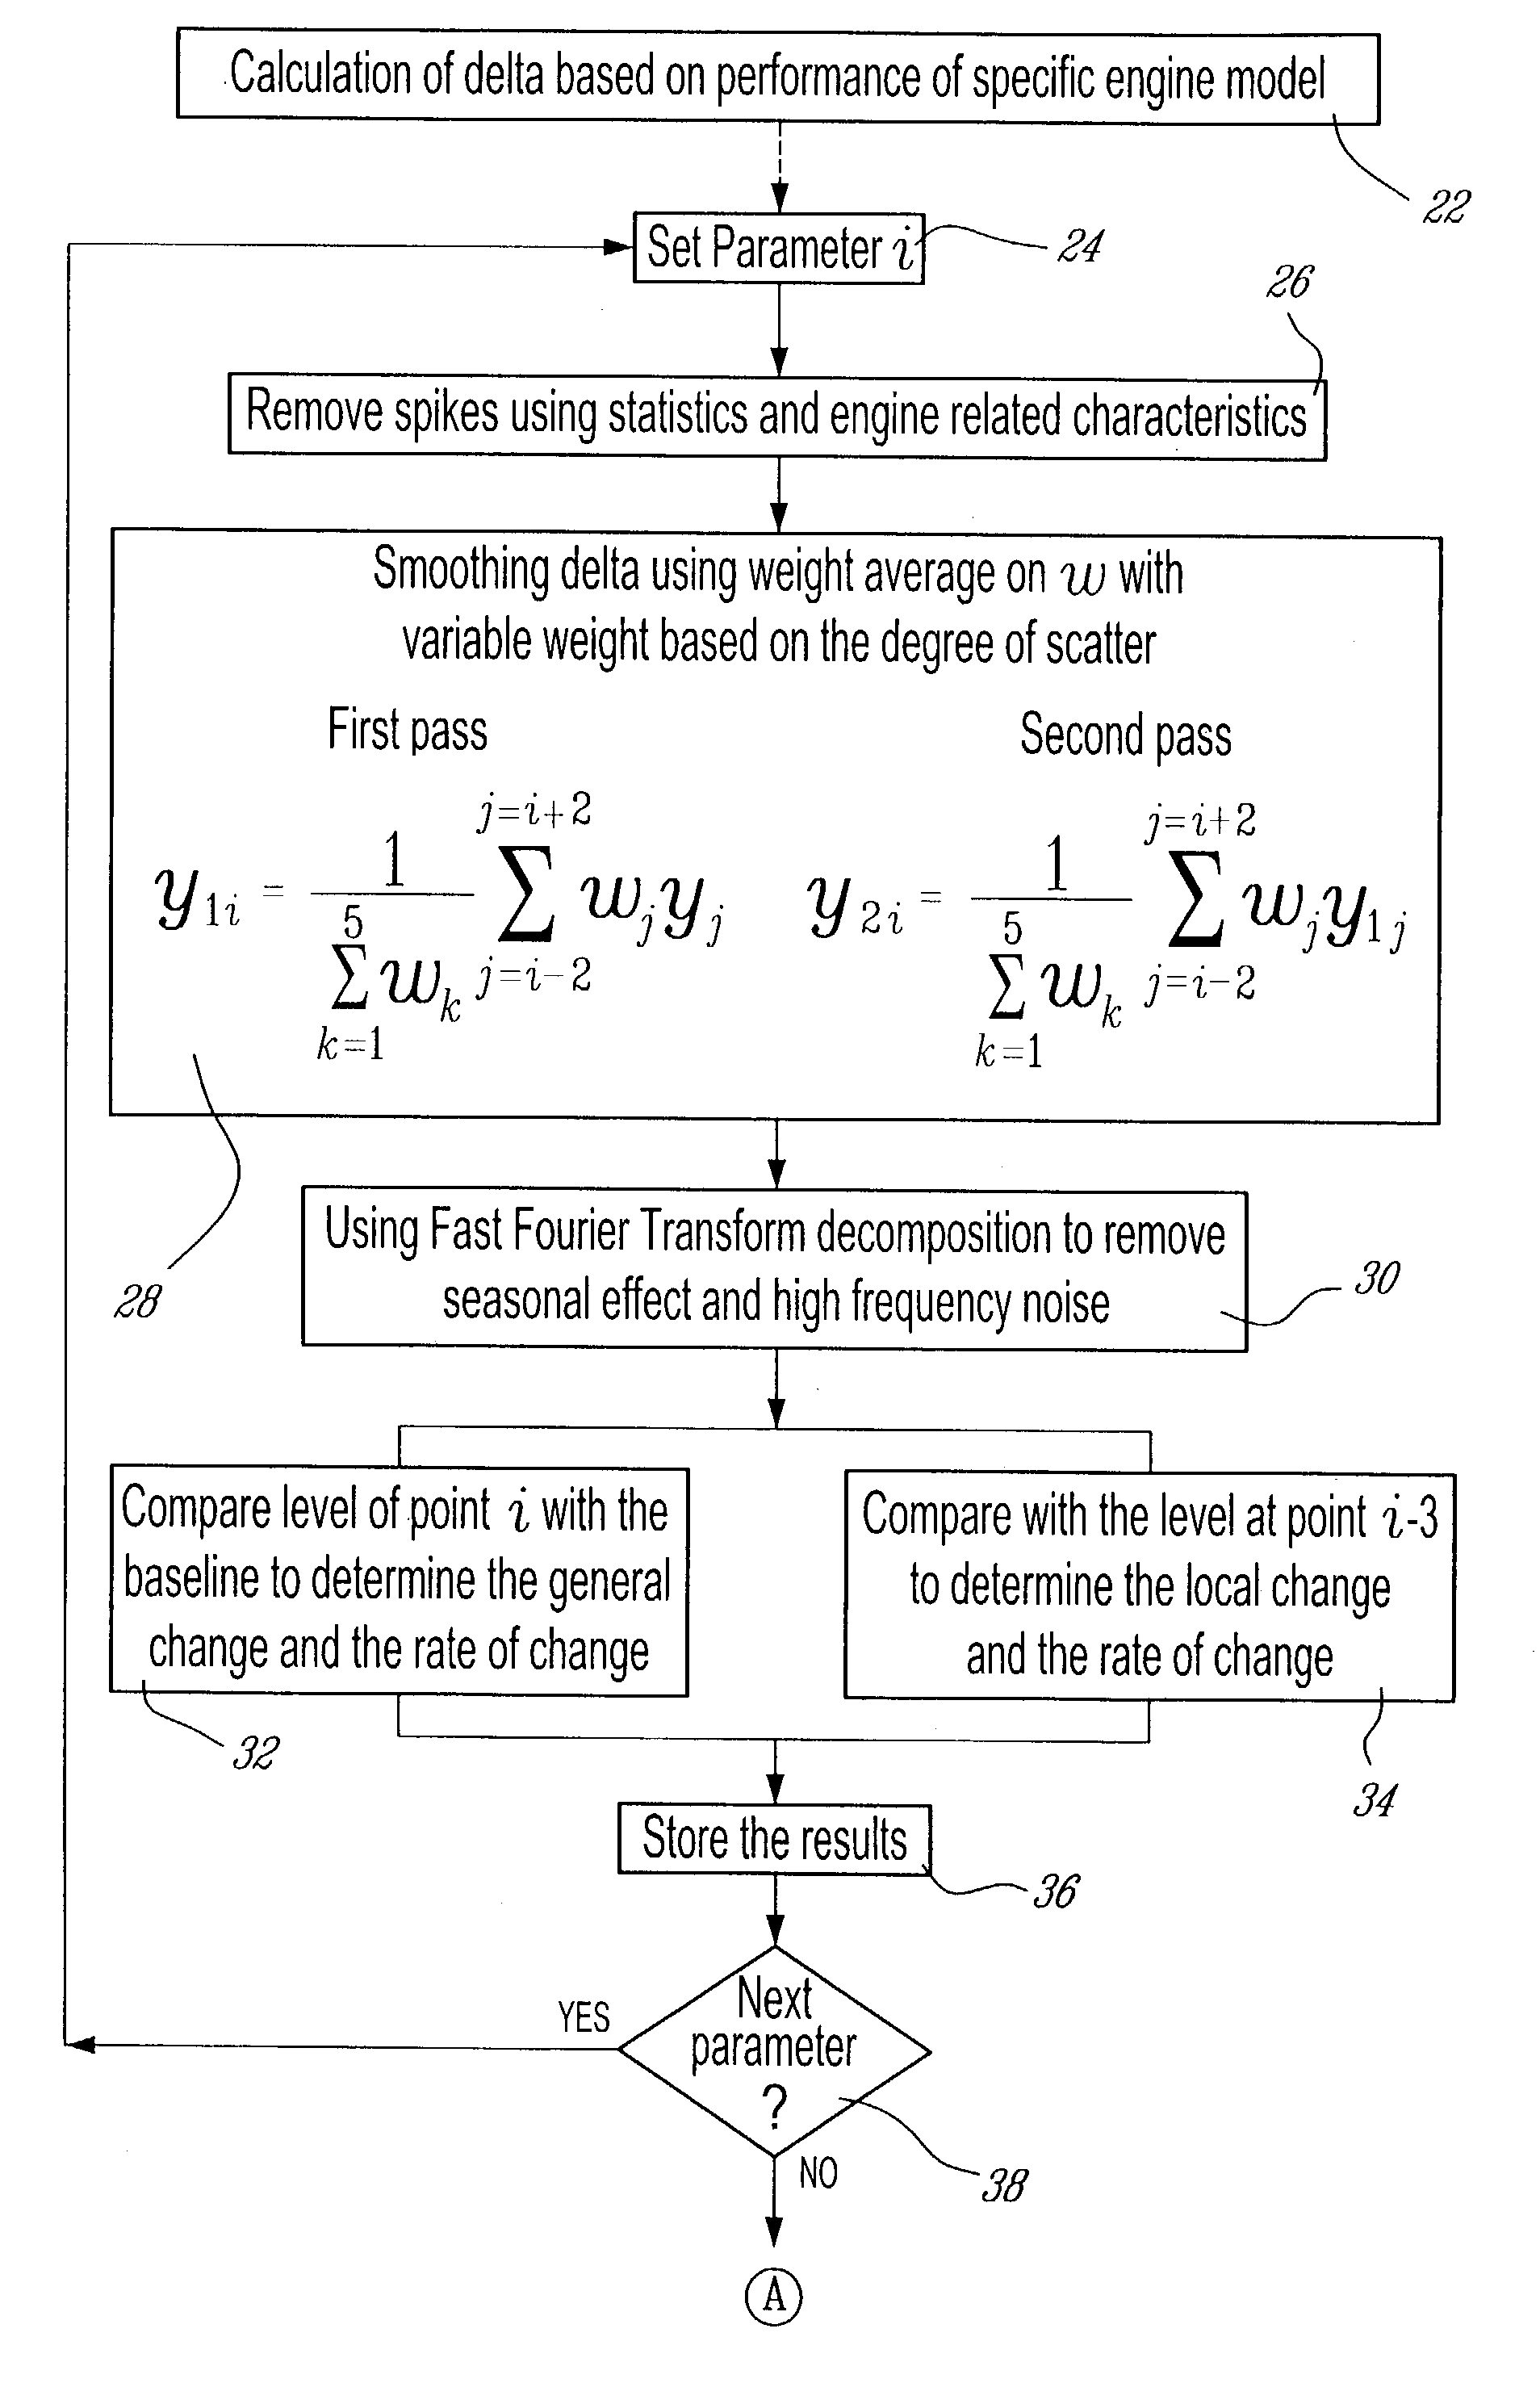
[0029]The present invention relates to a technique for analyzing trends in data. In the particular embodiment described, the data is typical gas turbine engine performance data of the general type displayed graphically in FIGS. 5 and 6, and which may typically include measured parameters such as compressor speed (NL for low pressure compressor and NH for high pressure compressor), inter-turbine temperature (ITT), fuel flow (WF), main oil pressure and temperature (MOP and MOT, respectively), etc. However, it will be understood by one skilled in the art that the data could come from any source if proper parameters are chosen and appropriate knowledge databases are used as necessary.

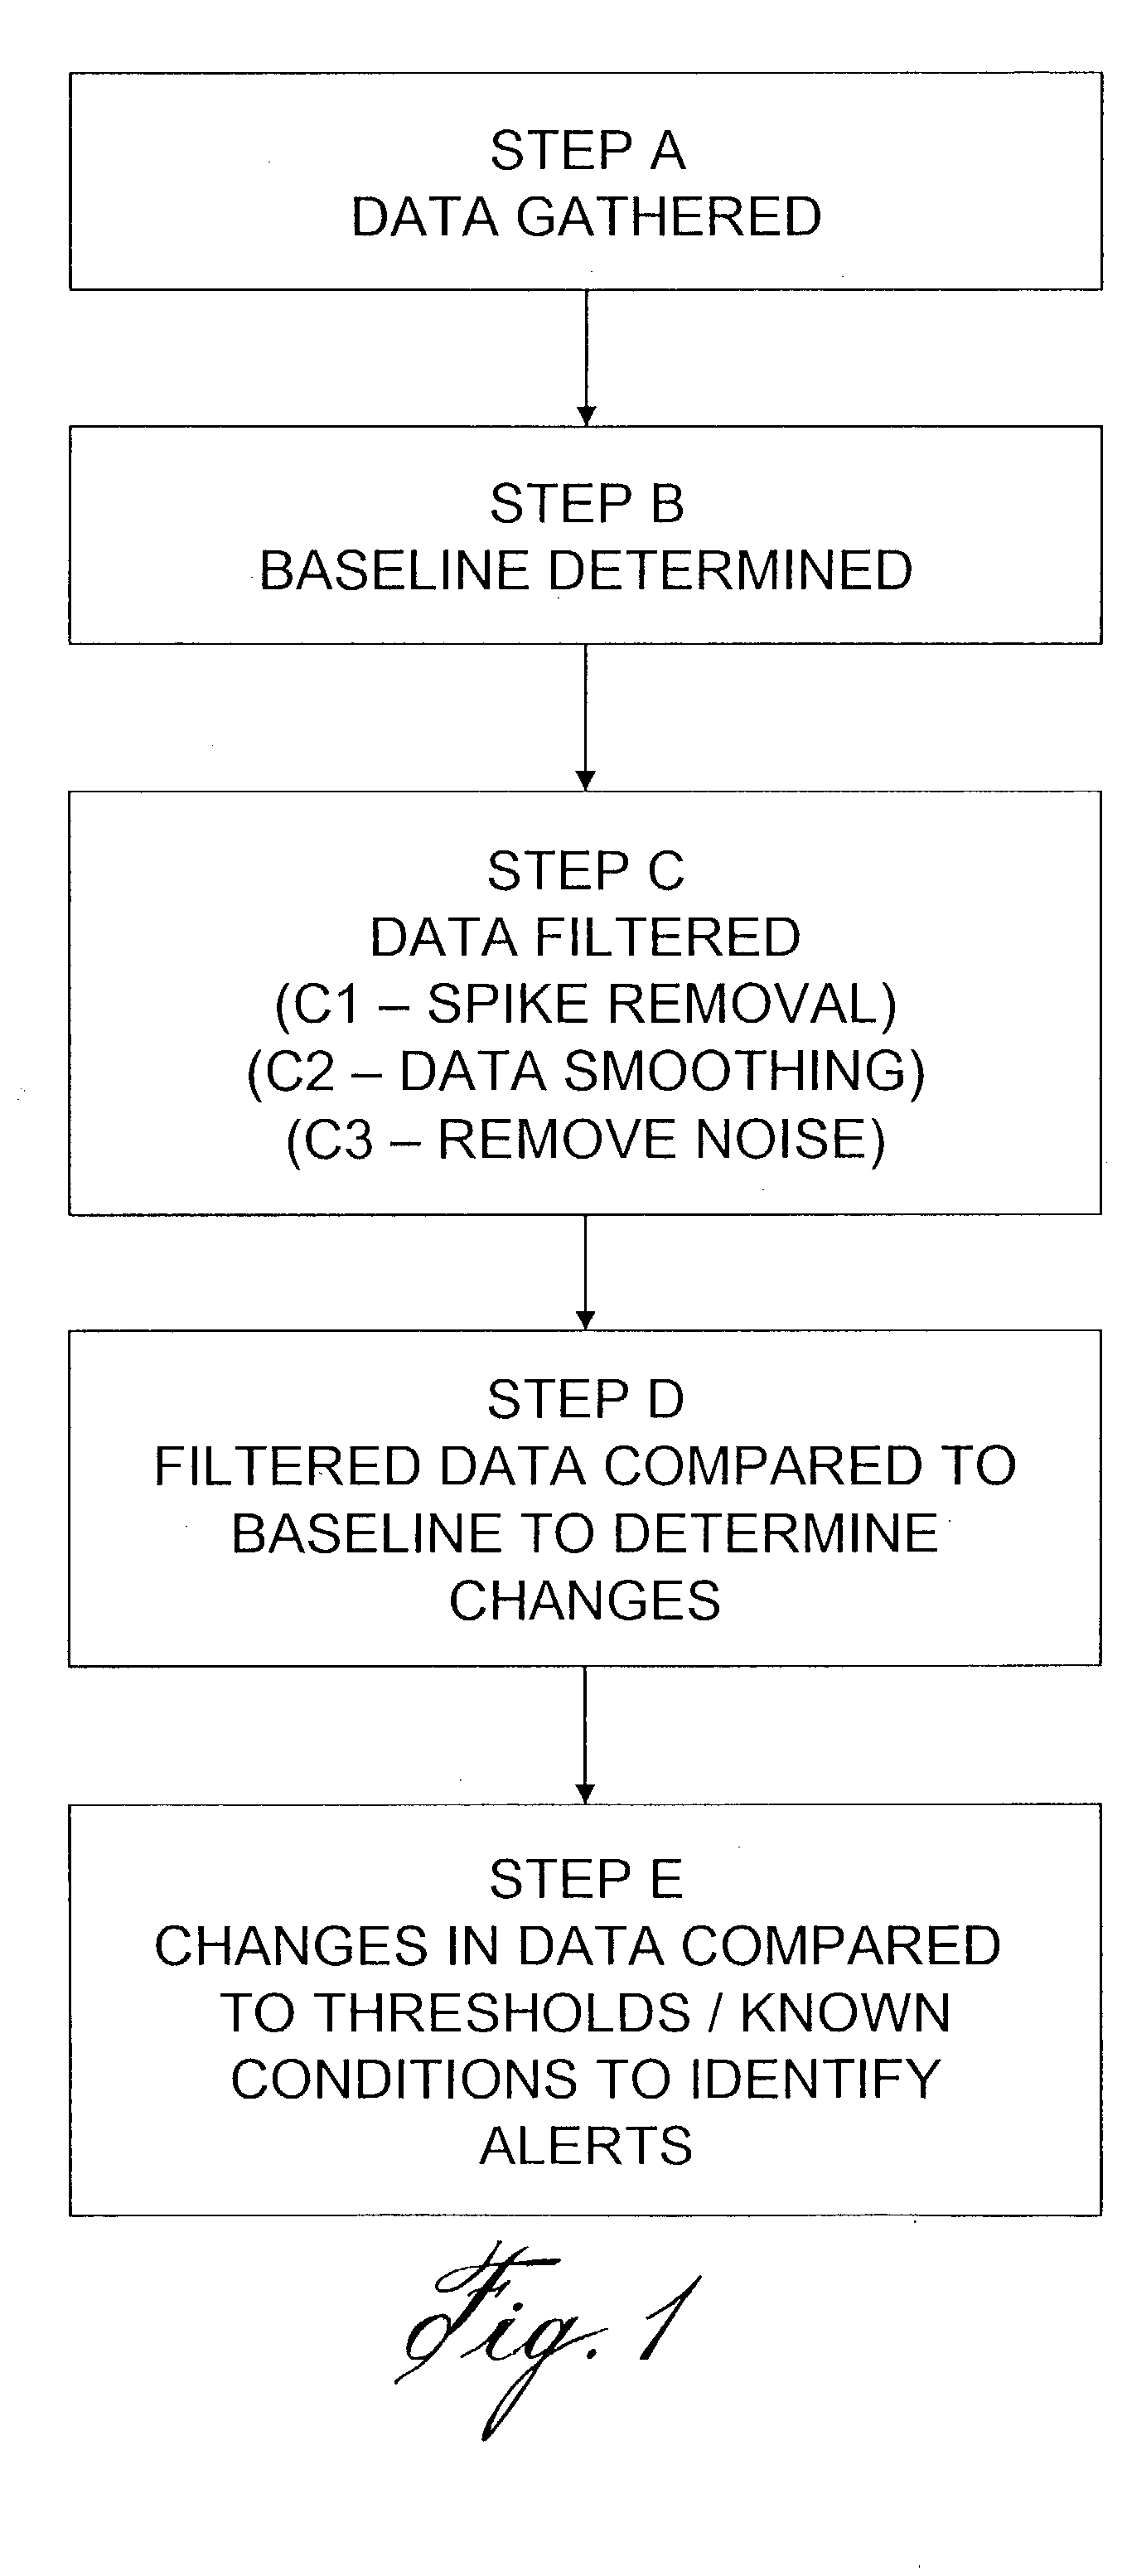
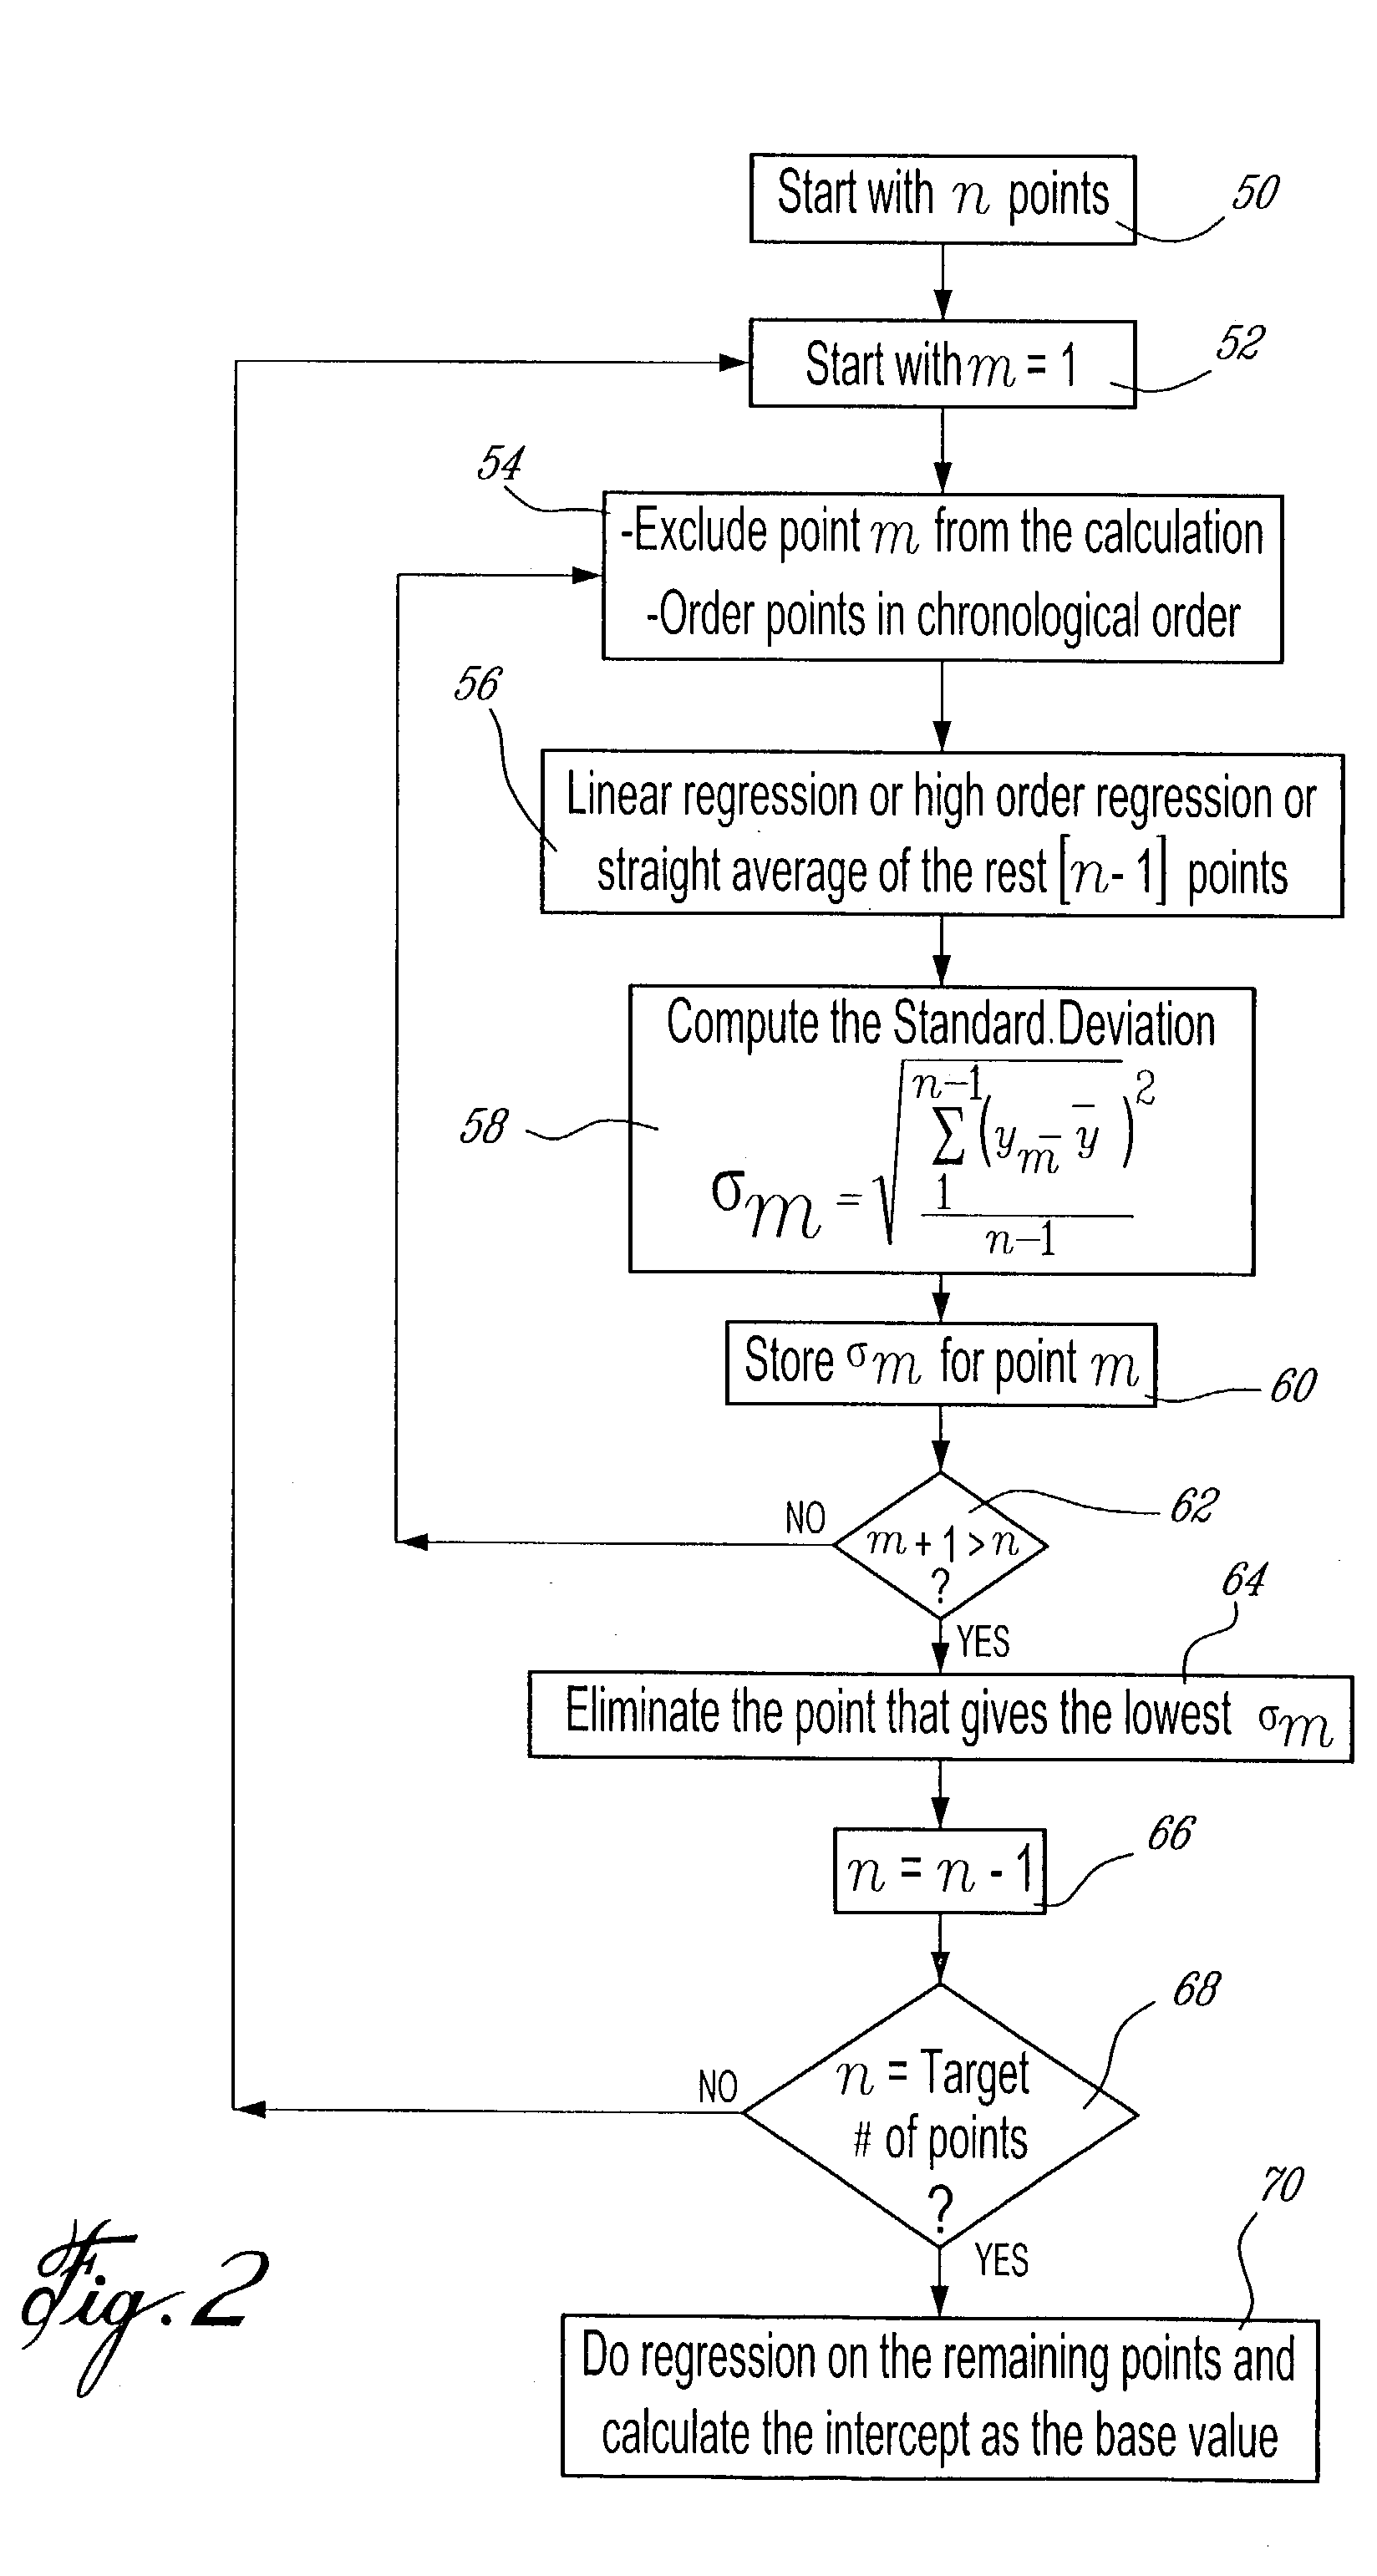
[0030]The described embodiment relates generally to a gas turbine engine performance parameter trend detection and analyzer method and system as depicted in overview in FIG. 1. Each step will be described briefly here, and in more detail below. In Step A, engine performance data is gathered (in any suitable...


PUM


Abstract

A method for comparing a data set to a baseline value comprising: providing the data set to be analyzed; locating potentially bad data points in at least a portion of the data set using an odd-man out recursive technique; preparing a baseline set by discarding the potentially bad data points from the at least a portion of the data set; and calculating a baseline value from the baseline set.

Description

CROSS-REFERENCE TO RELATED APPLICATIONS[0001]The present application claims priority of patent application Ser. No. CA 2,417,074 filed on Jan. 24, 2003 by Applicant.FIELD OF THE INVENTION[0002]The invention relates to a process of trend detection and analysis in data. More specifically, it relates to novel processes for one or more of smoothing a data signal, removing low frequency noise effects, calculating a comparison baseline and detecting trends to identify alert conditions.BACKGROUND OF THE INVENTION[0003]Various conventional computer-based analysis methods are employed to analyze complex data collected from sensors which are monitoring equipment or process operations. In one approach, sensor signal data is compared against stored or predetermined thresholds and, when the data signals exceed the thresholds, an “alert” is automatically generated for notifying a human of the situation. Thus, equipment or process monitoring requires human intervention only when a sensor data exce...

Claims


Application Information

Patent Timeline
Patent Type & Authority Patents(United States)
IPC IPC(8): G06F7/02G05B23/02G06F11/30G06F17/10G06F19/00G06K9/00
CPCG05B23/0221G06K9/00536G06K9/00503G06F2218/02G06F2218/12
Inventor NGUYEN, PHUC LUONGCOLLIN, DENISMATSCHEK, PETER
Owner PRATT & WHITNEY CANADA CORP
Why Eureka
Try Eureka