Fracture monitoring using pressure-frequency analysis

a technology of pressure-frequency analysis and fracture behavior, applied in the direction of survey, instruments, borehole/well accessories, etc., can solve the problems of few techniques that address fracture behavior and the difficulty of the hunt for hydrocarbons

Active Publication Date: 2006-09-05
HALLIBURTON ENERGY SERVICES INC
View PDF12 Cites 46 Cited by
  • Summary
  • Abstract
  • Description
  • Claims
  • Application Information

AI Technical Summary

Benefits of technology

[0010]Certain changes occurring downhole during a fracturing process, such as fracture extension, send different pressure frequency spectra and wave intensities to the surface. In accordance with the present invention, these signals can be processed to reveal information about one or more aspects of the downhole environment. That is, capturing and evaluating generated and reflected pressure waves during fracturing enables personnel to monitor, in real time or later, what happens downhole during fracturing.

Problems solved by technology

Unfortunately, this does not always happen because the fracturing process can damage rather than help the formation (for example, proppant can clog the fracture tip to produce a “screenout” condition).
However, as the hydrocarbon supply decreases and demand for it increases, the hunt for hydrocarbons becomes more challenging.
Many techniques are available for pre-stimulation simulations and post-stimulation analyses of fracture behavior; however, few techniques address fracture behavior during the stimulation process itself.

Method used


Image

  • Fracture monitoring using pressure-frequency analysis
  • Fracture monitoring using pressure-frequency analysis
  • Fracture monitoring using pressure-frequency analysis

Examples


example 1

[0054]Well A was a vertical well that was proppant stimulated through the annulus. This well was about 8,408 feet deep (measured depth / true vertical depth).

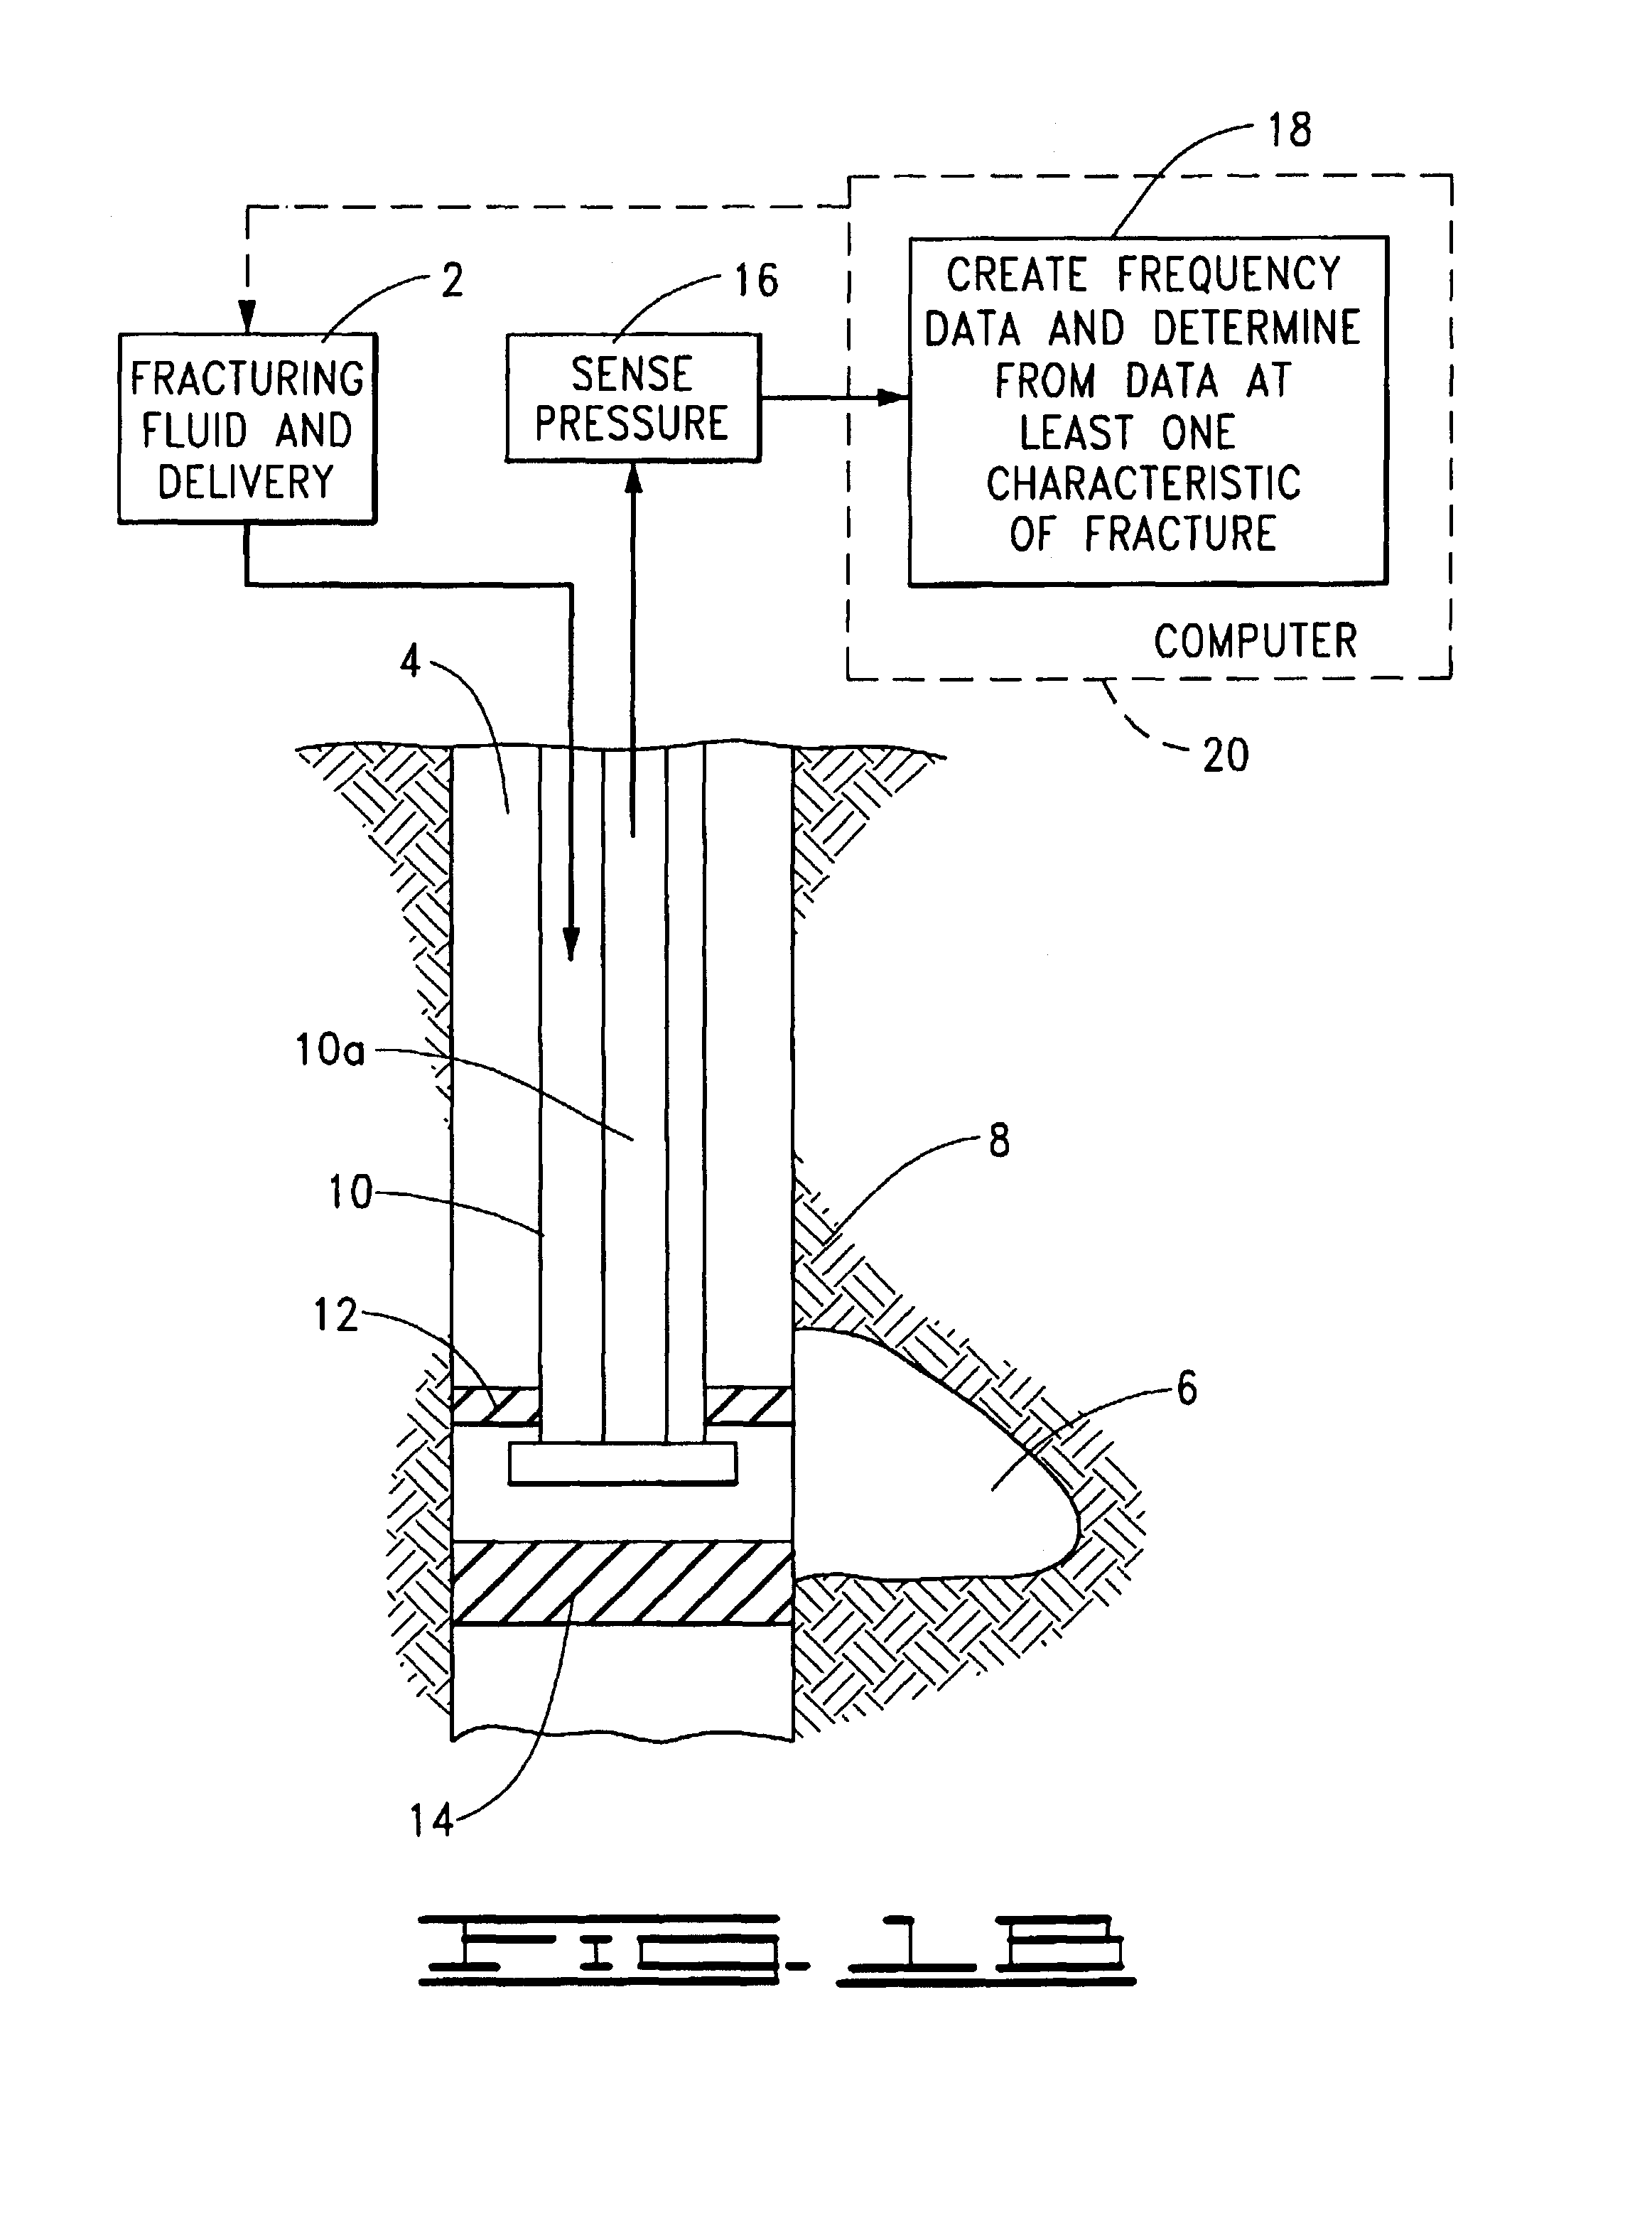
[0055]Using the speed of sound through diesel fluid at about 3,800 feet / second and the equation set forth above, the natural frequency at the wellbore is approximately 0.226 Hz (F=3,800 / (2×8,408)). FIG. 3 shows the waterfall plot of the Fourier transform charts obtained using pressure data for well A sensed through the annulus for an arrangement as in FIG. 1B. Each chart section of FIG. 3 was computed with a 16-second interval between each waterfall element. That is, each curve in the drawing represents one STFT chart of a time slot in time. The wellbore depth / length (natural) frequency component is shown as a straight dotted line 28 in FIG. 3. In this waterfall plot, locations are identified where a certain frequency amplitude exceeds a certain threshold; and the frequency movement or trend is then tracked as time progresses. No...

example 2

[0058]Well B was a vertical well with depth of 6,952 feet and treated using the same manner and same installation as Well A. During this time, the recording equipment was placed in the dead string (tubing) while fracturing was done through the annulus. The stimulation treatment was performed so that a screenout would occur at the end of the job to improve fracture conductivity.

[0059]The STFT stacked chart or waterfall plot obtained as part of the present invention is shown in FIG. 5. The natural frequency related to the wellbore depth and a sound speed of 3,800 feet / second as above can be computed as 0.273 Hz, as illustrated with the dotted line 34. Note that the sound speed changes from fluid to fluid and also is very dependent upon pressure and compressibility. Additionally, the extending of the fracture is clearly represented by this plot (see frequency front; as frequencies get lower), as is a massive screenout at the end of the job (frequency suddenly gets higher prior to the e...

example 3

[0062]Well C was slightly deviated and had a measured depth of about 10,300 feet. Lease crude was used as the primary treatment fluid.

[0063]Using a speed of sound of approximately 4,000 feet / second, a wellbore natural frequency of about 0.2 Hz is obtained. The fracture development can be observed in the Fourier transform chart in FIG. 6, which was created based on the previously obtained pressure data for Well C.

[0064]As busy as FIG. 6 is, confirming what actually happened may be done as shown by the line representing the frequency or wave front as done earlier. However, throughout the plot, there are occasionally high level bursts of noise which seems like white noise (having all frequencies present). To investigate further, wavelets are used. Using wavelet technology, the input signal (here, the pressure data) is decomposed into two sectors, which decomposition occurs in known manner to effectively filter using a selected wavelet function high / low pass filter. Each of these sector...


PUM


Abstract

Changes occurring downhole during a fracturing process can create or reflect pressure signals. Capturing and evaluating such pressure waves during fracturing enables personnel to monitor, in real time or later, what happens downhole. When a fracture extends, a burst of acoustic noise is embodied in a pressure wave or signal, as is noise coming from other sources. By transforming time-based pressure signals to a frequency base, one can monitor this acoustic noise. In a particular implementation, a waterfall plot of frequency spectra at successive time slices of the original signal is used to determine frequency ridges, such as a ridge of decreasing frequencies indicates fracture extension and a ridge of increasing frequencies indicates either closure or proppant backing up in the fracture. Filtering, such as wavelet filtering, can be used. A fracturing process can be controlled in response to determining whether the fracture is extending.

Description

BACKGROUND OF THE INVENTION[0001]This invention relates generally to fracturing subterranean formations and to fracture monitoring methods.[0002]There are various uses for fractures created in subterranean formations. In the oil and gas industry, for example, fractures may be formed in a hydrocarbon-bearing formation to facilitate recovery of oil or gas through a well communicating with the formation.[0003]Fractures can be formed by pumping a fracturing fluid into a well and against a selected surface of a formation intersected by the well. Pumping occurs such that a sufficient hydraulic pressure is applied against the formation to break or separate the earthen material to initiate a fracture in the formation.[0004]A fracture typically has a narrow opening that extends laterally from the well. To prevent such opening from closing too much when the fracturing fluid pressure is relieved, the fracturing fluid typically carries a granular or particulate material, referred to as “sand” o...

Claims


Application Information

Patent Timeline
Patent Type & Authority Patents(United States)
IPC IPC(8): E21B49/00E21B47/10E21B43/26G01V1/50
CPCG01V1/50E21B43/26E21B49/00
Inventor STEPHENSON, STANLEY V.SURJAATMADJA, JIM B.
Owner HALLIBURTON ENERGY SERVICES INC
Why Eureka
Try Eureka