Method and apparatus for optical signal and noise analysis using pulse amplitude histogram

a pulse amplitude and optical signal technology, applied in the field of optical communication systems, can solve the problems of excessive crosstalk or nonlinear optical pulse distortion of signals, high cost of optical signal analysis, and low cost efficiency of optical communication system, so as to improve the cost effectiveness of optical communication system and reduce the monitoring of cost performance

Inactive Publication Date: 2006-12-05
XIEON NETWORKS SARL
View PDF3 Cites 6 Cited by
  • Summary
  • Abstract
  • Description
  • Claims
  • Application Information

AI Technical Summary

Benefits of technology

[0008]In accordance with the present invention, a method and apparatus for performance monitoring in optical communications systems is disclosed. The disclosed method and apparatus do not require the use of optical spectrum analyzers (OSAs) or other expensive test components, and therefore provide for reduced cost performance monitoring and concomitant improvement in the cost effectiveness of optical communications systems.
[0012]Apparatus for the disclosed technique is generally sufficiently inexpensive that it can be deployed as necessary in an optical communications system without contributing to overall system cost to nearly the same degree as do OSAs, for example. The disclosed apparatus includes a processor for performing calculations and overall control; a circuit such as a digital to analog converter for establishing a voltage threshold under control of the processor; a decision circuit for comparing the threshold to an electrical version of the optical communications signal obtained by optical-to-electrical conversion; and a counter for sampling the output of the decision circuit and counting samples having a predetermined value. The components that make up the disclosed system are all readily available at relatively low cost. Additionally, the disclosed apparatus can be used in conjunction with a tunable filter to enable one circuit to monitor some or all of the optical communications signals constituting a WDM signal.

Problems solved by technology

Due to the close spacing of many signals, there is a relatively high potential for signals to suffer excessive crosstalk or nonlinear optical pulse distortion, and other deleterious effects.
OSAs are also very expensive.
Optical sampling oscilloscopes are also very expensive.

Method used


Image

  • Method and apparatus for optical signal and noise analysis using pulse amplitude histogram
  • Method and apparatus for optical signal and noise analysis using pulse amplitude histogram
  • Method and apparatus for optical signal and noise analysis using pulse amplitude histogram

Examples


Embodiment Construction

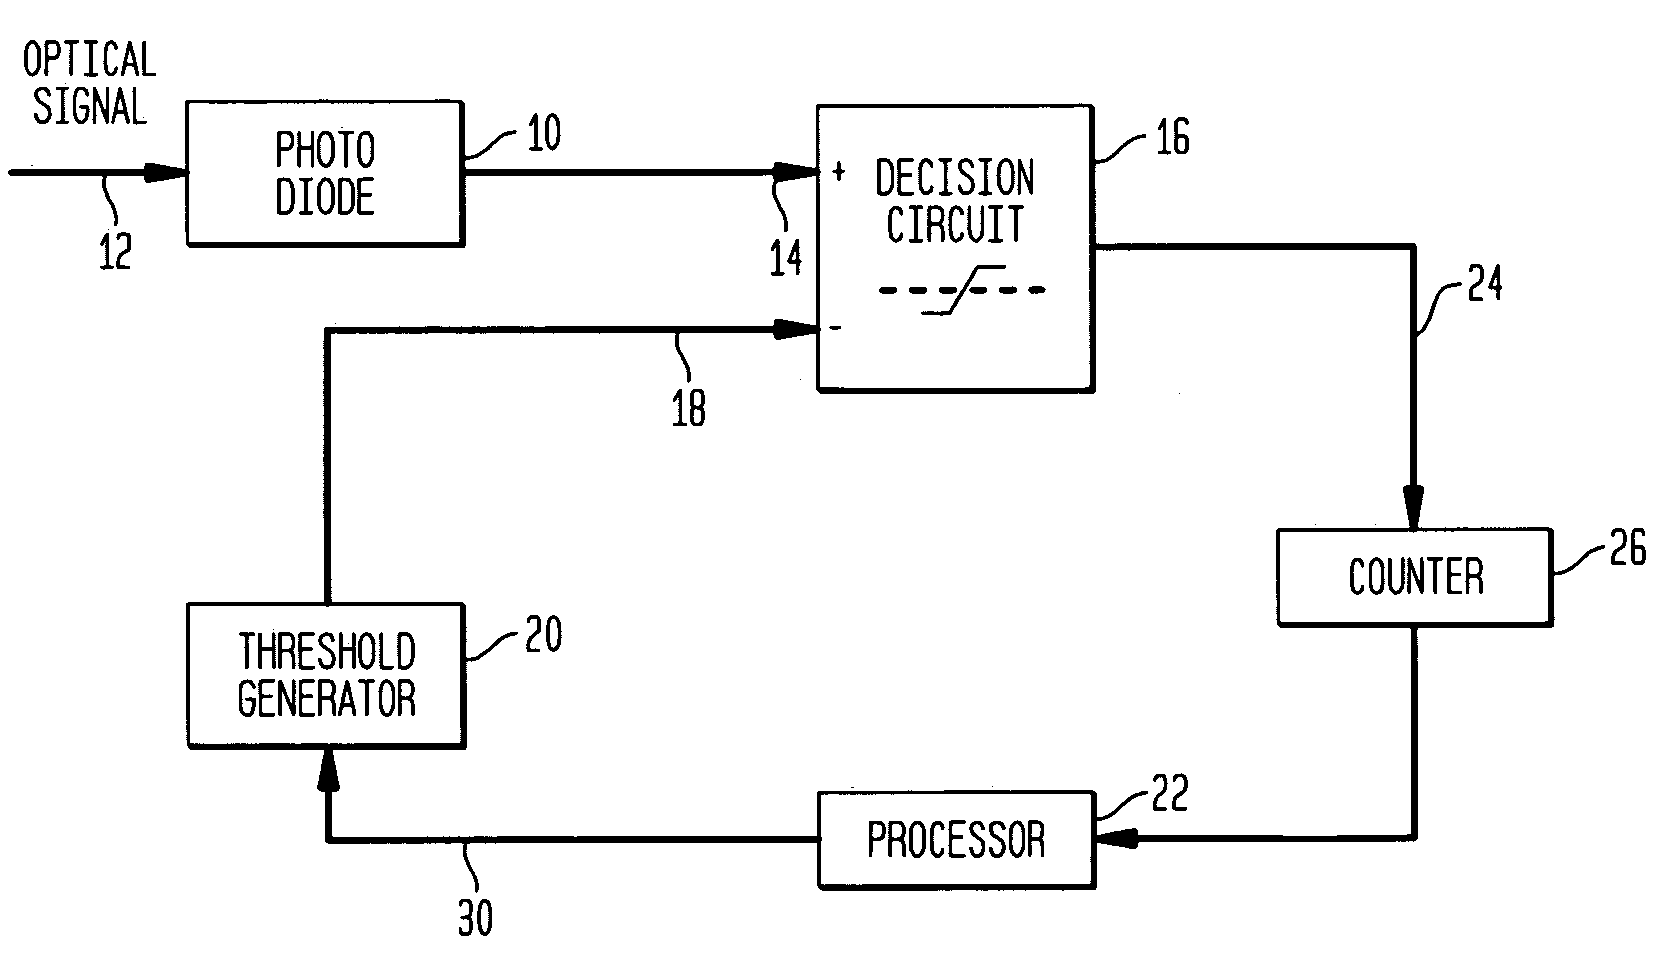
[0019]FIG. 1 shows a probability density function (PDF) for the amplitude of an optical signal at a receiver in an optical communications system. The PDF indicates the relative occurrence rates for signal amplitudes with a given range in a certain operating environment. The plot of FIG. 1, for example, which was obtained with synchronous sampling using an optical sampling oscilloscope, depicts a distribution of signal amplitudes that might be expected on an OC-192 link with an optical signal-to-noise ratio (OSNR) of 17 dB. In an ideal communications link with no noise, the plot would have only two non-zero points—one corresponding to the logic “0” amplitude and another corresponding to the logic “1” amplitude. The existence of relatively narrow curved regions around these two amplitudes in FIG. 1 is due, among other things, to the effects of noise.

[0020]A plot such as FIG. 1 can be used to derive certain attributes of an optical communications signal. If V1 and V0 are taken to be th...


PUM


Abstract

In a method of analyzing an optical communications signal, a threshold is established under control of a processor, and a decision circuit compares the amplitude of the signal to the threshold. A counter samples the output of the decision circuit and counts, over many periods of the signal, those samples indicating that the amplitude of the signal is above the threshold. The threshold generating, comparing, and counting are repeated for several thresholds within a range corresponding to an expected amplitude range of the signal. The stored counts and thresholds represent an amplitude histogram N(VT) for the signal. The derivative dN / dVT of the function N(VT) represents the probability density function (PDF) for the signal amplitude and can be used to derive performance information such as bit error rate and optical signal-to-noise ratio (OSNR).

Description

CROSS REFERENCE TO RELATED APPLICATIONS[0001]NoneStatement Regarding Federally Sponsored Research or Development[0002]Not ApplicableBACKGROUND OF THE INVENTION[0003]The present invention is related to optical communications systems.[0004]There is a general need in optical communications systems for a function referred to as, “performance monitoring”. Performance monitoring generally involves monitoring the quality of optical communications signals at various points in a system to identify signals whose characteristics indicate the need to take some kind of corrective action. Examples of such monitored signal characteristics include signal power, optical signal-to-noise ratio (OSNR), and bit error rate. Corrective actions that can be taken include adjusting transmitter power to improve signal power or OSNR, adjusting or replacing optical filters that may be contributing to noise or excessive signal attenuation, replacing or repairing faulty connections, etc. The need for performance ...

Claims


Application Information

Patent Timeline
Patent Type & Authority Patents(United States)
IPC IPC(8): H04B10/08H04B17/00H04B10/02H04J14/02
CPCH04B10/07953H04J14/02
Inventor KAMALOV, VALEY F.NEUDECKER, ALBRECHT
Owner XIEON NETWORKS SARL
Why Eureka
Try Eureka