
Inferred production rates of a rod pumped well from surface and pump card information

a production rate and information technology, applied in the field of oilfield equipment for monitoring and controlling wells, can solve the problems of tubing leakage, low production rate, wear of down hole pumps, etc., and achieve the effect of high accuracy and high production ra

Active Publication Date: 2007-05-01
RAVDOS HLDG INC
View PDF3 Cites 48 Cited by
  • Summary
  • Abstract
  • Description
  • Claims
  • Application Information

AI Technical Summary

Benefits of technology

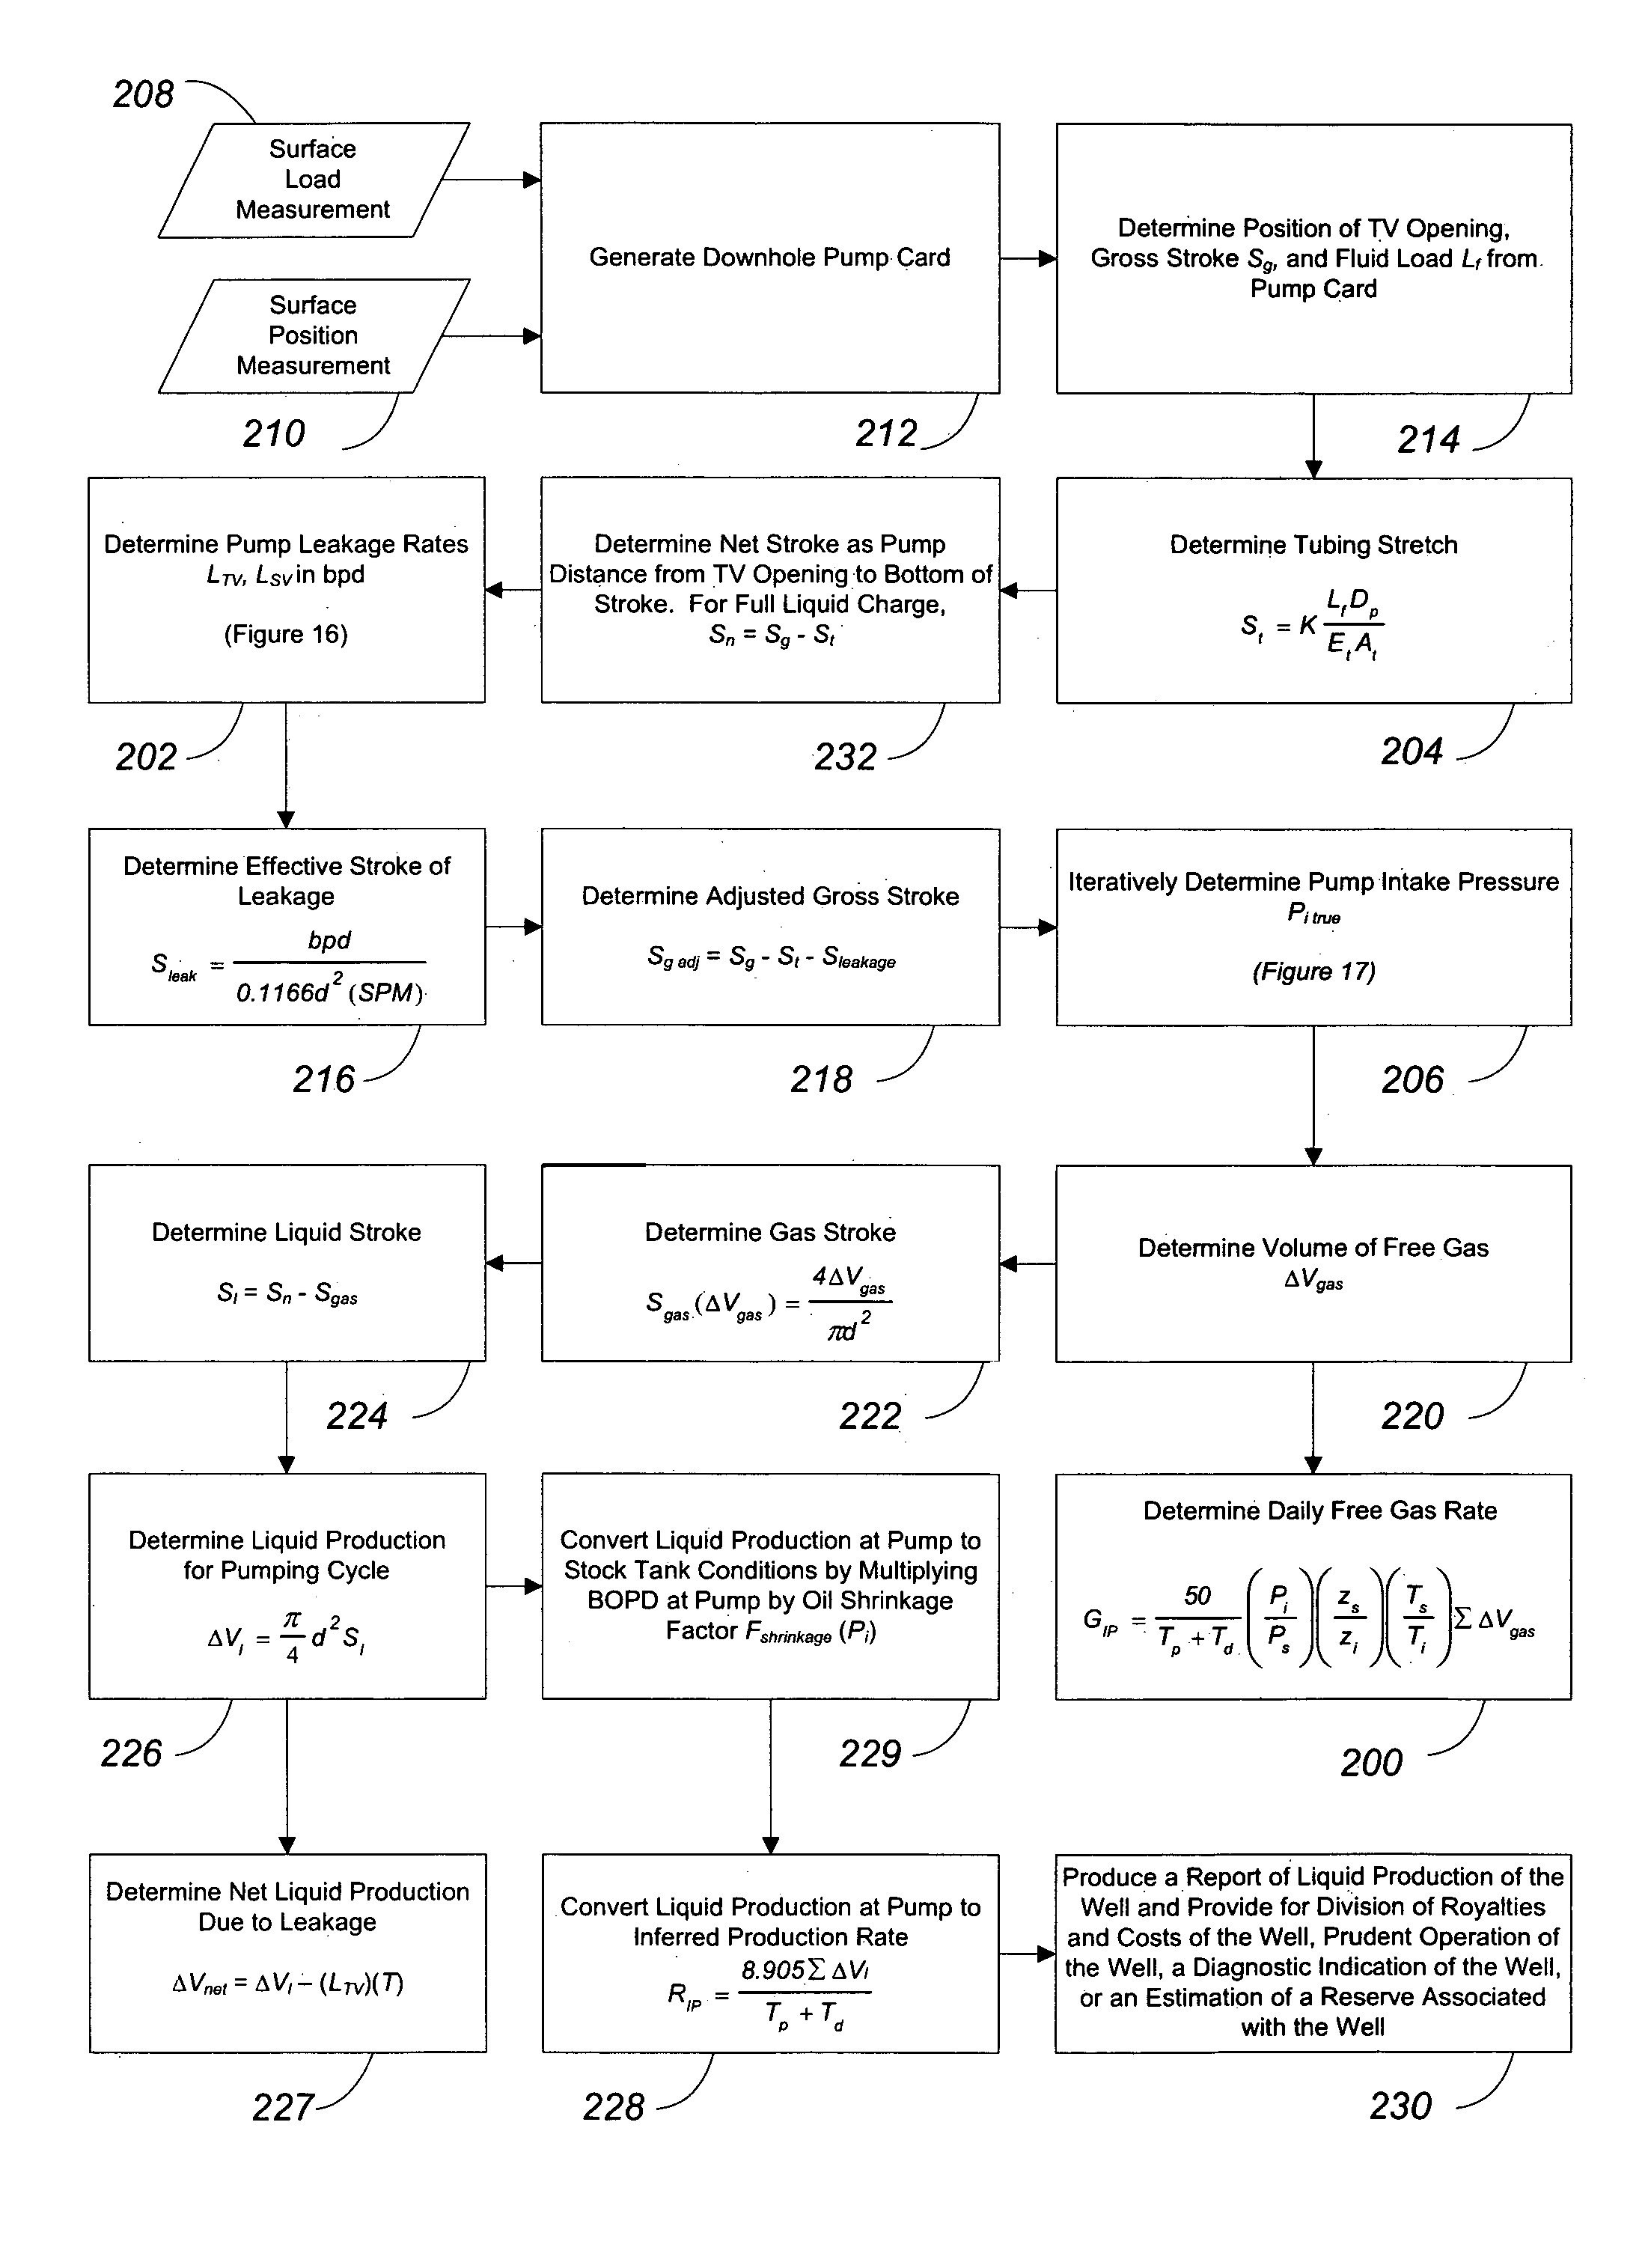
[0076]Another object of the invention is to entirely eliminate traditional well tests for a rod pumped well by inferring liquid and gas production with high accuracy with a Well Manager Unit in combination with a rod pumping unit.
[0077]Another object of the invention is to remove limiting assumptions of negligible pump leakage, anchored tubing, negligible free gas and negligible oil shrinkage effects from prior art methods of inferring production when using a well manager with a rod pumping unit.

Problems solved by technology

A decline in production rate compared with a previous test can indicate a mechanical problem.
The down hole pump may be worn or a tubing leak may have developed.
This may have resulted in a producing pressure decline and a decrease in production rate.
The production test is a good tool for sensing that a change in the well has occurred, but it does not pinpoint the exact reason for the change.
Because different causes may lead to the same effect, ambiguity exists.
For example, a production decrease can have any number of causes such as a worn pump, a tubing leak, a failed tubing anchor, the onset of free gas production, secondary recovery deficiency, etc.
Meter malfunction is a significant problem for traditional production tests.
In addition, the well test can be wrong even when the meters are working perfectly.
Actual production is normally much lower than the test, primarily because of down time for equipment failures or other reasons.
In principle, downtime is noted and accounted for, but down time measurement accuracy is poor.
Downtime is often neglected entirely.
Trial and error searches with the service rig (pulling unit) can also be used, but these searches are more costly to perform.
Trial and error solutions require more time, and revenue is lost before the problem is identified.
Like the production test, a fluid level instrument is not capable of identifying the specific cause for a change.
The measured pump card had to be retrieved by a costly process of pulling the rods and pump.
However when a group of pumping wells is already under SCADA surveillance, IP is interfaced with SCADA for unattended telemetry of inferred production to a central collection point.
This causes errors in inferred production, particularly in wells where pump fillage varies rapidly.
This decreases the time lag between discovery and remediation of problems that affect production.
But when any of the basic assumptions above are not correct, the accuracy of the IP method decreases.
This factor accounts for the fact that the fundamental assumptions above are not always correct.
One disadvantage is that it is not constant.
Most significant of all, it would not be possible to compute the k factor if the traditional well test were to be entirely eliminated in favor of Inferred Production methods (see eq.

Method used


Image

  • Inferred production rates of a rod pumped well from surface and pump card information
  • Inferred production rates of a rod pumped well from surface and pump card information
  • Inferred production rates of a rod pumped well from surface and pump card information

Examples


example 1

[0155]This illustration is taken from an actual well in West Texas

[0156]A new production test of 400 BFPD (35 BOPD plus 365 BWPD) was obtained on a well having a Well Manager System with an Inferred Production IP System. In a manual mode, IP indicated a production rate of 524 BFPD based on a previously determined k factor of 0.9. The difference of 124 BPD had to be explained. WM indicated that the well pumps continually, i.e. does not pump off. The dynamometer data used by WM for control was exported to a program named DIAG for extracting information from the pump card. The pump card 570 re-created by DIAG is shown in FIG. 9A which also shows the surface card 572. FIG. 9B shows the velocity plot 574 corresponding to the pump card 570. The pump card method (described above) was used to compute pump leakage. Evidence of leakage is present on the pump card 570, i.e. delayed load pickup and premature load release. Eq. 7 indicates that TV / plunger leakage is 64 BPD as follows

LTV=6.99d2CpV...

example 2

[0166]The previous example shows, among other things, the uncertainties caused by an inaccurate well test and a severely worn pump. This example shows how the prior IP system can be improved for a gassy well with a good oil cut and a high pump intake pressure.

[0167]FIG. 10A shows the pump dynamometer card 580 and surface card 582 of such a well that is producing full-time. FIG. 10B shows a velocity plot 584 corresponding to pump card 580. Table I presented below for this example 2 is a PIP program analysis showing additional information that is available to IP according to the invention when the PIP program runs automatically in WM. The following accounting shows how the prior art IP system (unadjusted with a k factor) deals with the well.[0168]Gross pump capacity: 457 BPD (from the pump card)[0169]Net liquid (oil plus water): 395 BPD (from the pump card and Assumption 3, Sn=110.7[0170]Free gas production: 62 BPD (by difference or eq. 4 extended to 24 hours).

Based on a reported well...


PUM


Abstract

A method for inferring production of a rod pumped well. Inferred production is estimated in a well manager which not only performs pump-off control with a down-hole pump card, but also estimates liquid (oil-water) and gas production using the subsurface pump as a meter. Methods are incorporated in the well manager for identifying and quantifying several conditions: pump leakage, unanchored tubing, free gas and oil shrinkage. Quantifying such conditions in the well manger enables accurate inferring of production thereby eliminating the need for traditional well tests.

Description

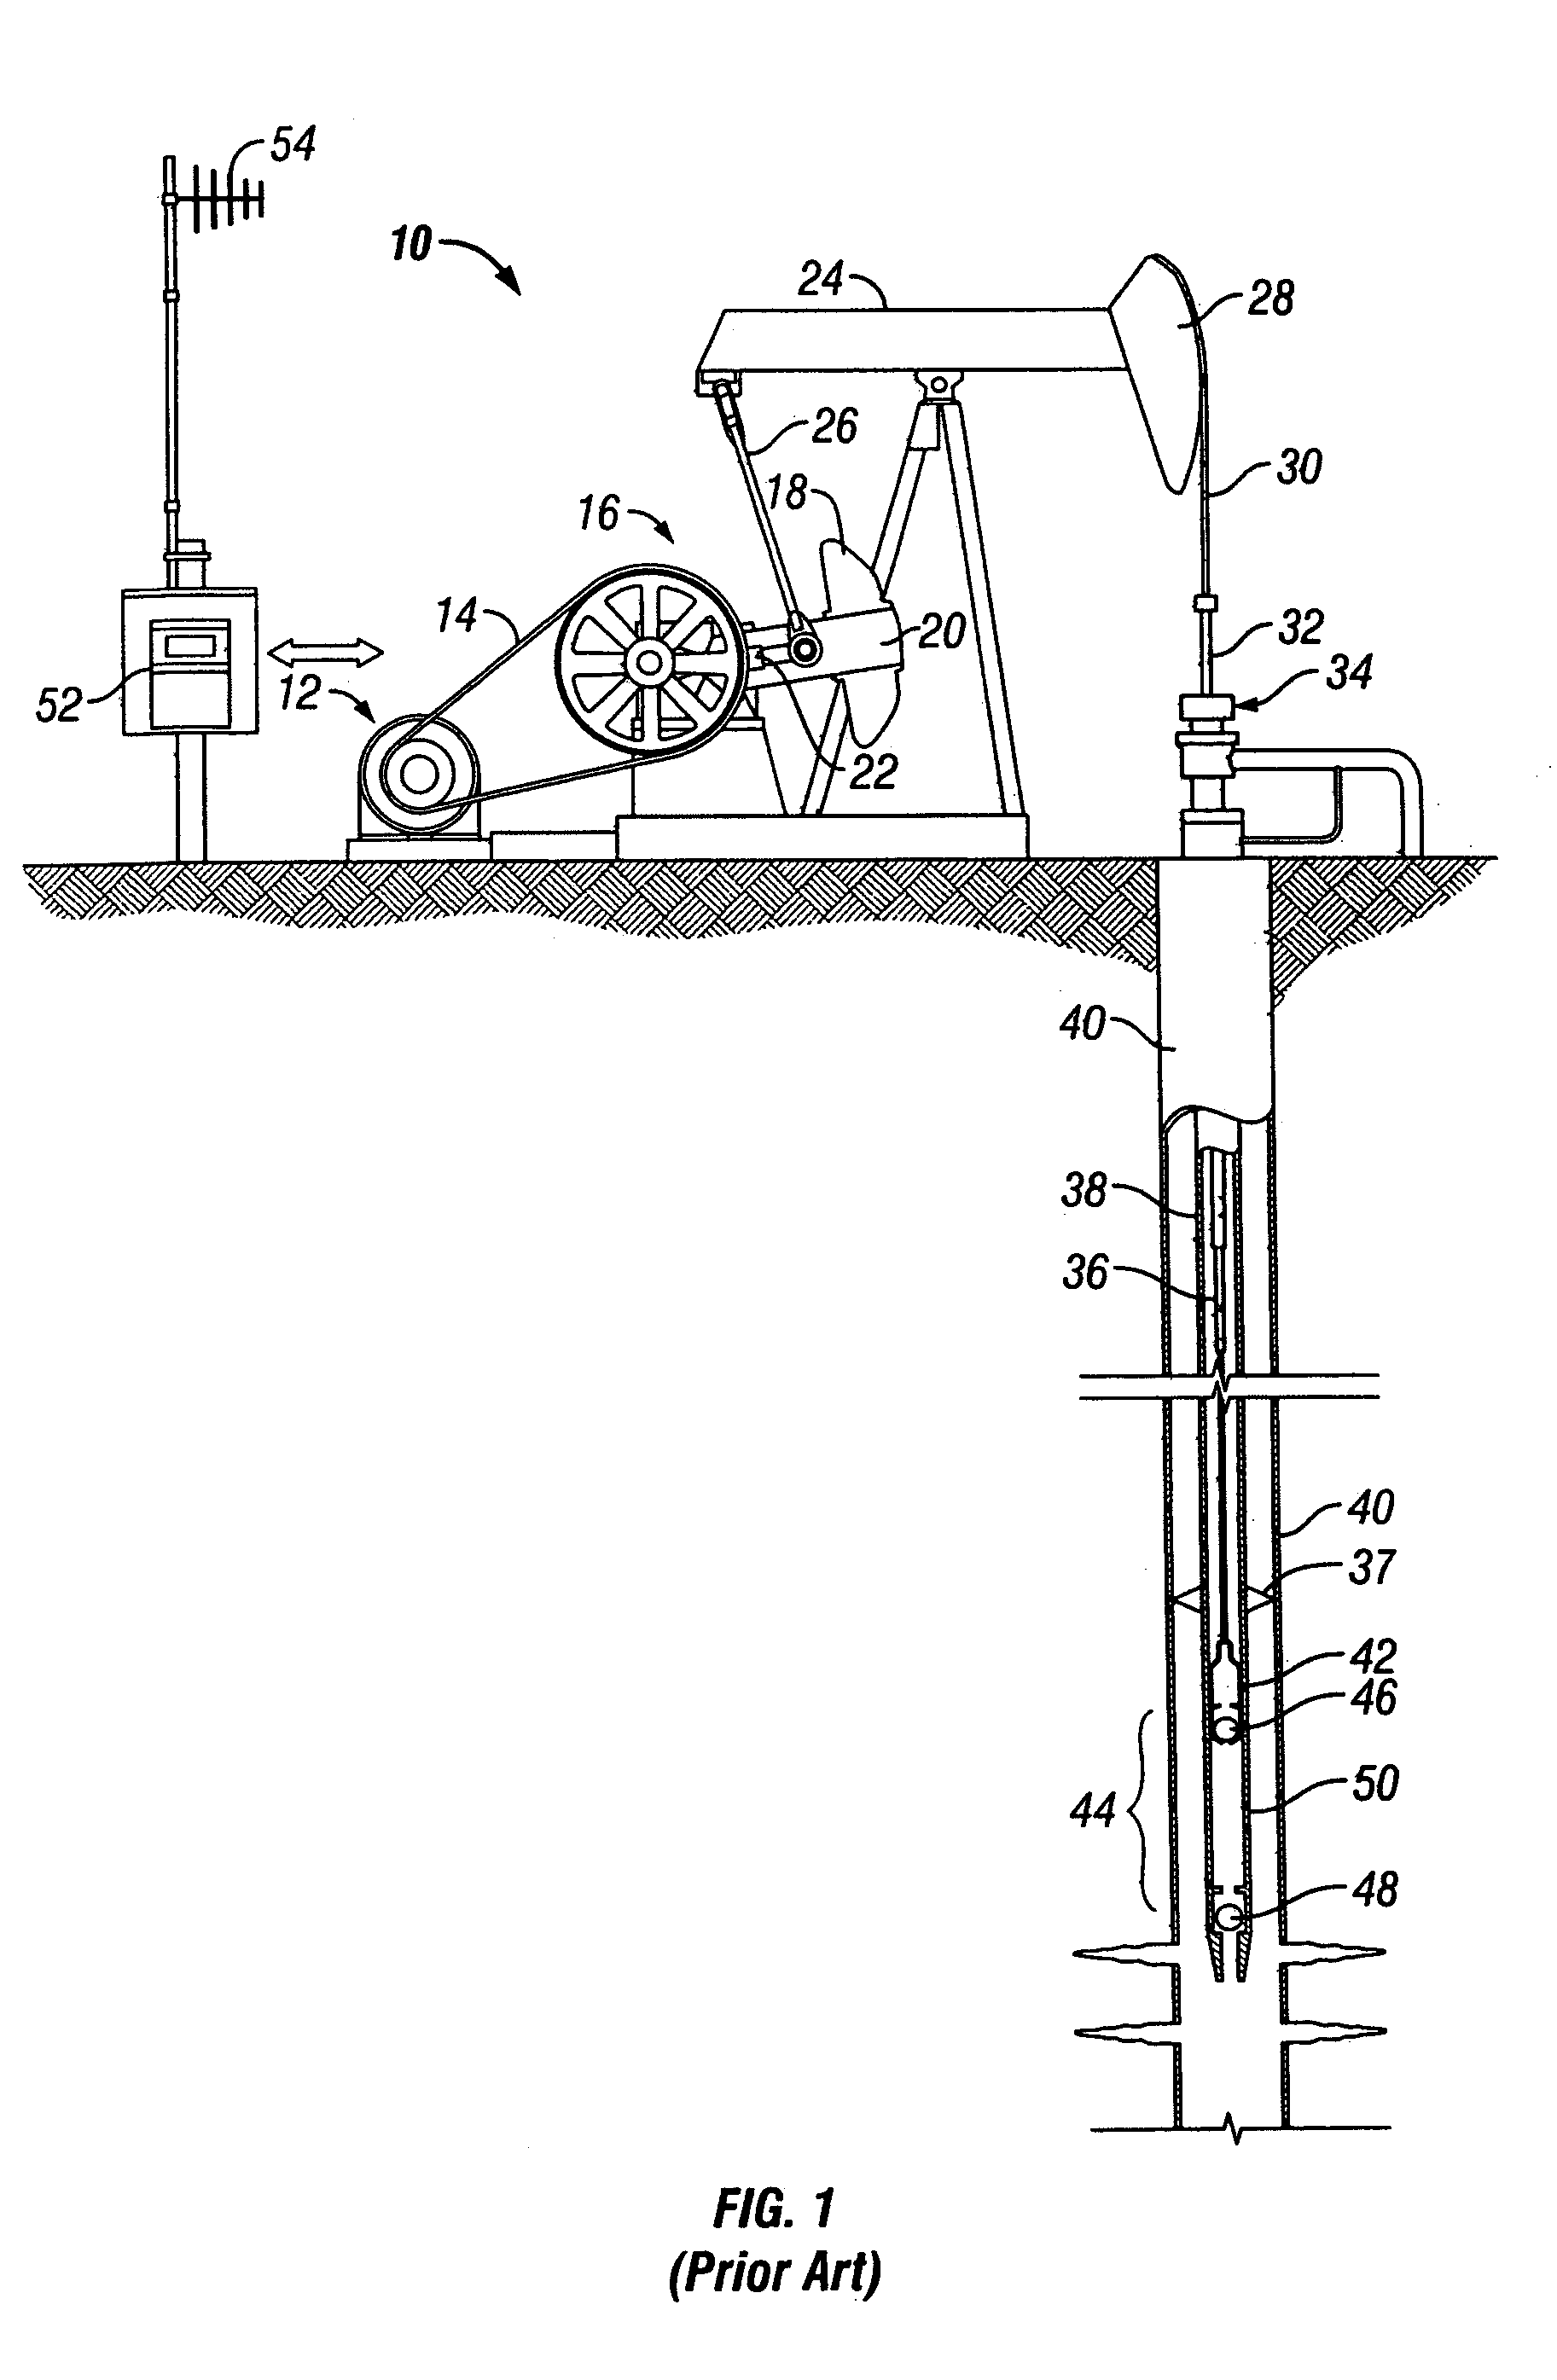
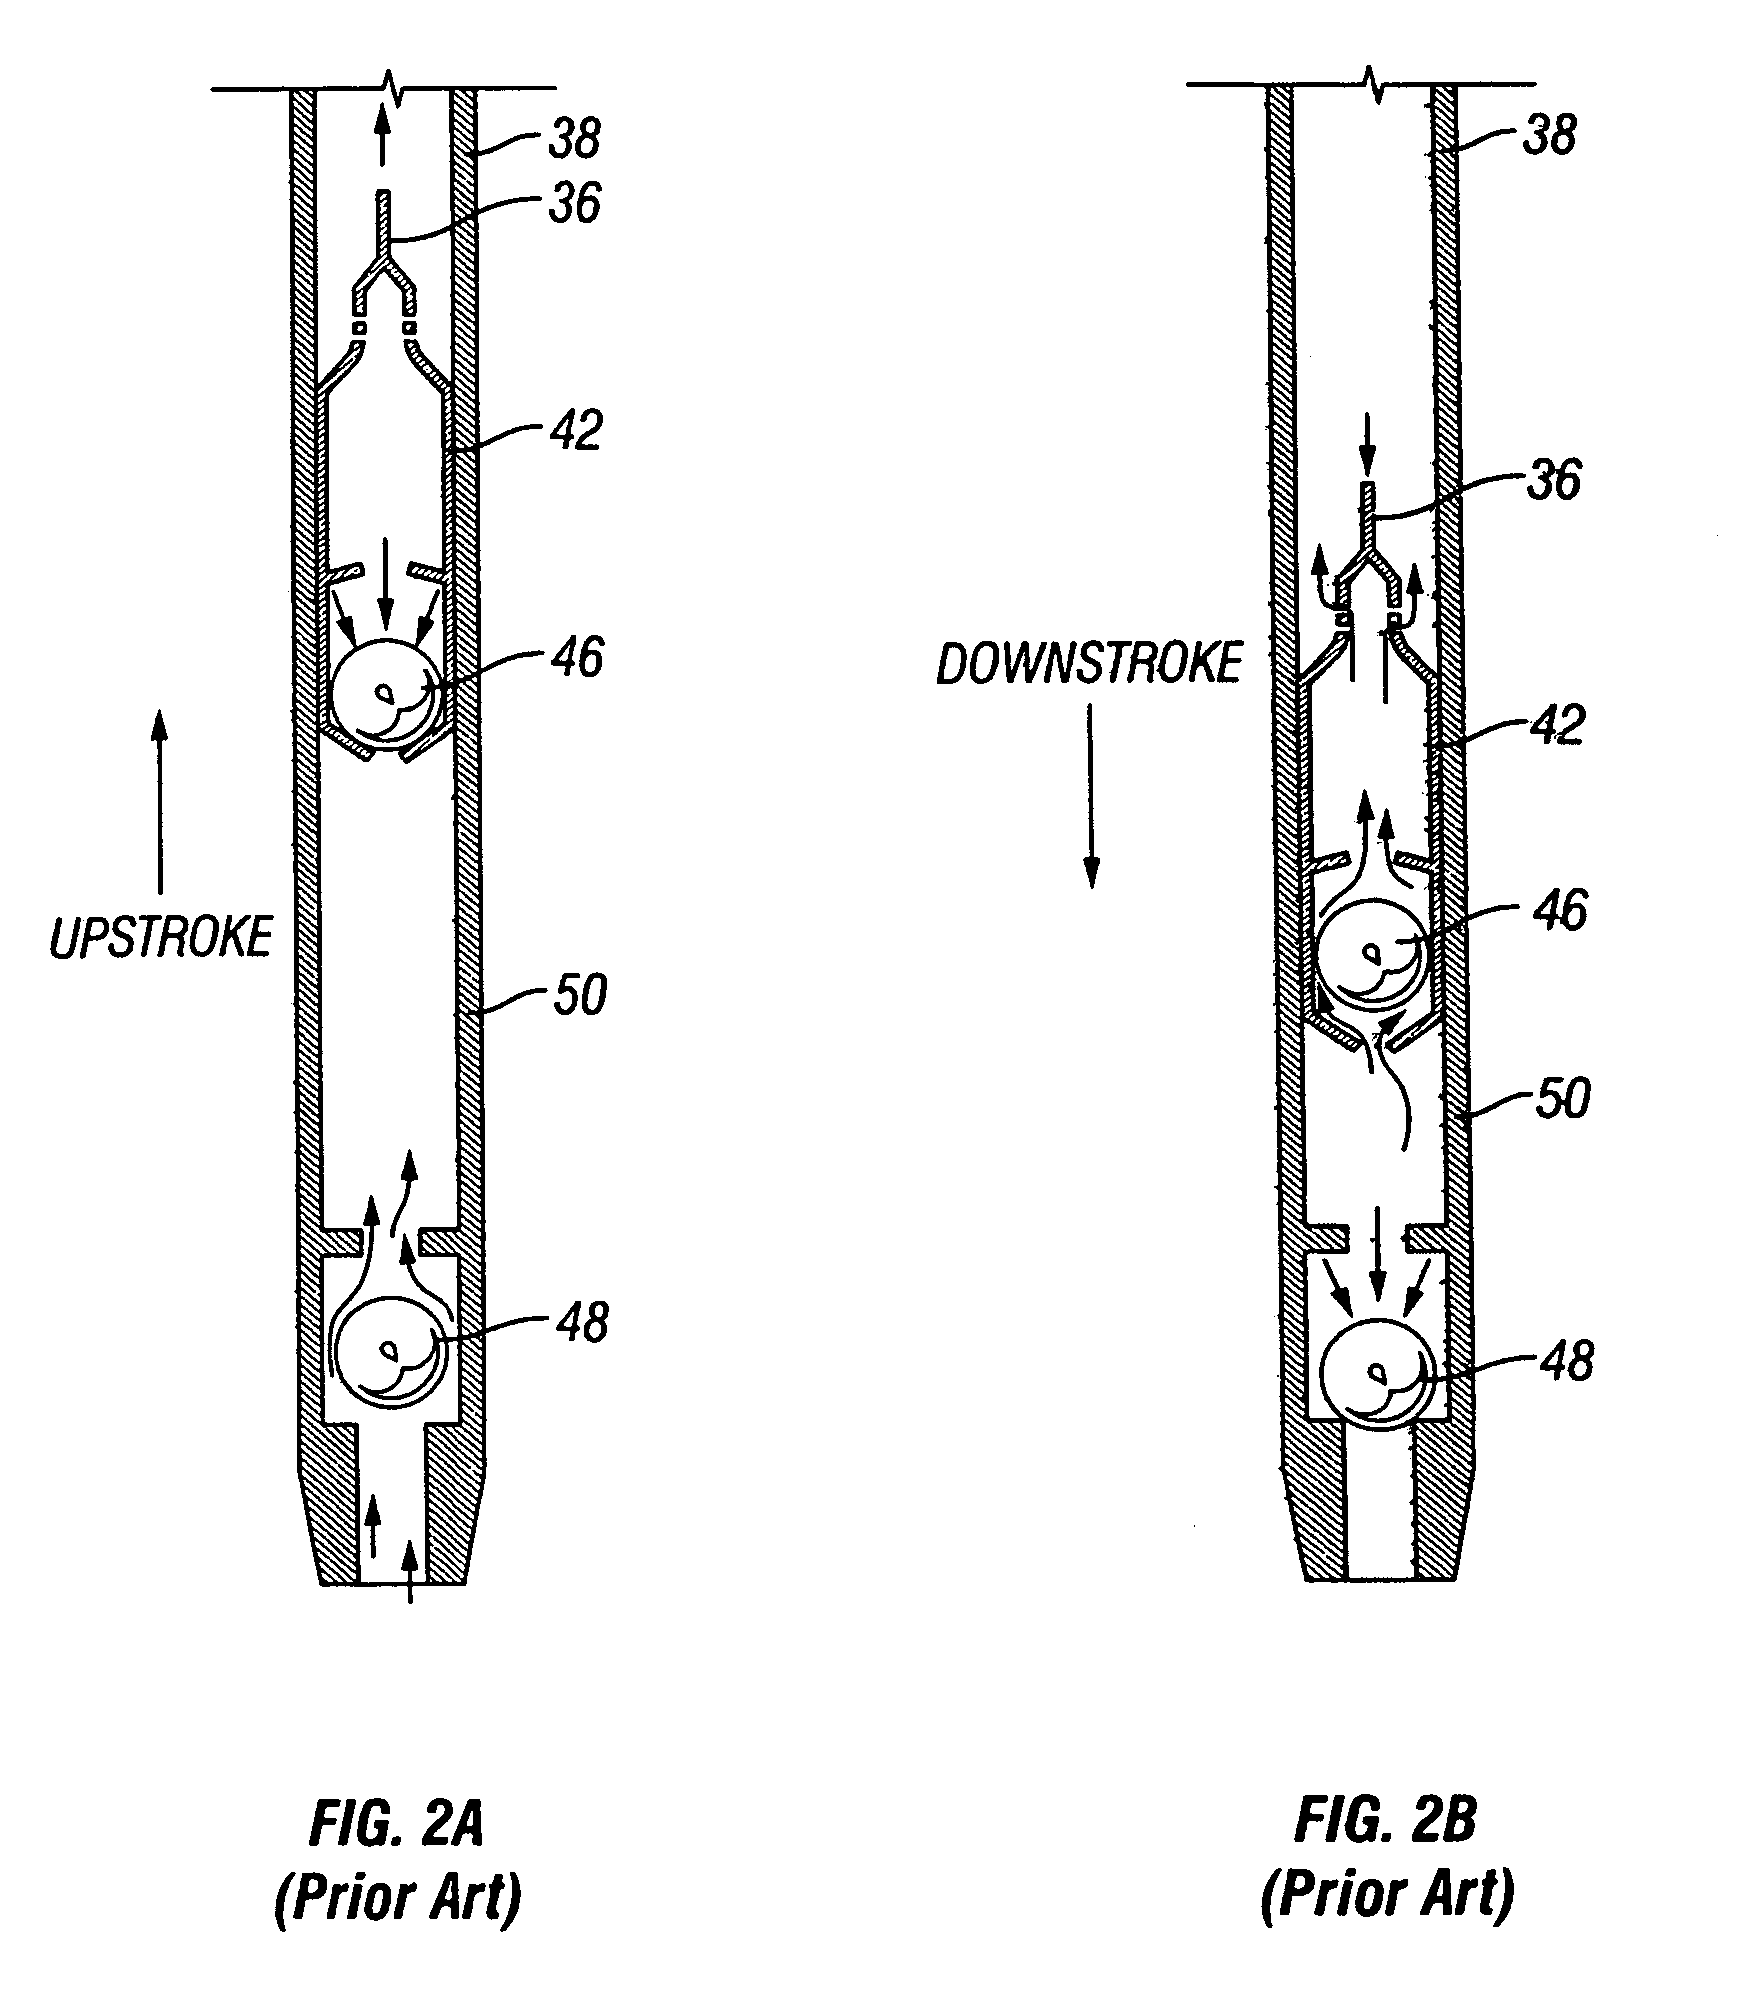
BACKGROUND OF THE INVENTION[0001]1. Field of the Invention[0002]This invention relates generally to oilfield equipment for monitoring and controlling wells that are produced by rod pumping where subsurface fluid pumps are driven via a rod string which is reciprocated by a pumping, unit located at the surface. The pumping unit may be of the predominate beam type or any other type that reciprocates the rod string.[0003]In particular, this invention concerns using a down hole dynagraph, i.e., a pump card, with information as to the size of the down hole pump, to infer automatically the hydrocarbon production of the well.[0004]Still more particularly, the invention concerns methods for use in a Well Monitor Controller where surface and pump cards are produced, whereby traditional well tests of a producing well can be eliminated.[0005]2. Description of the Prior Art[0006]Traditional Production Testing[0007]A production test is a time-honored procedure in oil producing operations. It is i...

Claims


Application Information

Patent Timeline
Patent Type & Authority Patents(United States)
IPC IPC(8): G01V9/00
CPCE21B47/0008E21B47/009
Inventor GIBBS, SAM G.NOLEN, KENNETH B.
Owner RAVDOS HLDG INC
Learn More