System and method of monitoring and quantifying performance of an automated manufacturing facility

a manufacturing facility and automated technology, applied in the field of monitoring and managing the performance of automated manufacturing facilities, can solve the problems of affecting the overall throughput of the manufacturing process, affecting the throughput of the facility, and affecting the product flow

Active Publication Date: 2008-05-27
APTEAN INC
View PDF18 Cites 84 Cited by
  • Summary
  • Abstract
  • Description
  • Claims
  • Application Information

AI Technical Summary

Benefits of technology

[0007]The present invention relates to a system and method for identifying and quantifying constraints in an automated manufacturing or processing facility. The facility has a number of automated workstations. A data processing system continuously receives basic event and state signals from automation equipment in the facility and evaluates and processes these signals to derive a throughput capability measure (a measure of constraint) of each given manufacturing workstation in the process. The automated collection of signals may be further augmented by manually entered information relating to a workstation's performance. The throughput capability measure is expressed as a ratio of an ideal cycle time to an accumulated time that includes any delays or overcycles at a workstation but excludes any speed-up at the workstation. A workstation experiences a speed-up if it processes a workpiece in less than the ideal cycle time. The throughput capability measures of all workstations are analyzed to identify the constraints in the facility.

Problems solved by technology

Workstations not operating at their expected production rate generally constrain product flow and affects overall throughput of the manufacturing process.
It is Generally believed that throughput of the facility is limited by its constraints, namely, workstations causing relatively most significant disruption to the production or workflow of the facility.
Continuous improvement efforts will likely be hindered if one is unable to determine the constraints in an automated manufacturing facility.
Locating the constraints, however, is not an easy task.
In a sequential production line, slowdown at any one of the workstations often causes a ripple effect that spreads both upstream and downstream from the source.
“Slow cycles”, or losses due to a workstation running at a slower than the expected pace, can be one of the contributing factors to the slowdown of a production line.
There may also be quality defects, causing processed workpieces being discarded, thus creating gaps in the workflow.
Of course, there can always be downtime losses at each workstation, which not only affects the performance at the workstation in question but also creates starved conditions downstream and blocked conditions upstream.
As a result, these bottlenecks and quality issues can ripple through the sequential production line and they tend to mask the source of constraints.
For example, a workstation may be idle and appear to be causing performance issues but only because it is starved or blocked due to problems upstream or downstream.
Typical approaches to solving the problem of improving performance or productivity in a manufacturing environment generally do not deploy methods of identifying constraints.
These metrics, while providing an indication of the overall performance of a plant, generally do not provide satisfactory guidance as to where a problem may have originated and therefore assist management in locating specific workstations where corrective measures may be required.
Unfortunately, often a user is left to interpret this increased amount of data to try to identify where constraints in the manufacturing process exist.
Because of the complexity of the data and the concurrency of information, this often is difficult.
Additionally, there are also disadvantages generally associated with collecting and interpreting a large amount of data, which will only be exacerbated when more data are collected than necessary.
It tends to be time consuming and expensive to implement a solution that requires a large amount of data.
This may call for extra time and effort to understand all of the data and the interrelationship among the types of data collected, which may not be a trivial task.

Method used


Image

  • System and method of monitoring and quantifying performance of an automated manufacturing facility
  • System and method of monitoring and quantifying performance of an automated manufacturing facility
  • System and method of monitoring and quantifying performance of an automated manufacturing facility

Examples


Embodiment Construction

[0031]The description which follows and the embodiments described therein are provided by way of illustration of an example, or examples, of particular embodiments of the principles of the present invention. These examples are provided for the purposes of explanation, and not limitation, of those principles and of the invention. In the description which follows, like parts are marked throughout the specification and the drawings with the same respective reference numerals.

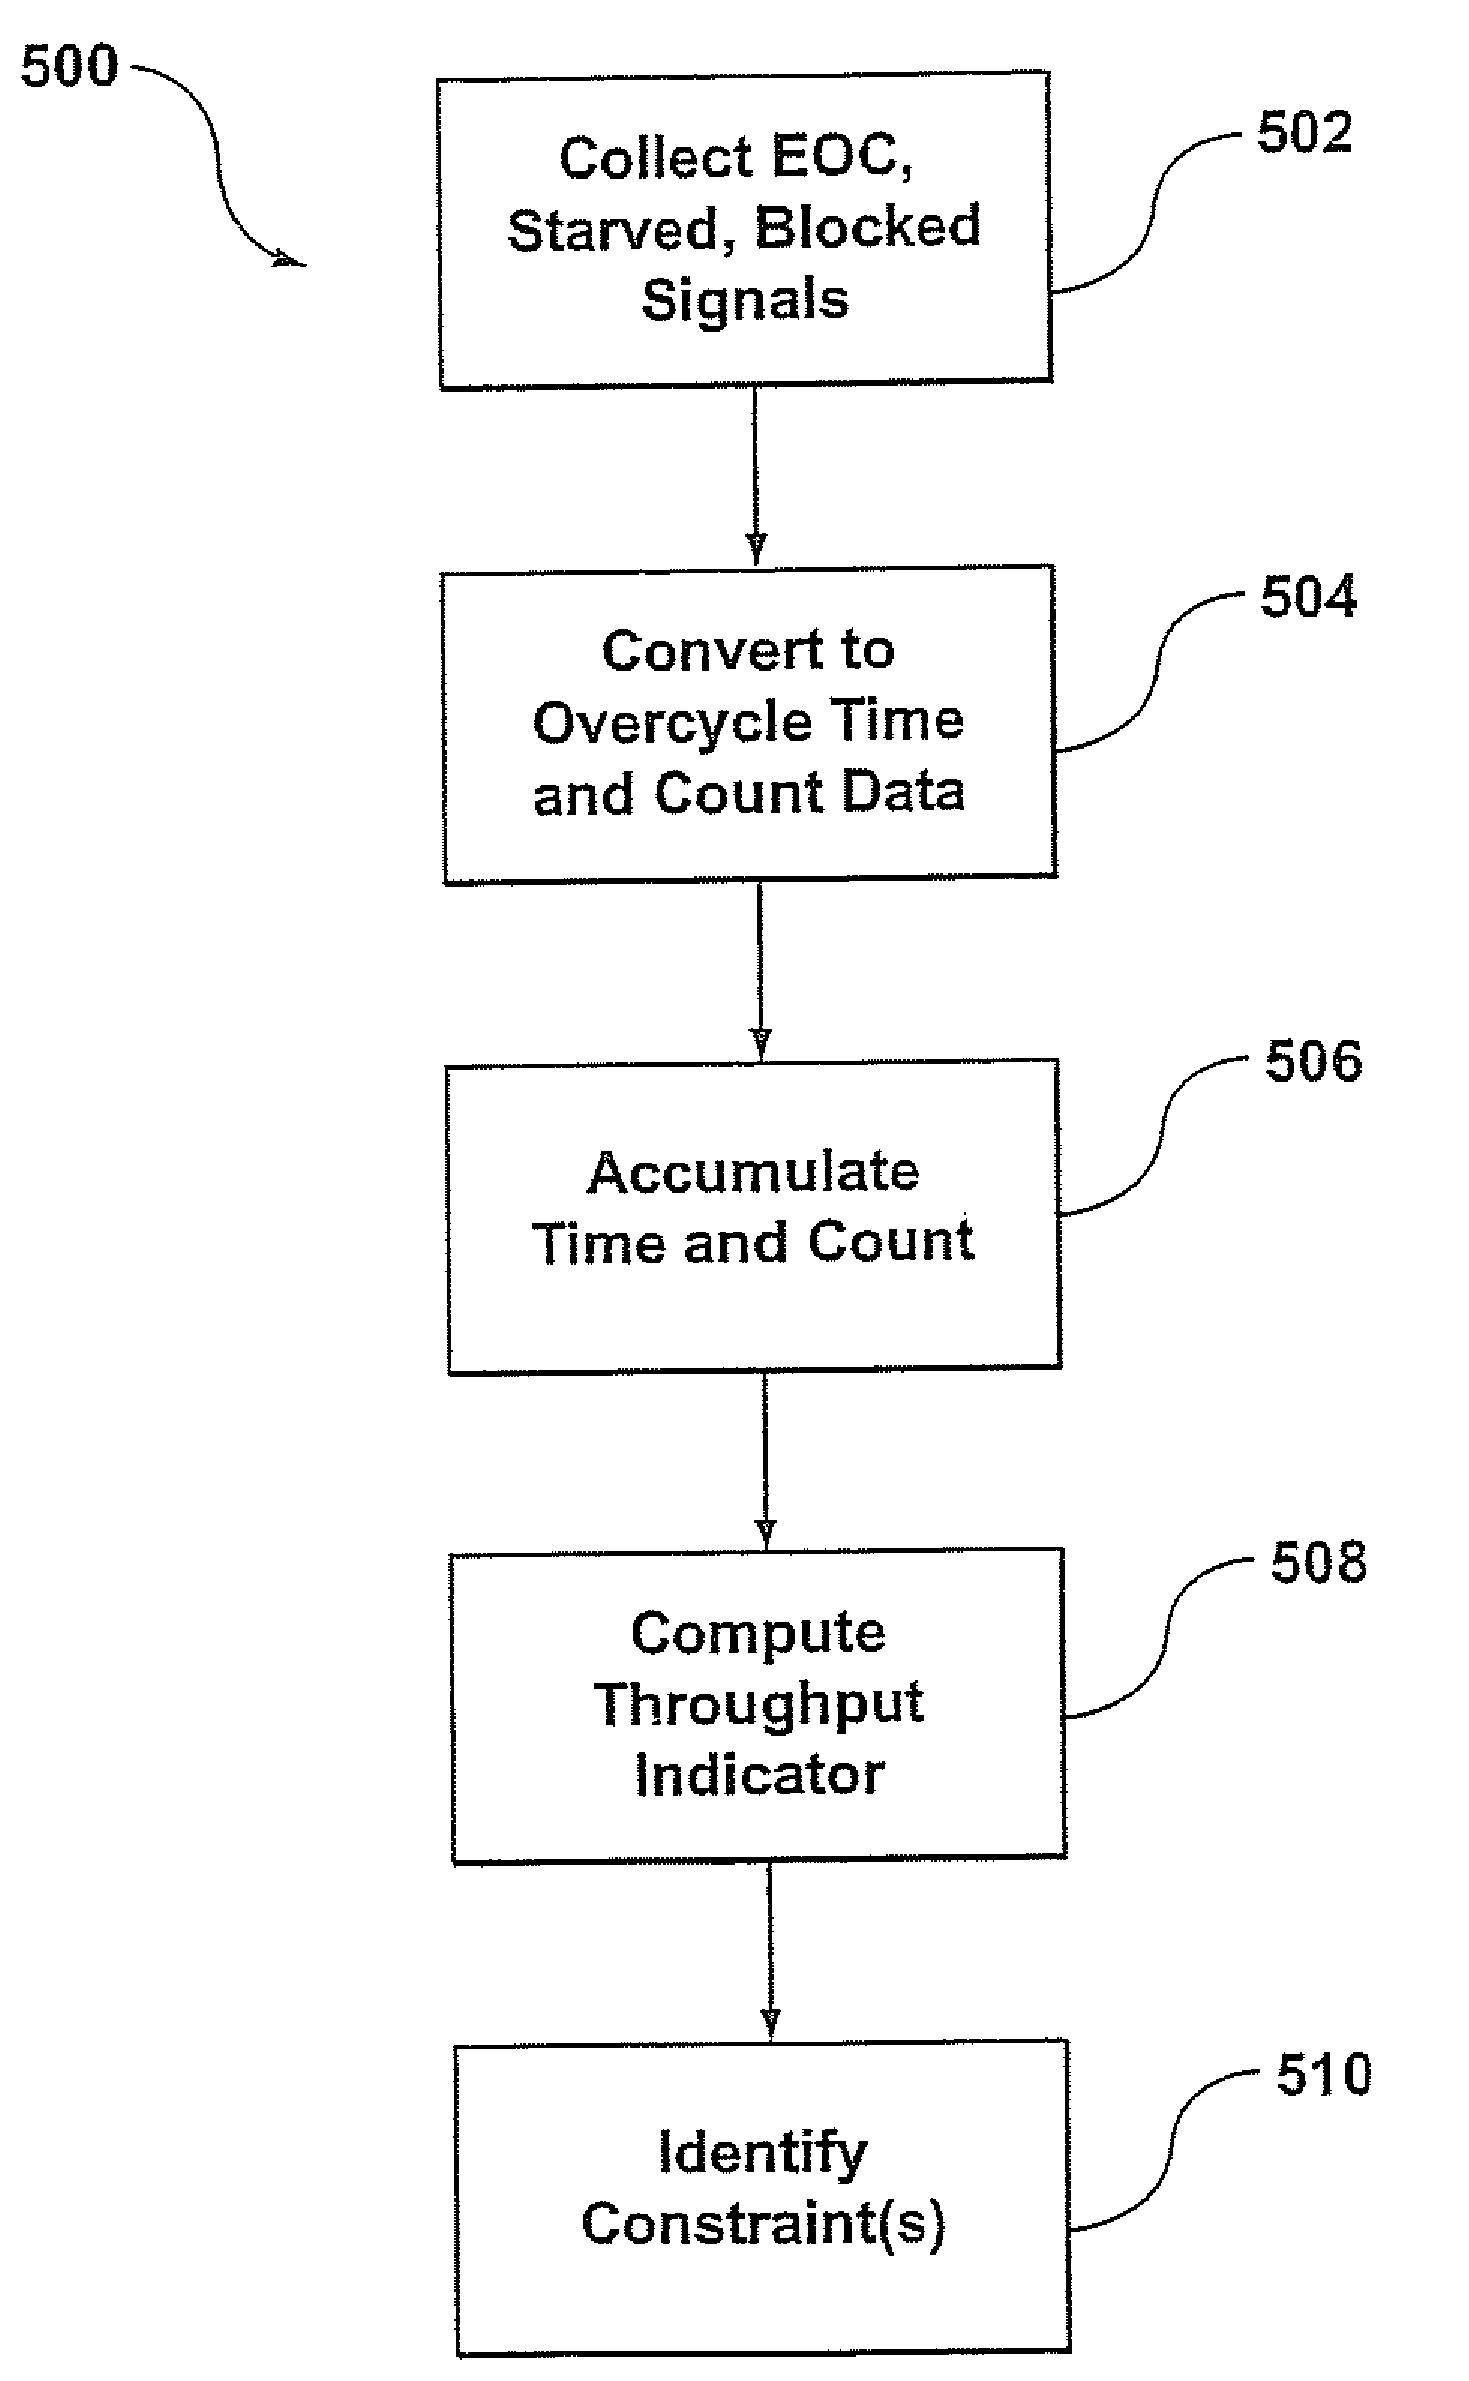
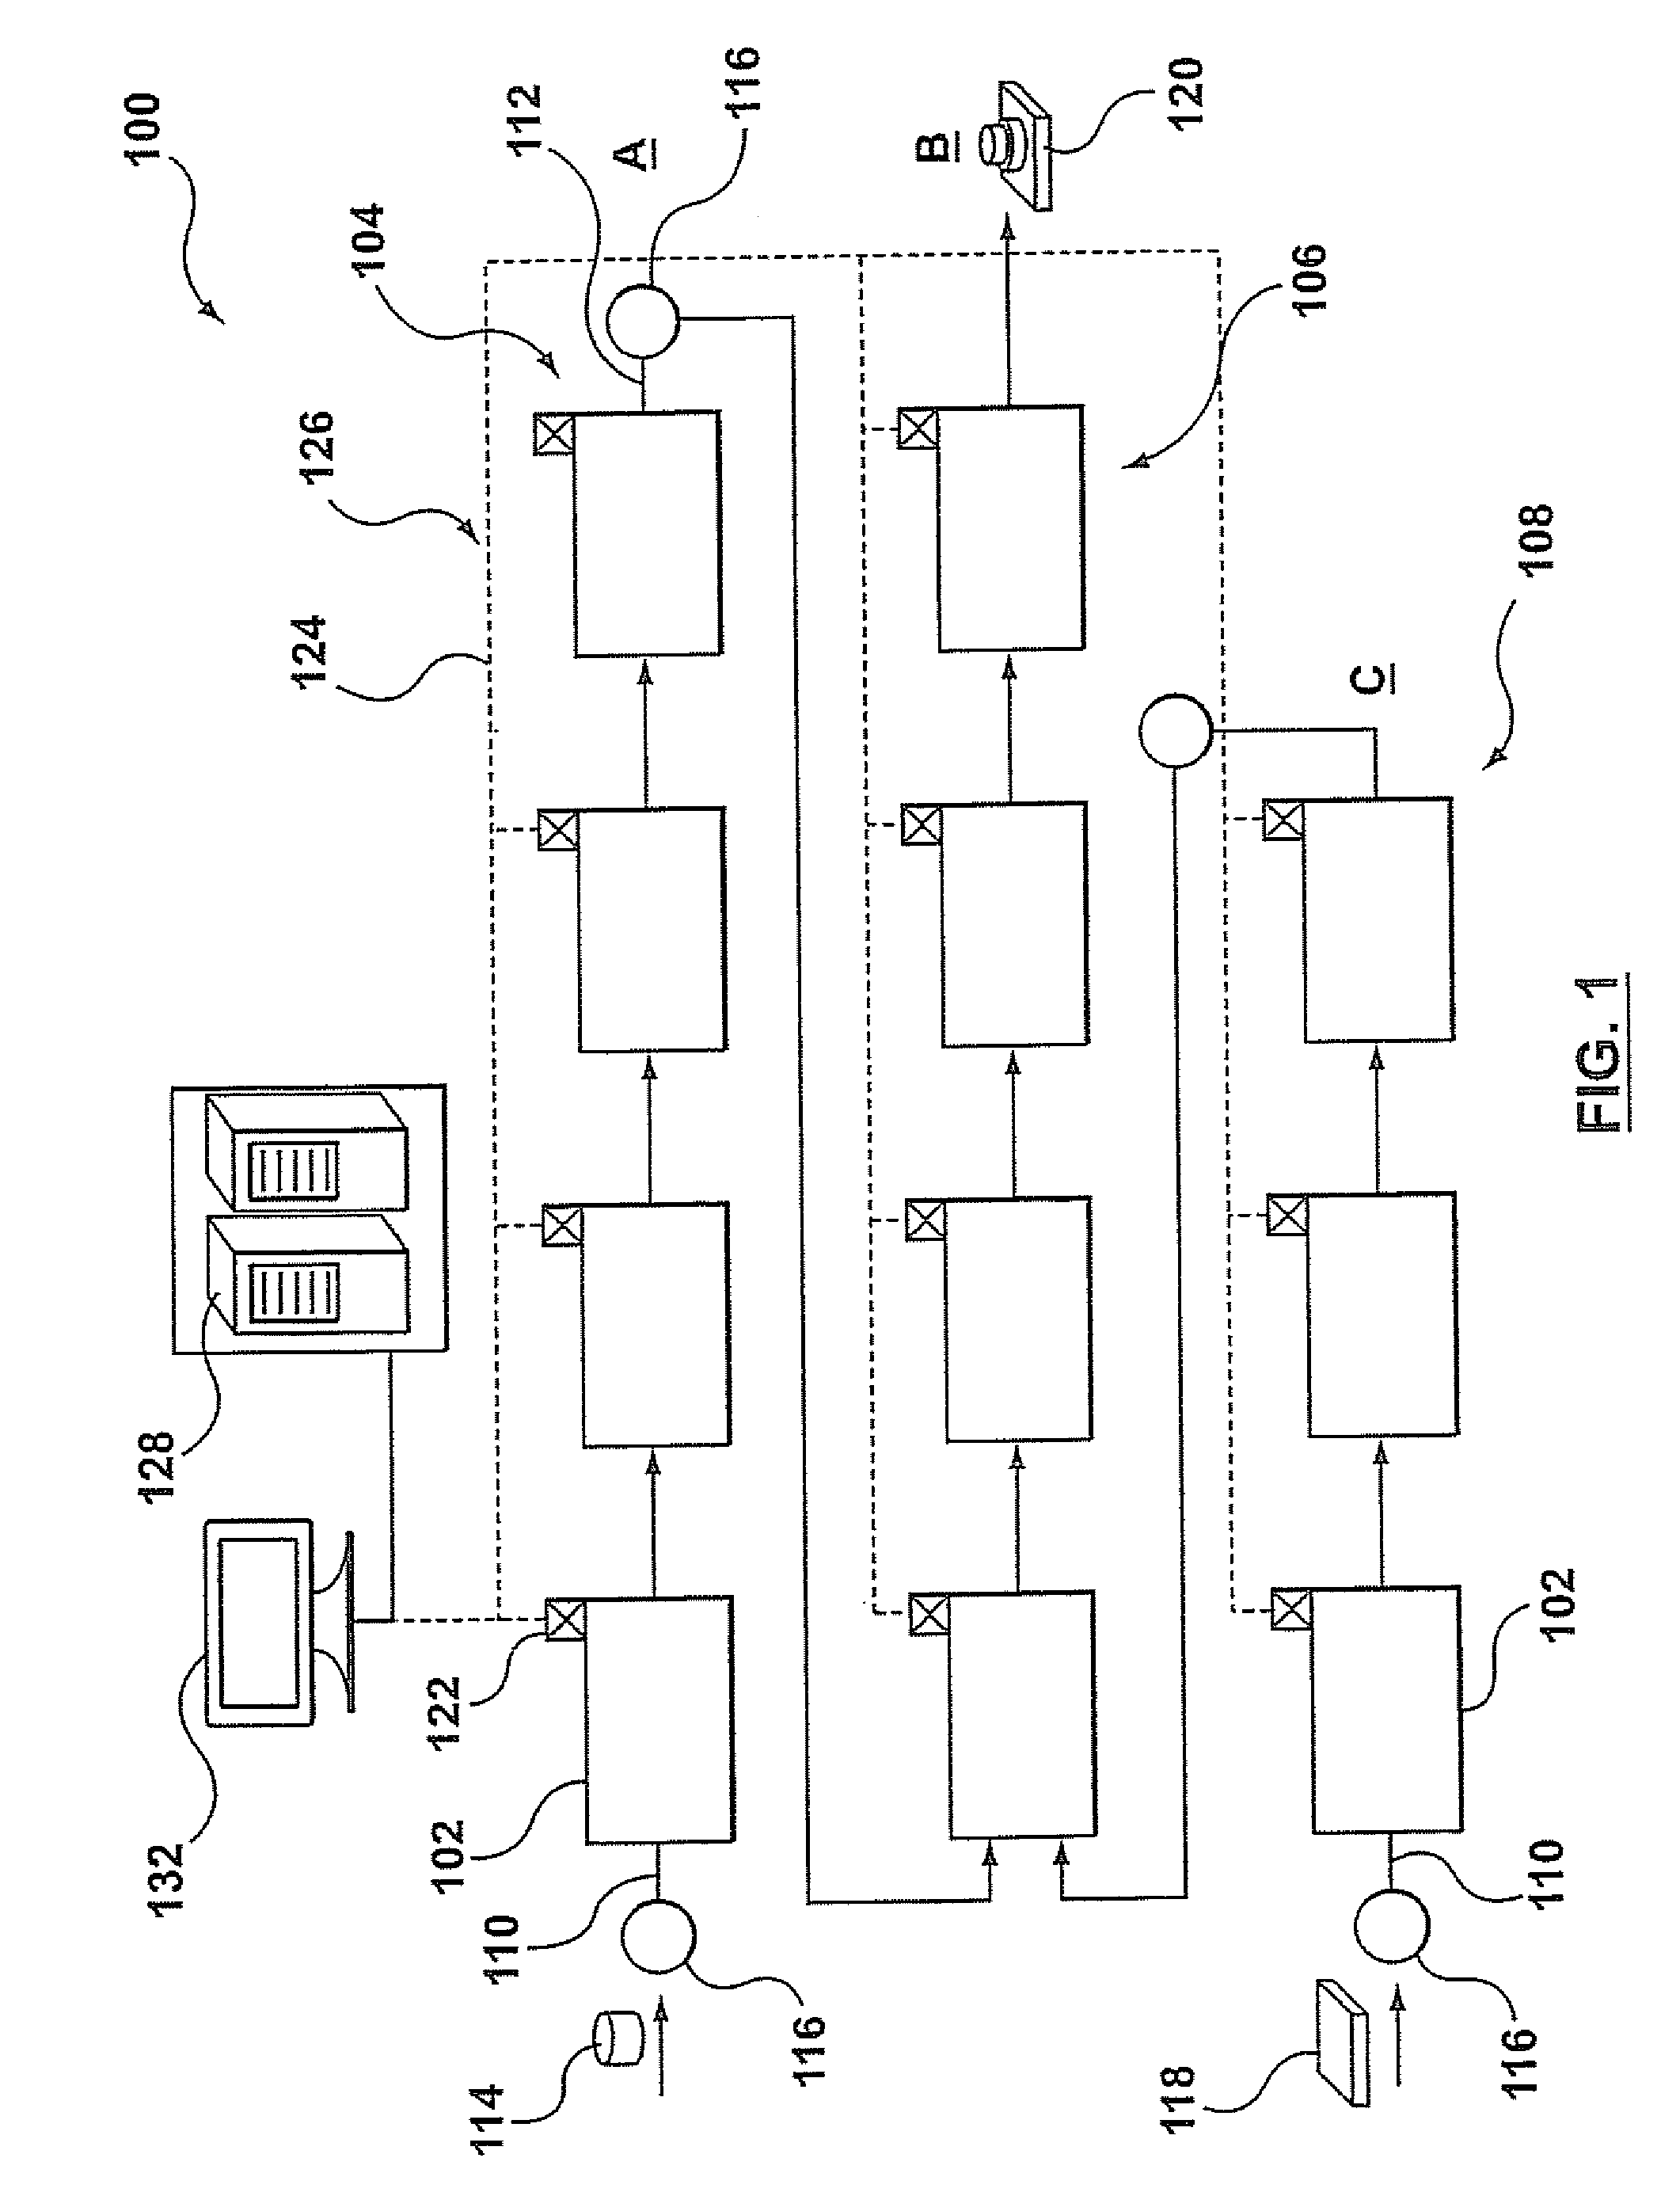
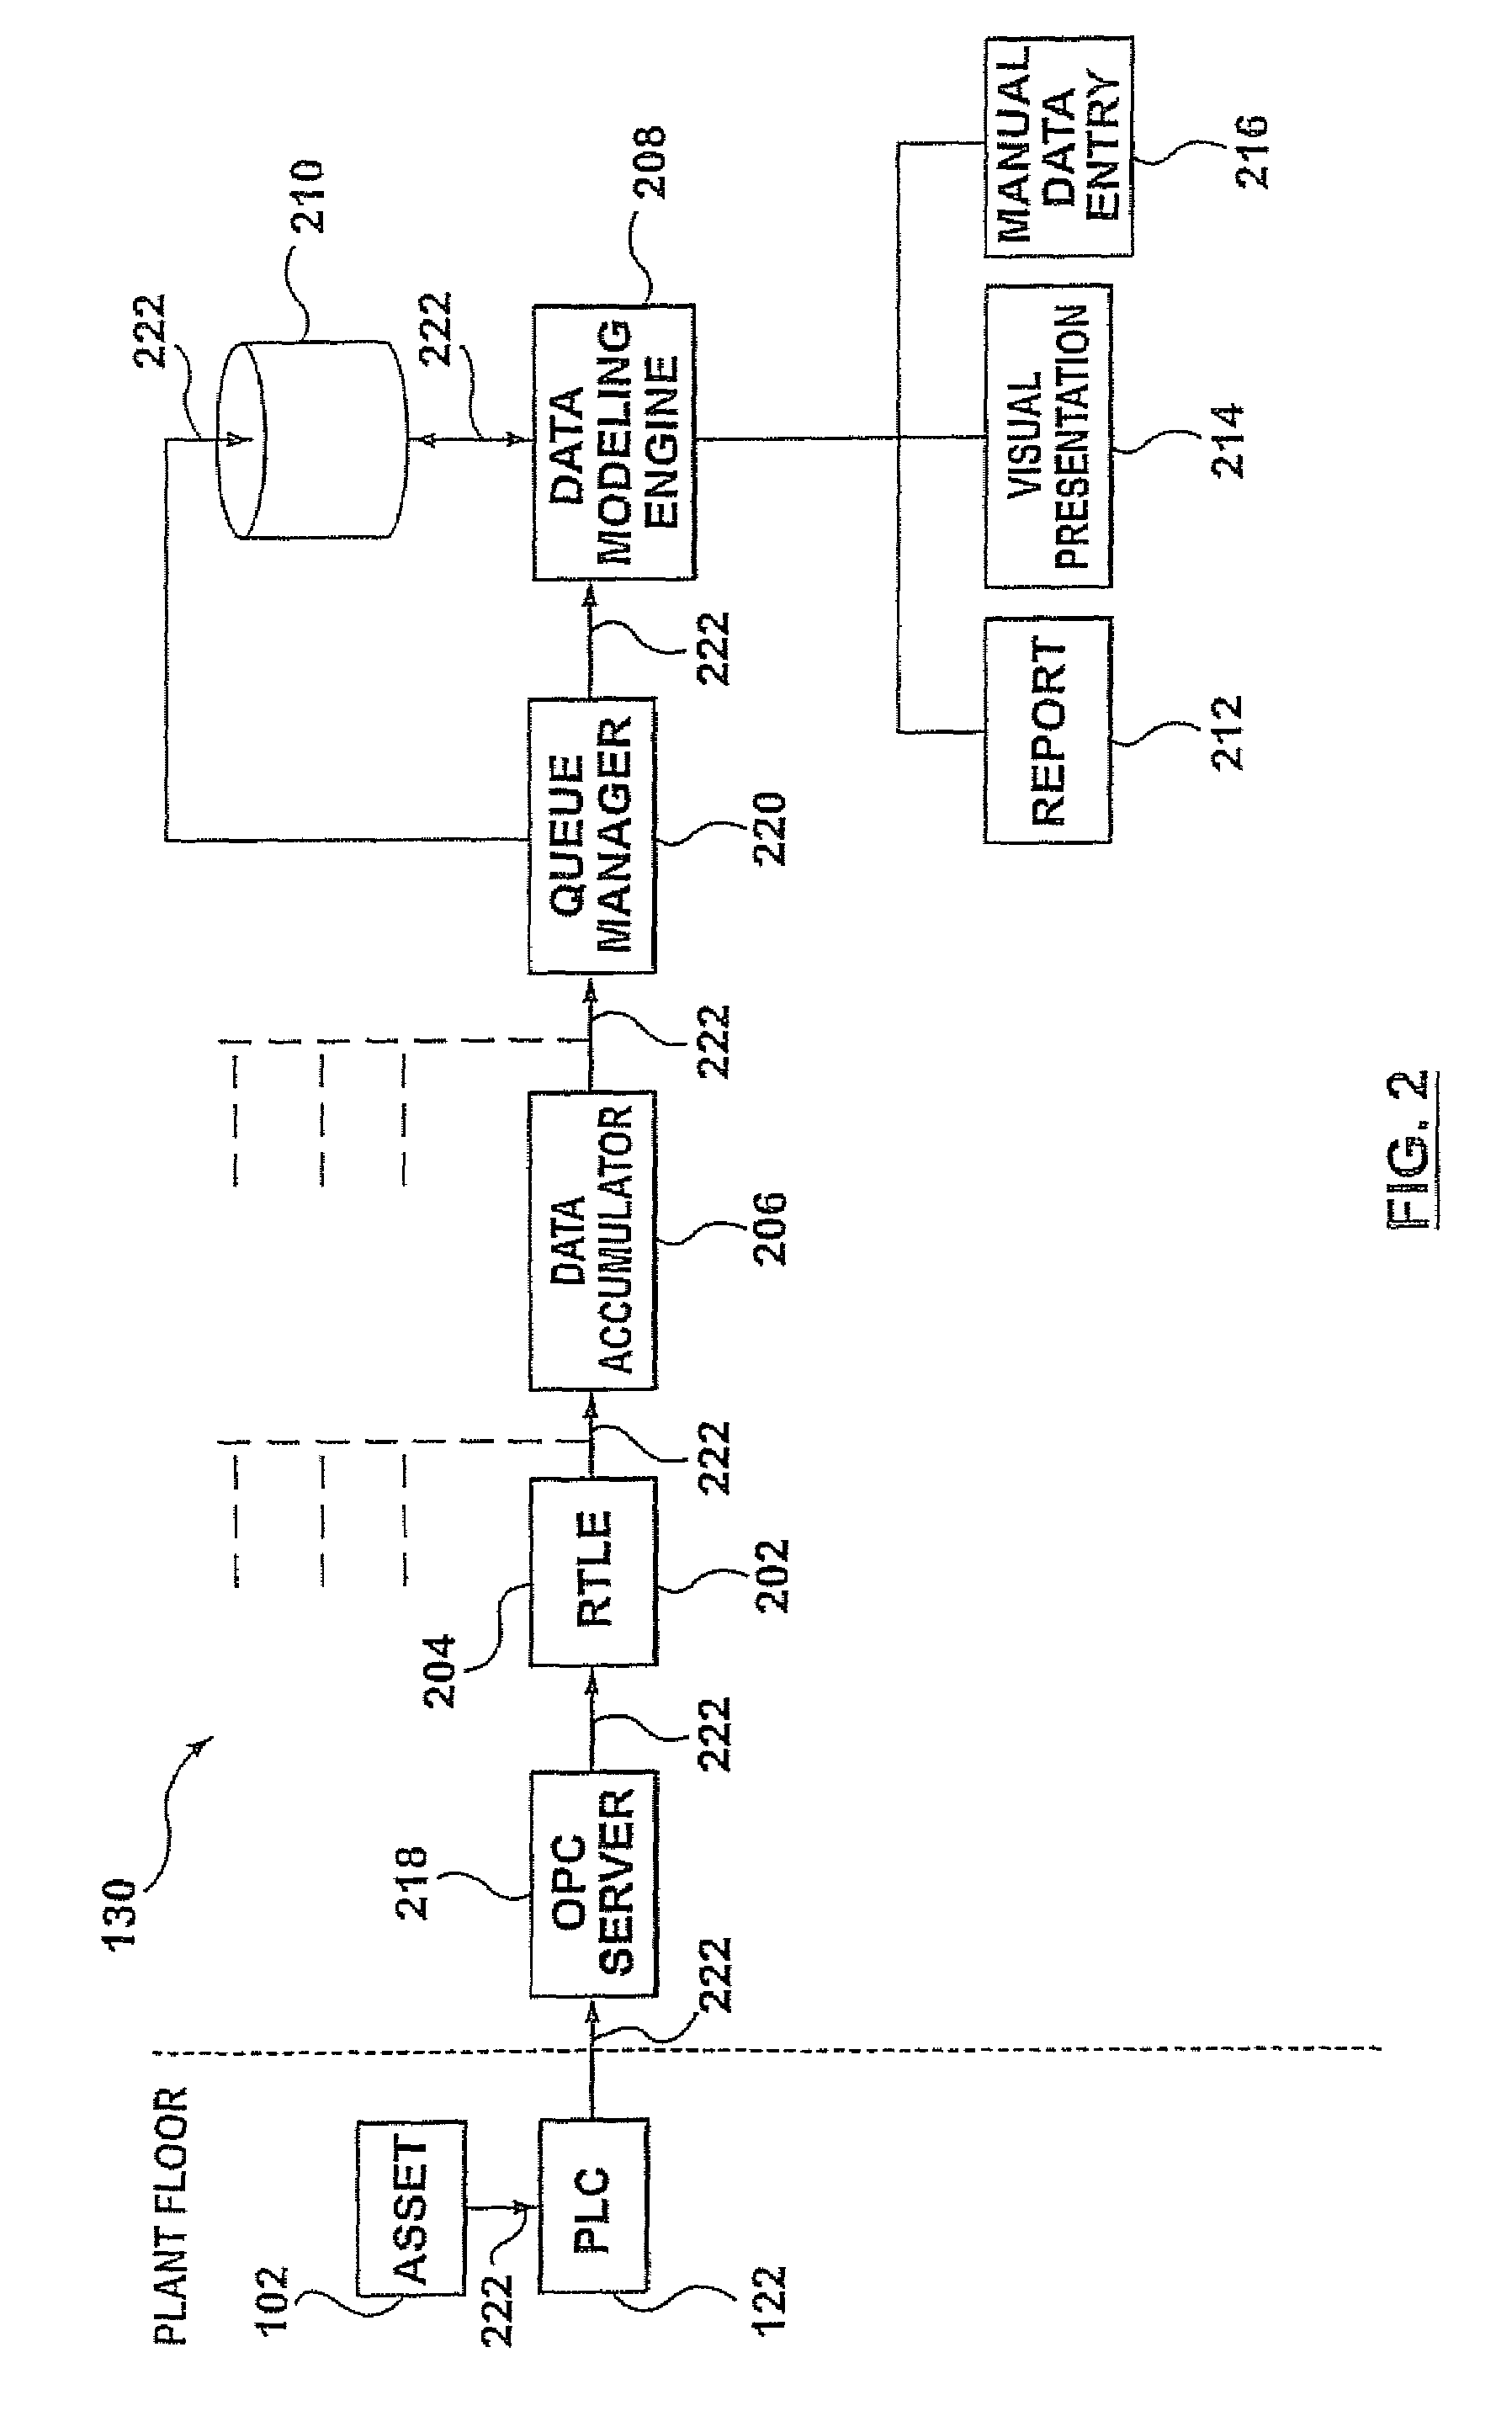
[0032]The present invention relates to a system and method for identifying and quantifying constraints in an automated manufacturing or processing facility. The facility has a number of automated workstations. In an embodiment the system utilizes automatically collected event and state signals from each workstation and processes these signals to derive a throughput capability measure for each workstation. The automated collection of signals is further augmented by provision of input devices that allow users to manu...


PUM


Abstract

The present invention is directed to a method and system for identifying, quantifying and presenting to a user constraints in an automated manufacturing or processing facility. A data processing system continuously receives basic status signals and state signals from automation equipment in the facility and evaluates and processes these signals to derive a throughput capability measure (a measure of constraint) of each given manufacturing workstation in the process. The throughput capability measure is expressed as a ratio of an ideal cycle time to an accumulated overcycled time. The accumulated overcycled time includes only delays and excludes any speed-up of a workstation. A constraint is identified as the workstation that has the lowest throughput capability measure as compared with all other workstations in a production line. Preferably, throughput capability measures for all workstations are presented to users graphically. Further drill-down can be provided for obtaining more detailed information about the constraint and capacity loss as well as entering information relevant to the constraint, such as a stoppage or slow-down.

Description

FIELD OF INVENTION[0001]The invention relates generally to the field of monitoring performance of manufacturing facilities. In particular, the invention relates to a system and method of monitoring and managing performance of an automated manufacturing facility.BACKGROUND OF INVENTION[0002]In an automated manufacturing facility, optimal operation of the facility depends on individual manufacturing cells or stations (workcells or workstations) processing parts or workpieces at their respective expected production rate. Workstations not operating at their expected production rate generally constrain product flow and affects overall throughput of the manufacturing process. It is Generally believed that throughput of the facility is limited by its constraints, namely, workstations causing relatively most significant disruption to the production or workflow of the facility. Continuous improvement efforts will likely be hindered if one is unable to determine the constraints in an automate...

Claims


Application Information

Patent Timeline
Patent Type & Authority Patents(United States)
IPC IPC(8): G06F19/00
CPCG06Q10/06G05B2219/31412G05B2219/31413G05B2219/31415
Inventor COCCO, DENNIS P.
Owner APTEAN INC
Why Eureka
Try Eureka