
Real-time measurement of ventricular stroke volume variations by continuous arterial pulse contour analysis

a pulse contour analysis and real-time measurement technology, applied in the field of cardiac monitoring, can solve the problems of affecting the value, requiring a certain type of equipment, and few hospitals without a monitor

Active Publication Date: 2008-09-09
EDWARDS LIFESCIENCES CORP
View PDF94 Cites 60 Cited by
  • Summary
  • Abstract
  • Description
  • Claims
  • Application Information

AI Technical Summary

Benefits of technology

The invention provides a method and system for calculating a cardiac parameter called stroke volume variation (SVV) using data from arterial blood pressure waveforms. The method involves measuring blood pressure and converting it into a waveform data set. The standard deviation of the waveform data set is then calculated over at least two cardiac cycles. An estimate of the SVV is then calculated as a function of the standard deviation values. The method can be used to calculate other cardiac or hemodynamic parameters, such as right ventricular end diastolic volume. The invention provides an improved method for approximating and low-pass filtering the data to improve accuracy. The technical effect of the invention is to provide a reliable and accurate method for calculating cardiac parameters, which can be useful in diagnosing and treating cardiovascular disease.

Problems solved by technology

Few hospitals are therefore without some form of equipment to monitor one or more of these cardiac parameters.
Invasive techniques have obvious disadvantages, the main one of which is of course that catheterization of the heart is potentially dangerous, especially considering that the subjects (especially intensive care patients) on which it is performed are often already in the hospital because of some actually or potentially serious condition.
Moreover, the very introduction of an instrument into the blood flow may affect the value (for example, flow rate) that the instrument measures.
Not only are these systems typically expensive, but their accuracy depends on precise knowledge of the diameter and general geometry of the flow channel.
Such precise knowledge is, however, seldom possible, especially under conditions where real-time monitoring is desired.
One drawback of PCM, however, is that it is no more accurate than the rather simple, three-parameter model from which it is derived; in general, a model of a much higher order would be needed to faithfully account for other phenomena, such as the complex pattern of pressure wave reflections due to multiple impedance mis-matches caused by, for example, arterial branching.
Because the accuracy of the basic model is usually not good enough, many improvements have been proposed, with varying degrees of complexity
Fluid administration in hemodynamically unstable patients is often a major challenge when it-comes to measuring SV, CO, or other hemodynamic parameters in real time.
Correct clinical assessment of hypovolemia is difficult, as is the decision to undertake fluid resuscitation as the initial treatment strategy.
Specifically, it is very difficult to predict whether a hemodynamically unstable patient will respond to fluid therapy with an increase in stroke volume and cardiac output.
Moreover, fluid overload can cause significant pulmonary or cardiac dysfunction, whereas fluid insufficiency may cause tissue damage resulting in vital organ dysfunction.
Several studies and case reports have shown, however, that these static indicators based on cardiac filling pressures have poor predictive value and often fail to give adequate information about fluid responsiveness.
Because of the requirement for pressure maneuvers, this method is not suitable for real-time monitoring.
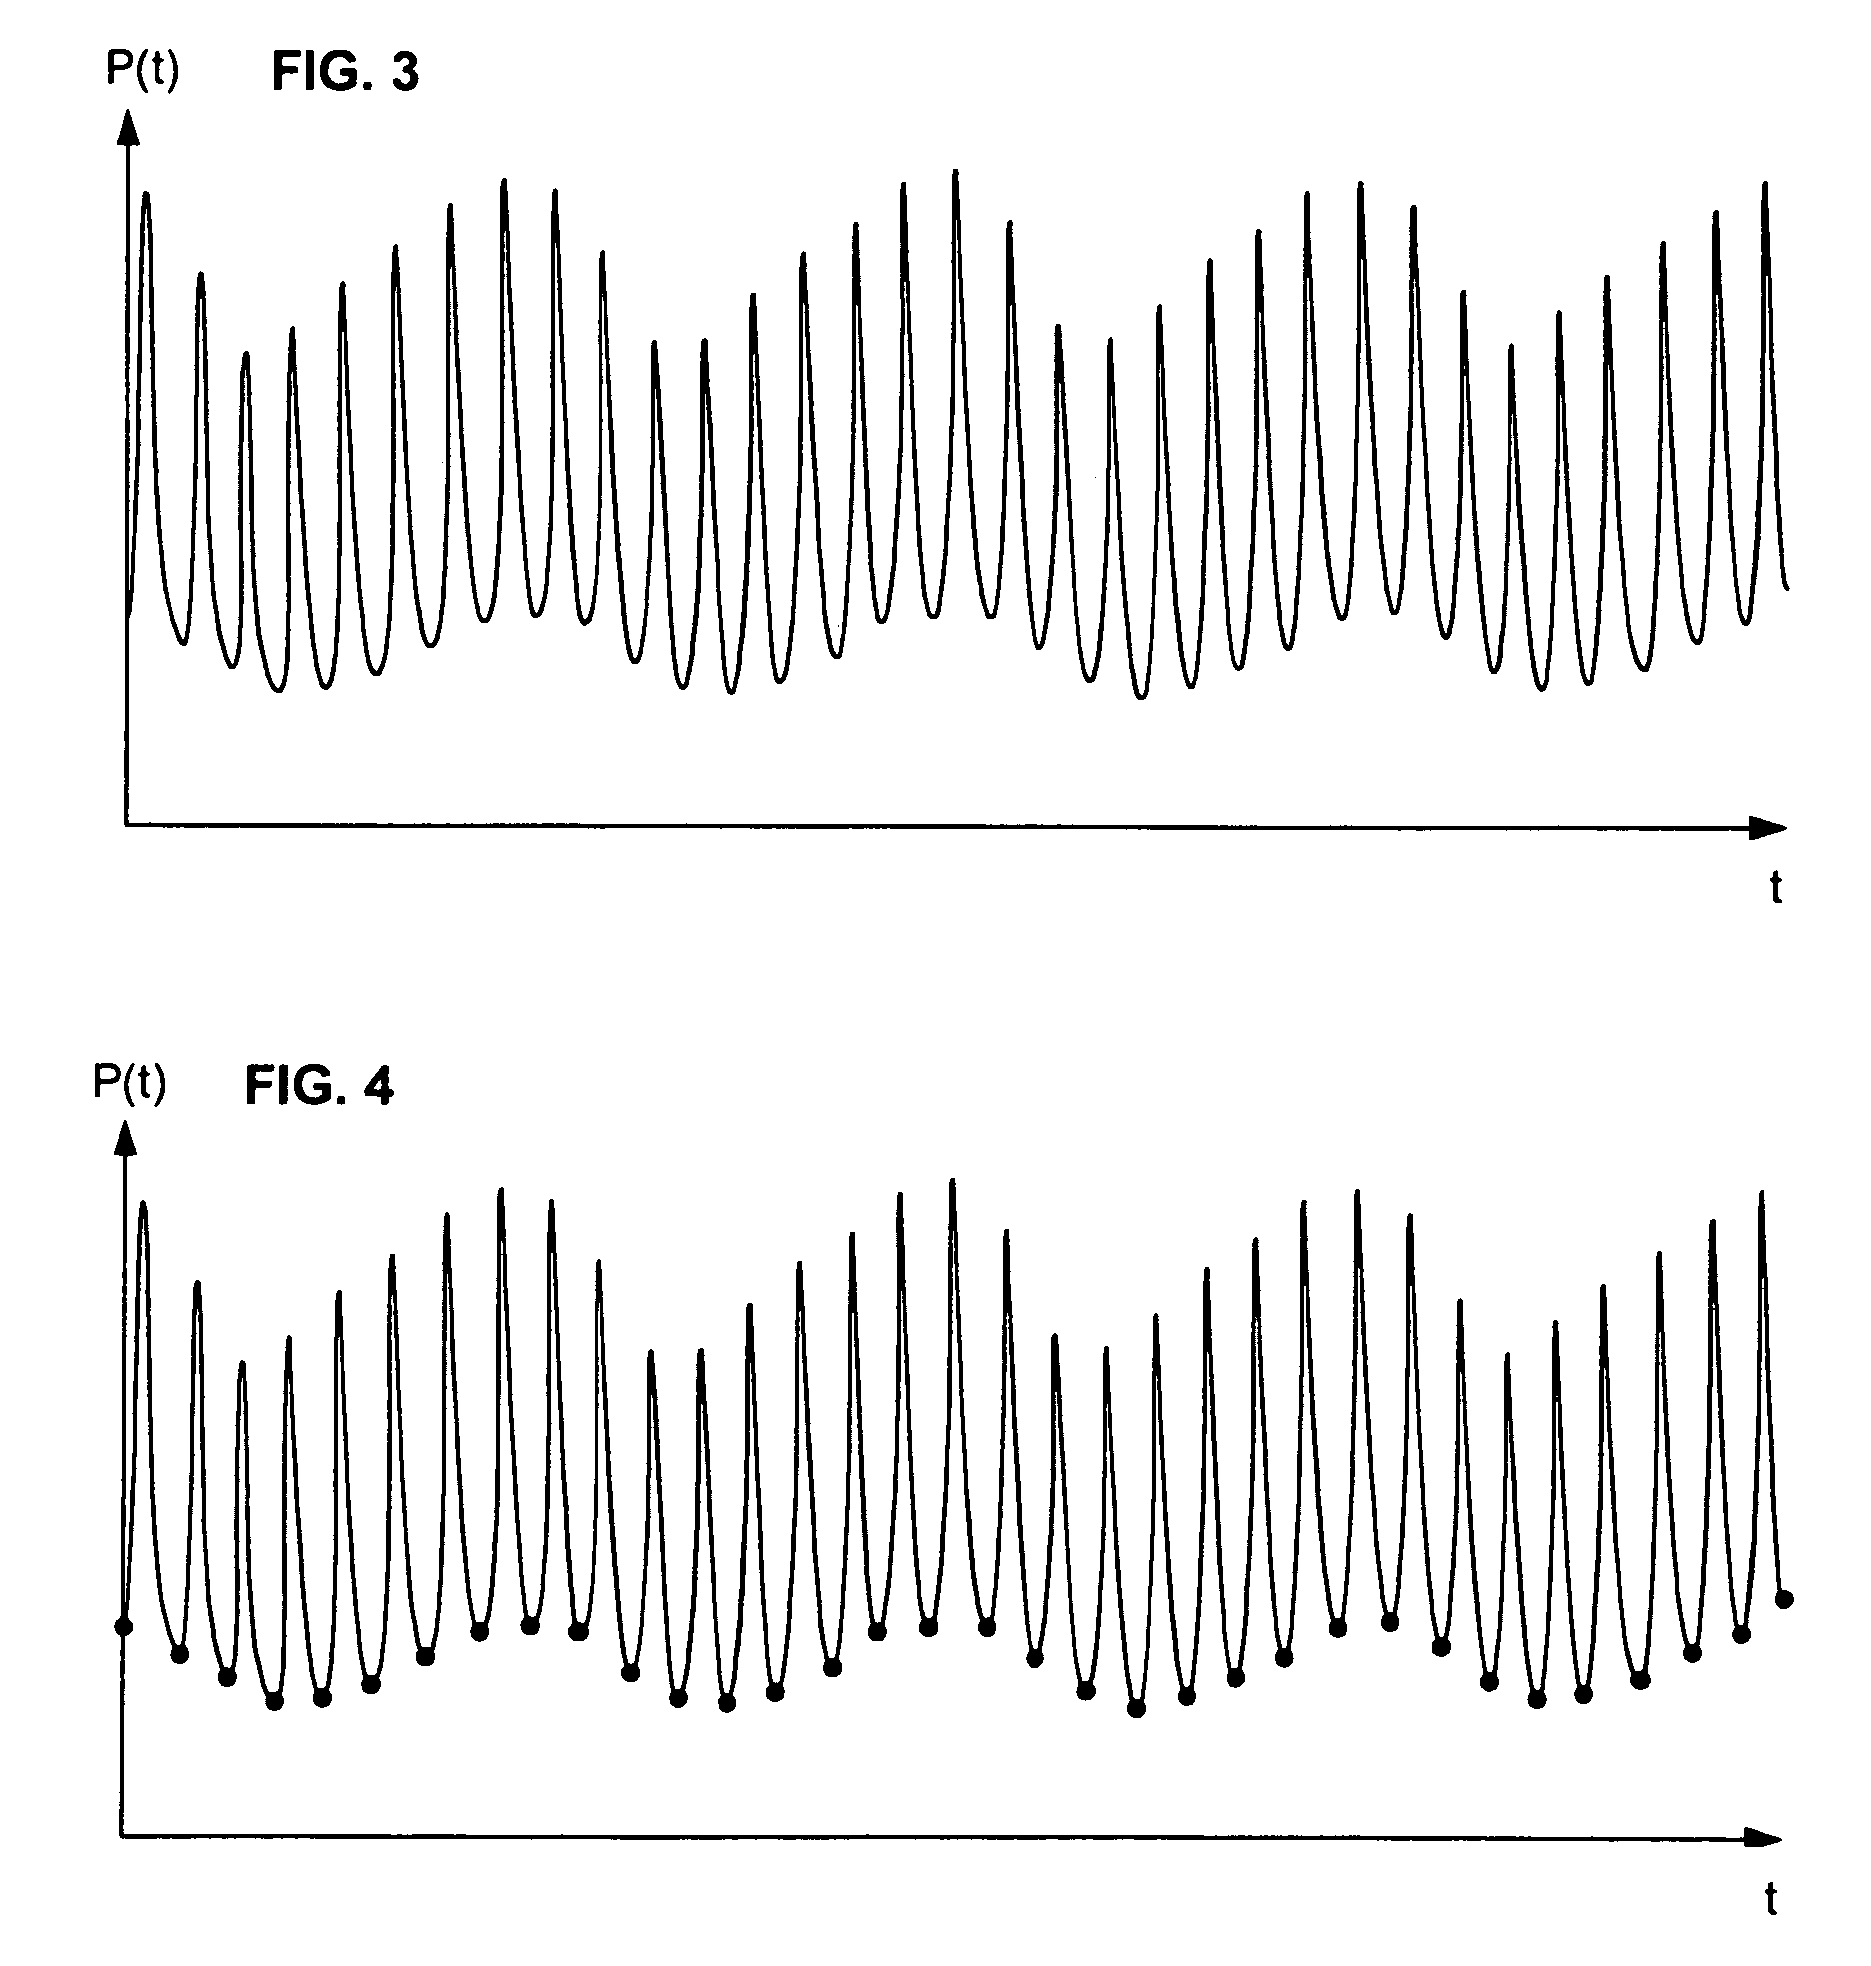
Tests by the inventors show however, that these methods are so noisy that they do not allow for accurate real-time monitoring of the respiration-induced changes in the arterial pulse pressure.
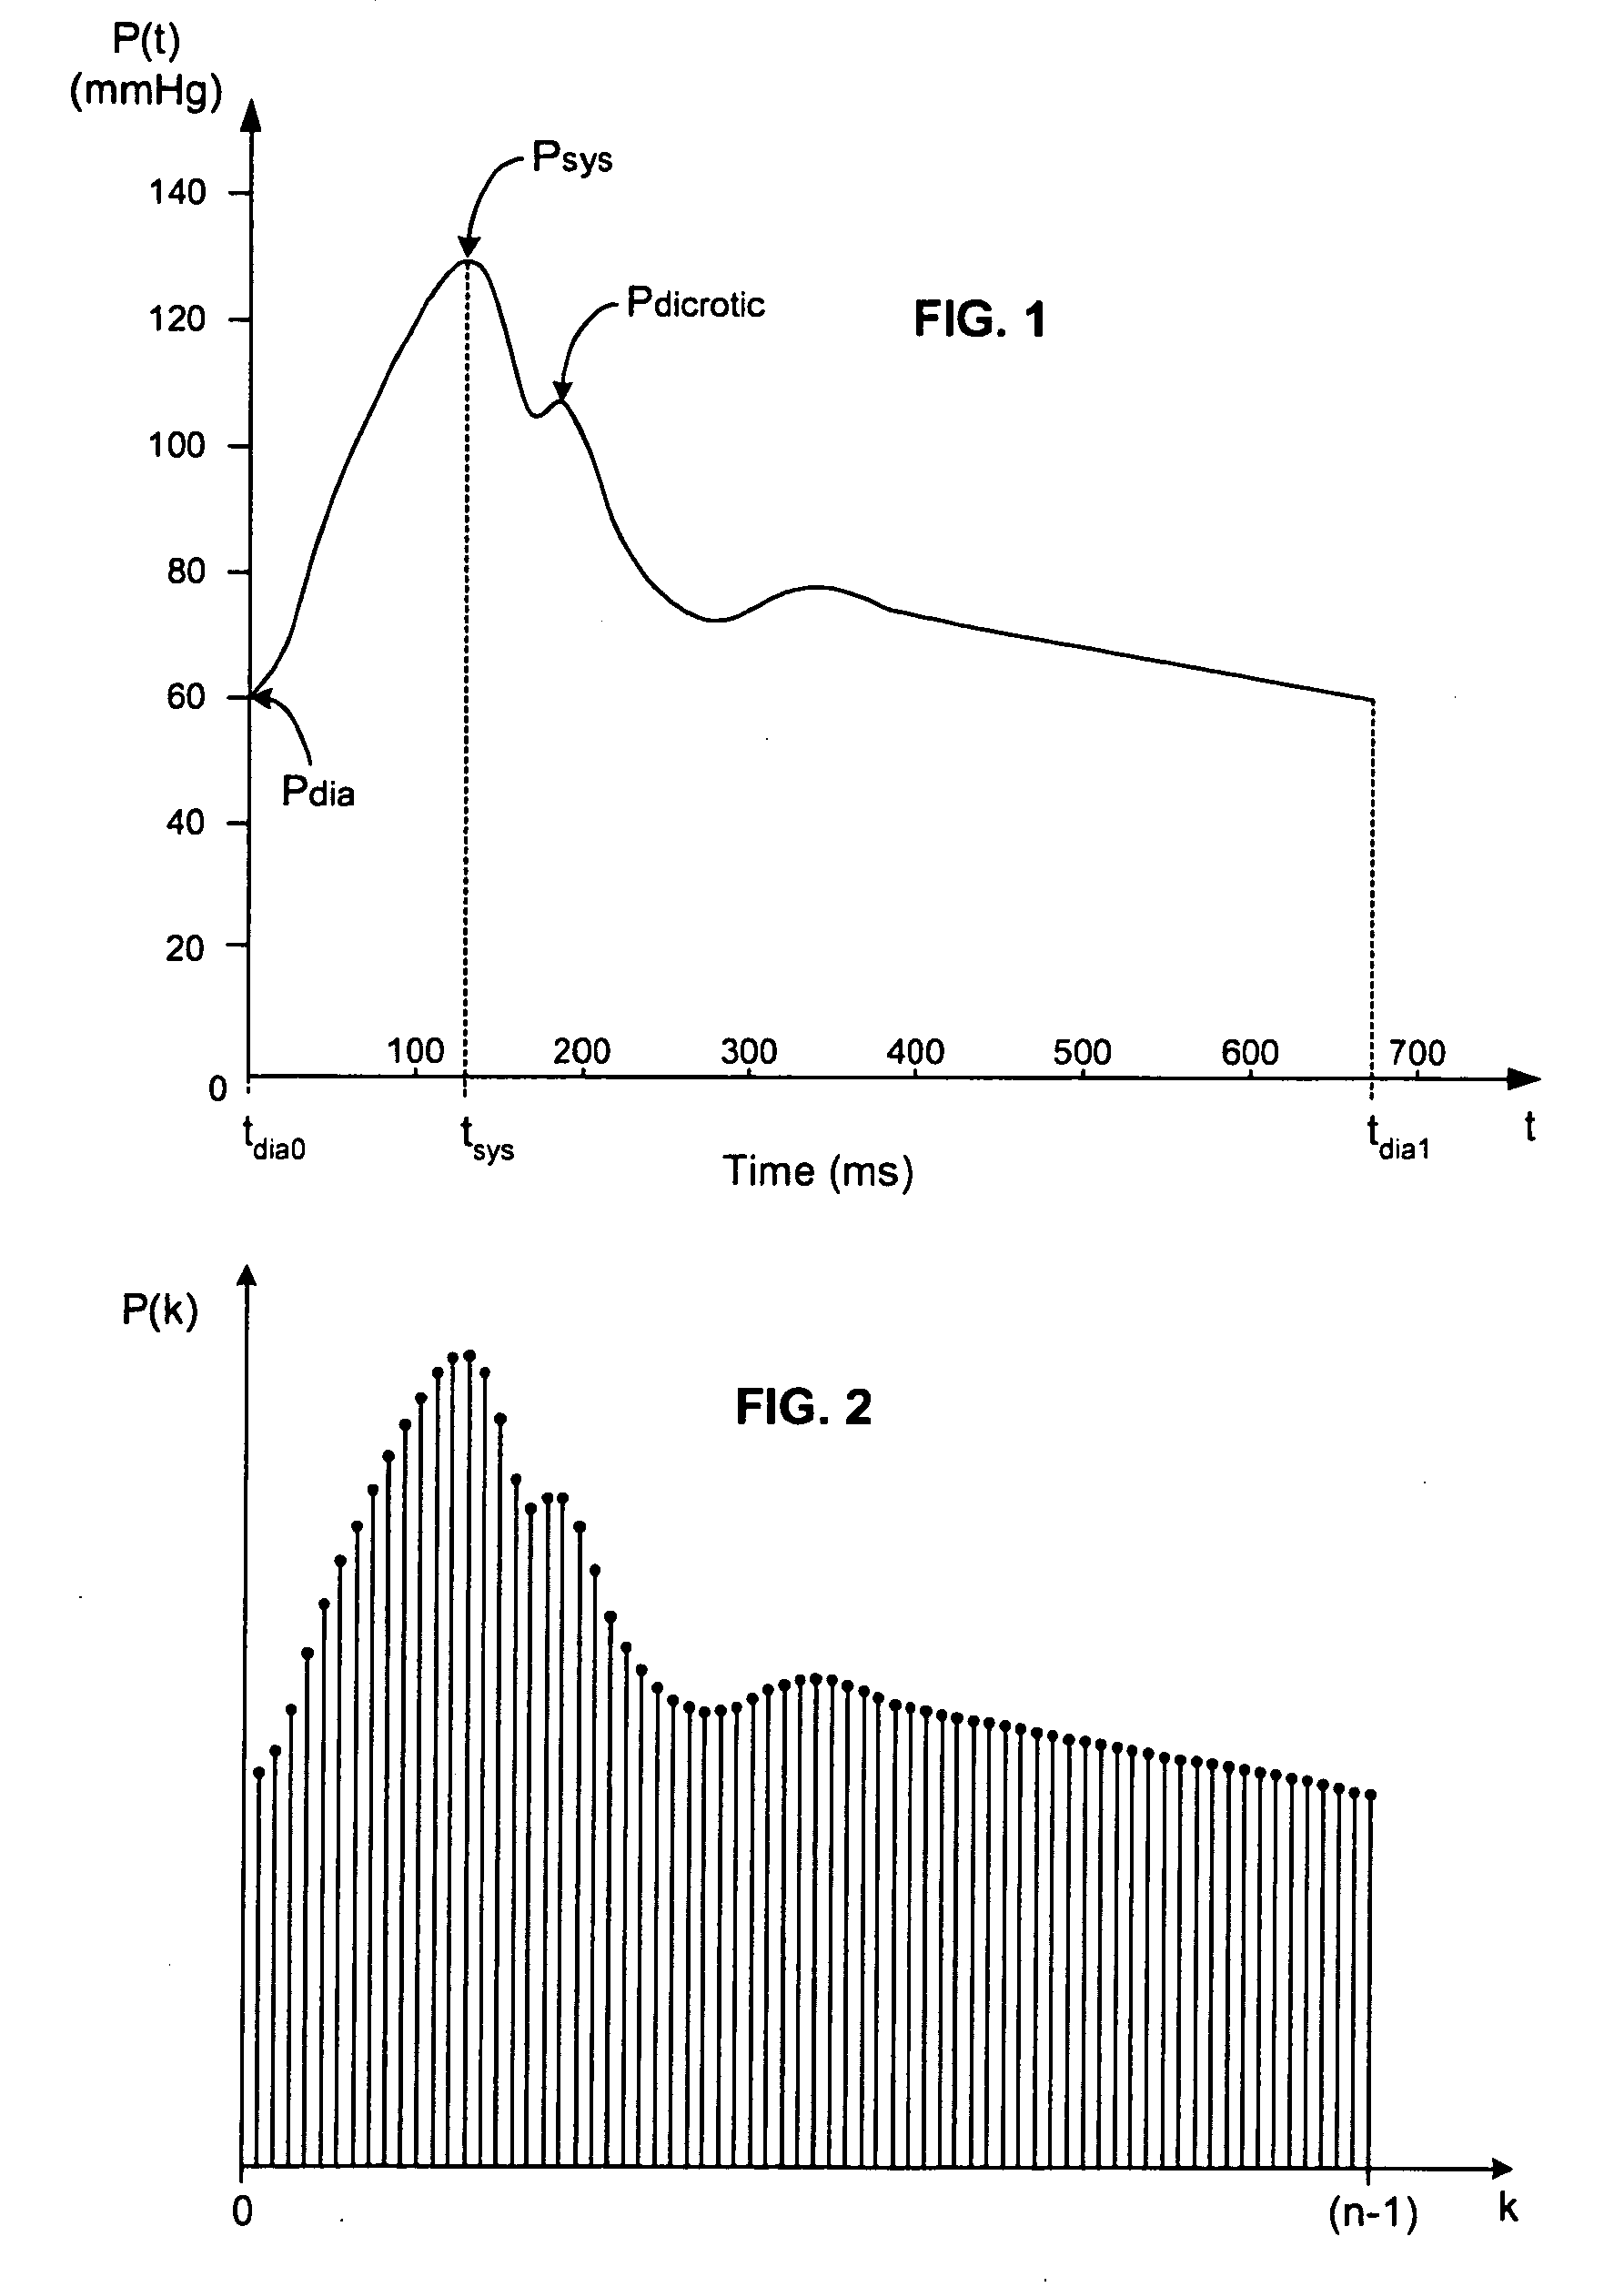
Precise detection of the dicrotic notch and other points in the blood pressure signal, however, is difficult, due to the inconstancy of the blood pressure waveform and its volatile nature.

Method used


Image

  • Real-time measurement of ventricular stroke volume variations by continuous arterial pulse contour analysis
  • Real-time measurement of ventricular stroke volume variations by continuous arterial pulse contour analysis
  • Real-time measurement of ventricular stroke volume variations by continuous arterial pulse contour analysis

Examples


Embodiment Construction

Introduction

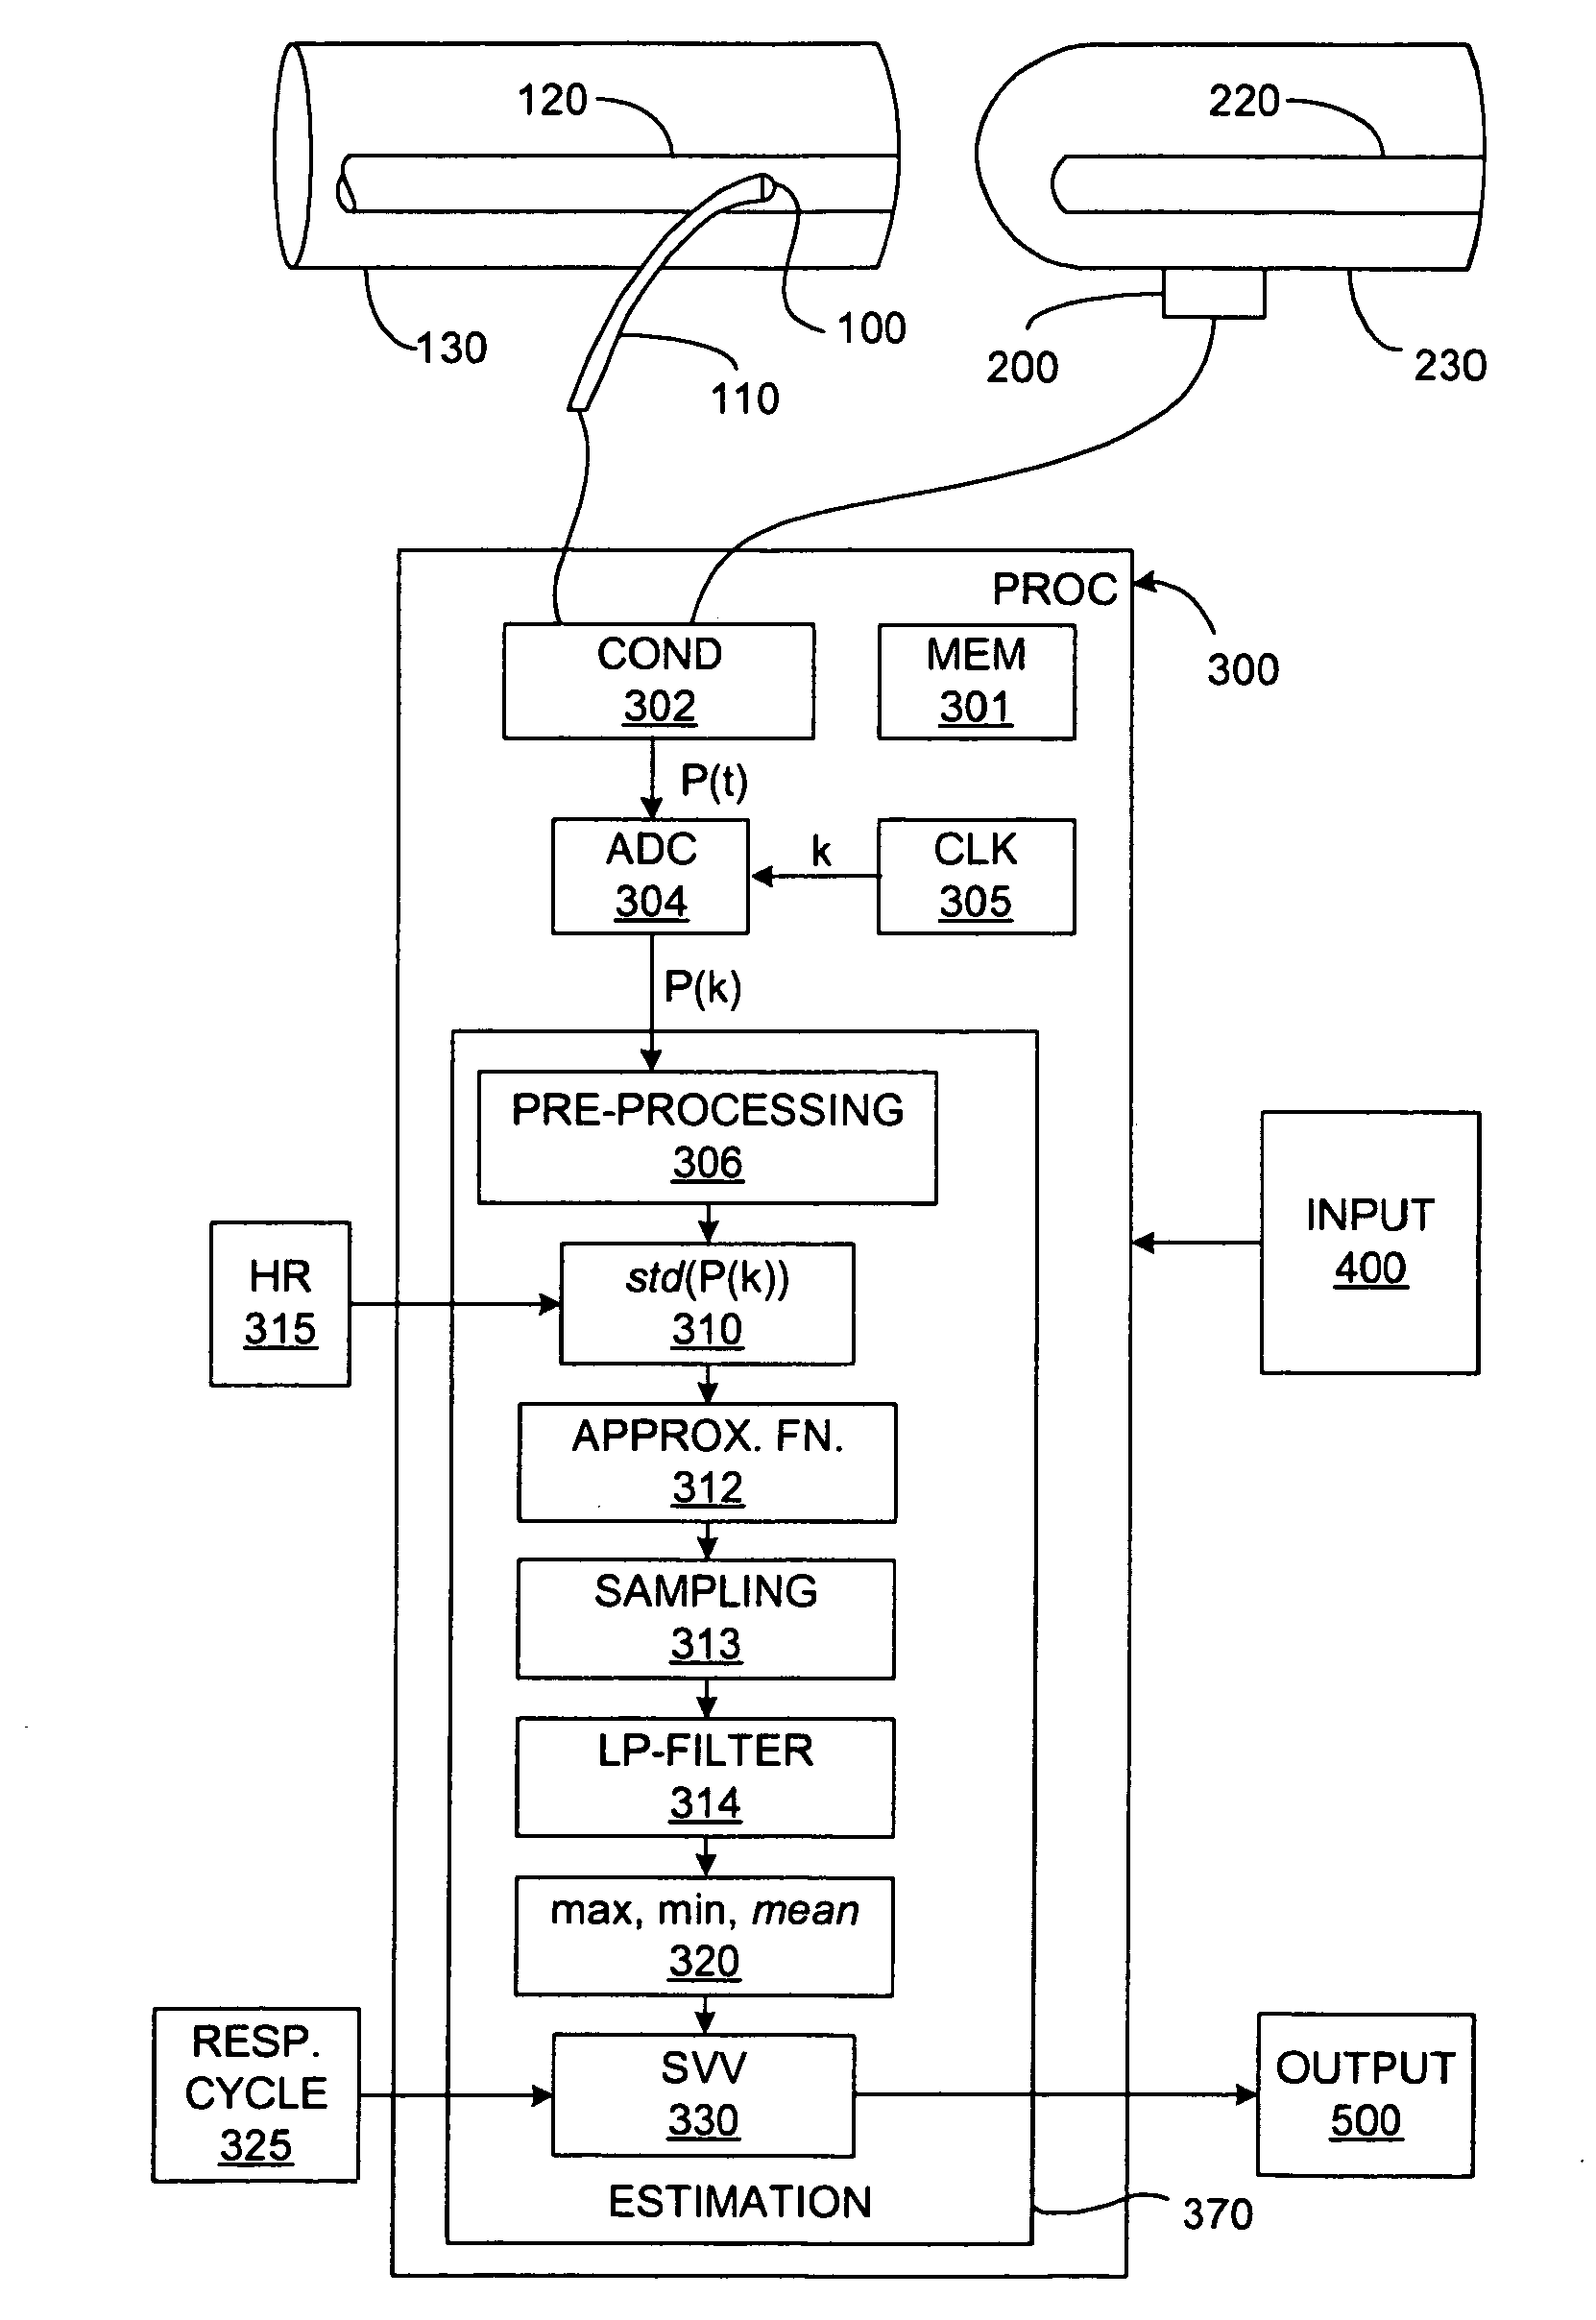
[0047]In broadest terms, the invention involves the beat-to-beat of stroke volume variation SVV as a function of the standard deviation of the blood pressure waveform over a plurality of cardiac cycles. Of course, the invention may be used to determine any other cardiac parameter that can be derived from SVV.

[0048]The invention may be used to advantage with any type of subject, whether human or animal. Because it is anticipated that the most common use of the invention will be on humans in a diagnostic setting, the invention is described below primarily in use with a “patient.” This is by way of example only, however—it is intended that the term “patient” should encompass all subjects, both human and animal, regardless of setting.

[0049]Because of its clinical significance, it is anticipated that most implementations of the invention will generate SVV estimates based on measurements of systemic arterial blood pressure. It would also be possible to use measurements of bloo...


PUM


Abstract

Ventricular stroke volume variation (SVV) is estimated as a function of the standard deviation of arterial blood pressure value measured over each of at least two cardiac cycles, preferably over each of the cardiac cycles in a computation interval covering a full respiratory cycle. In one embodiment, maximum and minimum standard deviation values are determined over the computation interval. SVV is then estimated proportional to the ratio of the difference between the maximum and minimum standard deviation values and the mean of the standard deviation values. In another embodiment, SVV is then estimated proportional to the ratio of the standard deviation of the standard deviation values and the mean standard deviation over the entire computation interval. A pre-processing arrangement for improving reliability of estimates of more general cardiac or hemodynamic parameters is also disclosed and involves smoothing with an approximating function, and sampling and low-pass filtering at an adjustable rate.

Description

CROSS-REFERENCE TO RELATED APPLICATIONS[0001]This application is a continuation-in-part of, claims priority of, and incorporates by reference U.S. patent application Ser. No. 10 / 728,705, filed 5 Dec. 2003 now U.S. Pat. No. 7,220,230, and Ser. No. 10 / 890,887, filed 14 Jul. 2004.BACKGROUND OF THE INVENTION[0002]1. Field of the Invention[0003]This invention relates in general to cardiac monitoring and in particular to estimation of ventricular stroke volume variation (SVV) as well as to a system that implements the method.[0004]2. Background Art[0005]Stroke volume (SV), cardiac output (CO), etc., are important indicators not only for diagnosis of disease, but also for “real-time” monitoring of the condition of both human and animal subjects, including patients. Few hospitals are therefore without some form of equipment to monitor one or more of these cardiac parameters. Many techniques—invasive and non-invasive, as well as those that combine both—are in use and even more have been prop...

Claims


Application Information

Patent Timeline
Patent Type & Authority Patents(United States)
IPC IPC(8): A61B5/02A61B5/029
CPCA61B5/02A61B5/02028A61B5/0205A61B5/029A61B5/021A61B5/0816A61B5/0215A61B5/0402A61B5/02108A61B5/318
Inventor HATIB, FERASROTELIUK, LUCHY
Owner EDWARDS LIFESCIENCES CORP
Learn More