
Compact, low cost Raman monitor for single substances

a raman monitor and low cost technology, applied in the direction of optical radiation measurement, instruments, separation processes, etc., can solve the problems that the cost of raman spectrometers is driven by the cost of laser excitation sources, and achieve the effect of drastically reducing the size and cost of raman systems

Active Publication Date: 2011-07-19
NECSEL INTPROP
View PDF7 Cites 11 Cited by
  • Summary
  • Abstract
  • Description
  • Claims
  • Application Information

AI Technical Summary

Benefits of technology

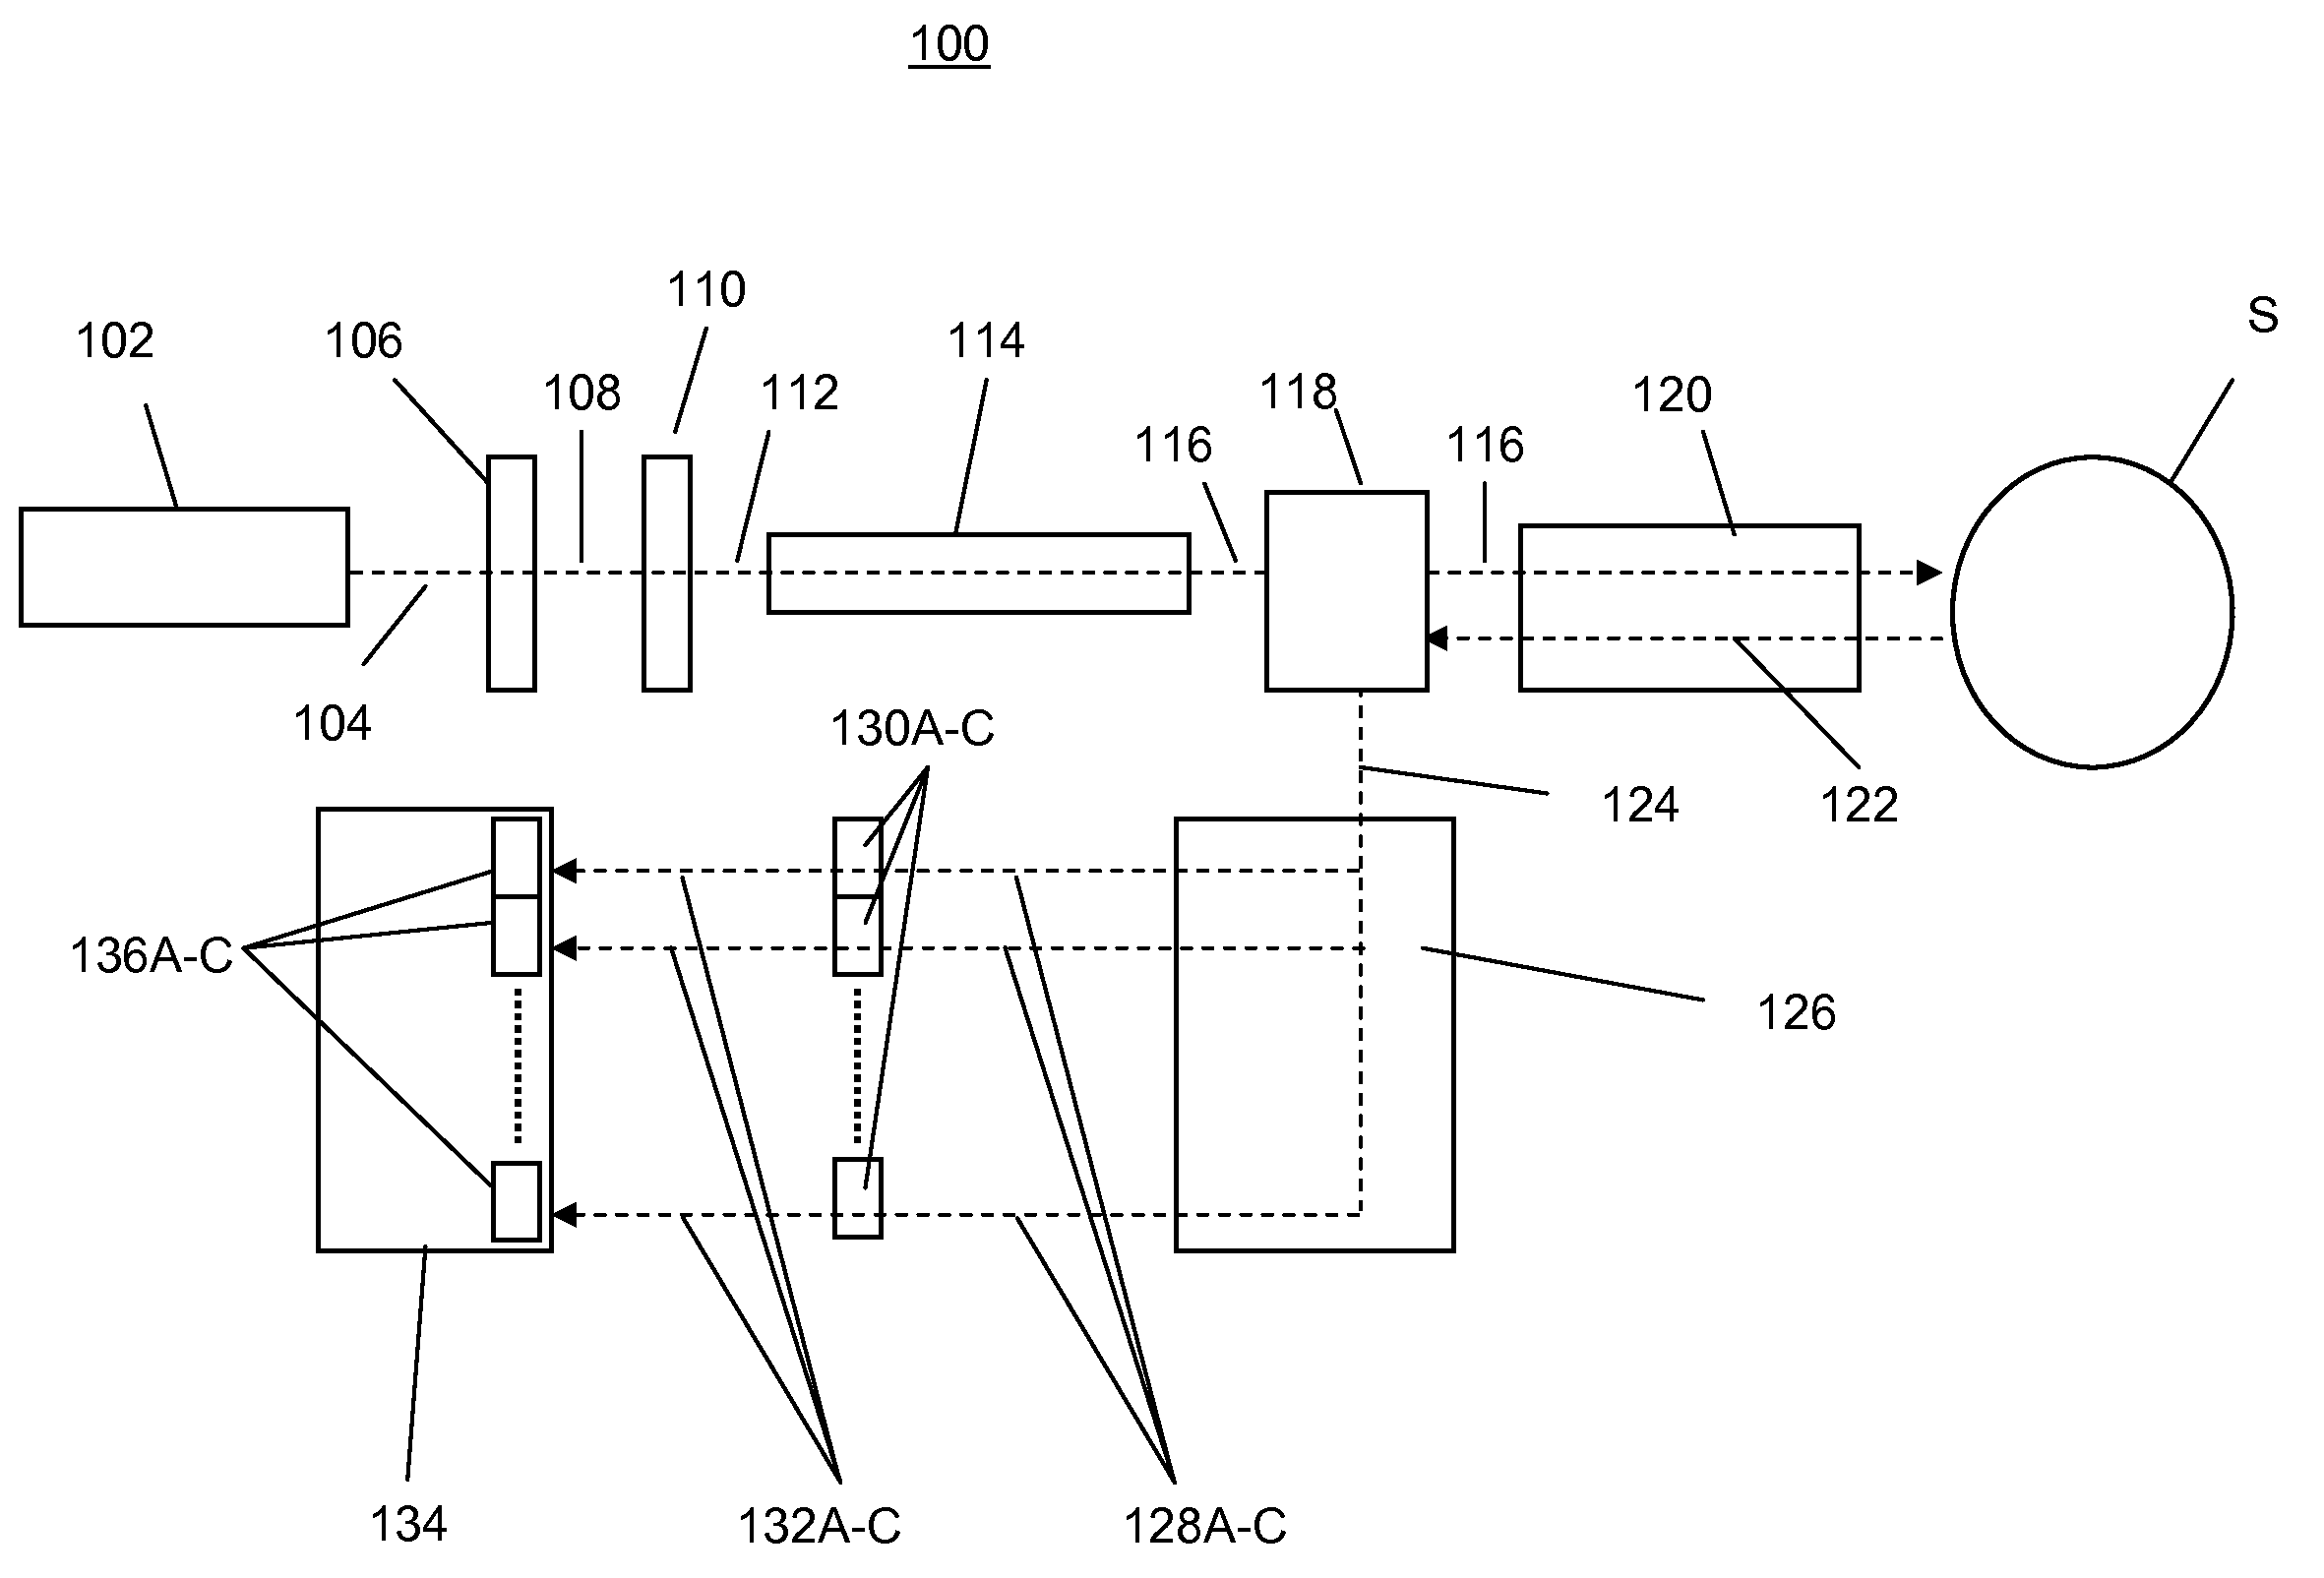
[0006]By utilizing three-dimensional Bragg grating elements the size and cost of a Raman system can be drastically reduced. Three-dimensional Bragg grating elements can be used to produce a stable laser source suitable for Raman analysis out of mass-produced laser diodes that are used, for example, in CD and DVD drives. They can also be used to filter Rayleigh scattering by manufacturing ultra-narrow notch filters using that technology, and to analyze the Raman spectra scattered from the sample material. Both reflective and transmissive Bragg gratings can be used in construction of various embodiments of the disclosed invention.
[0007]By combining three-dimensional Bragg grating elements with mass-produced lasers and detectors, high-quality Raman-scattering sensors can be produced at a reasonable cost, making more accessible their use in everyday applications such as airport security, law enforcement, medical diagnostics, manufacturing quality testing, explosive detection etc. The three-dimensional Bragg grating elements enable the use of much smaller components then used in conventional dispersive Raman systems, which can result in Raman instruments as small as a few cubic centimeters in size. Smaller instruments can be used in Raman sensor devices such as wearable personal detection devices.
[0010]In addition to spectral peaks, the positions of the valleys in the Raman spectrum of the molecular species of interest also carry important information. For that reason one band or multiples bands may be added to the spectrum analysis module that correspond to the position of the spectral valleys. These bands are important to differentiate the Raman signal from its background that may be caused, for example, by fluorescence. These spectral bands allow providing quantitative information about the amount of the detected substance in the sample.

Problems solved by technology

Traditionally, the cost of Raman spectrometers has been driven by the cost of the laser excitation source, the spectrometer that may use notch filters designed to suppress Rayleigh scattering, cooled CCD camera and the signal analysis module that usually requires a fully functional computer, operating system and specialized software.

Method used


Image

  • Compact, low cost Raman monitor for single substances
  • Compact, low cost Raman monitor for single substances
  • Compact, low cost Raman monitor for single substances

Examples


Embodiment Construction

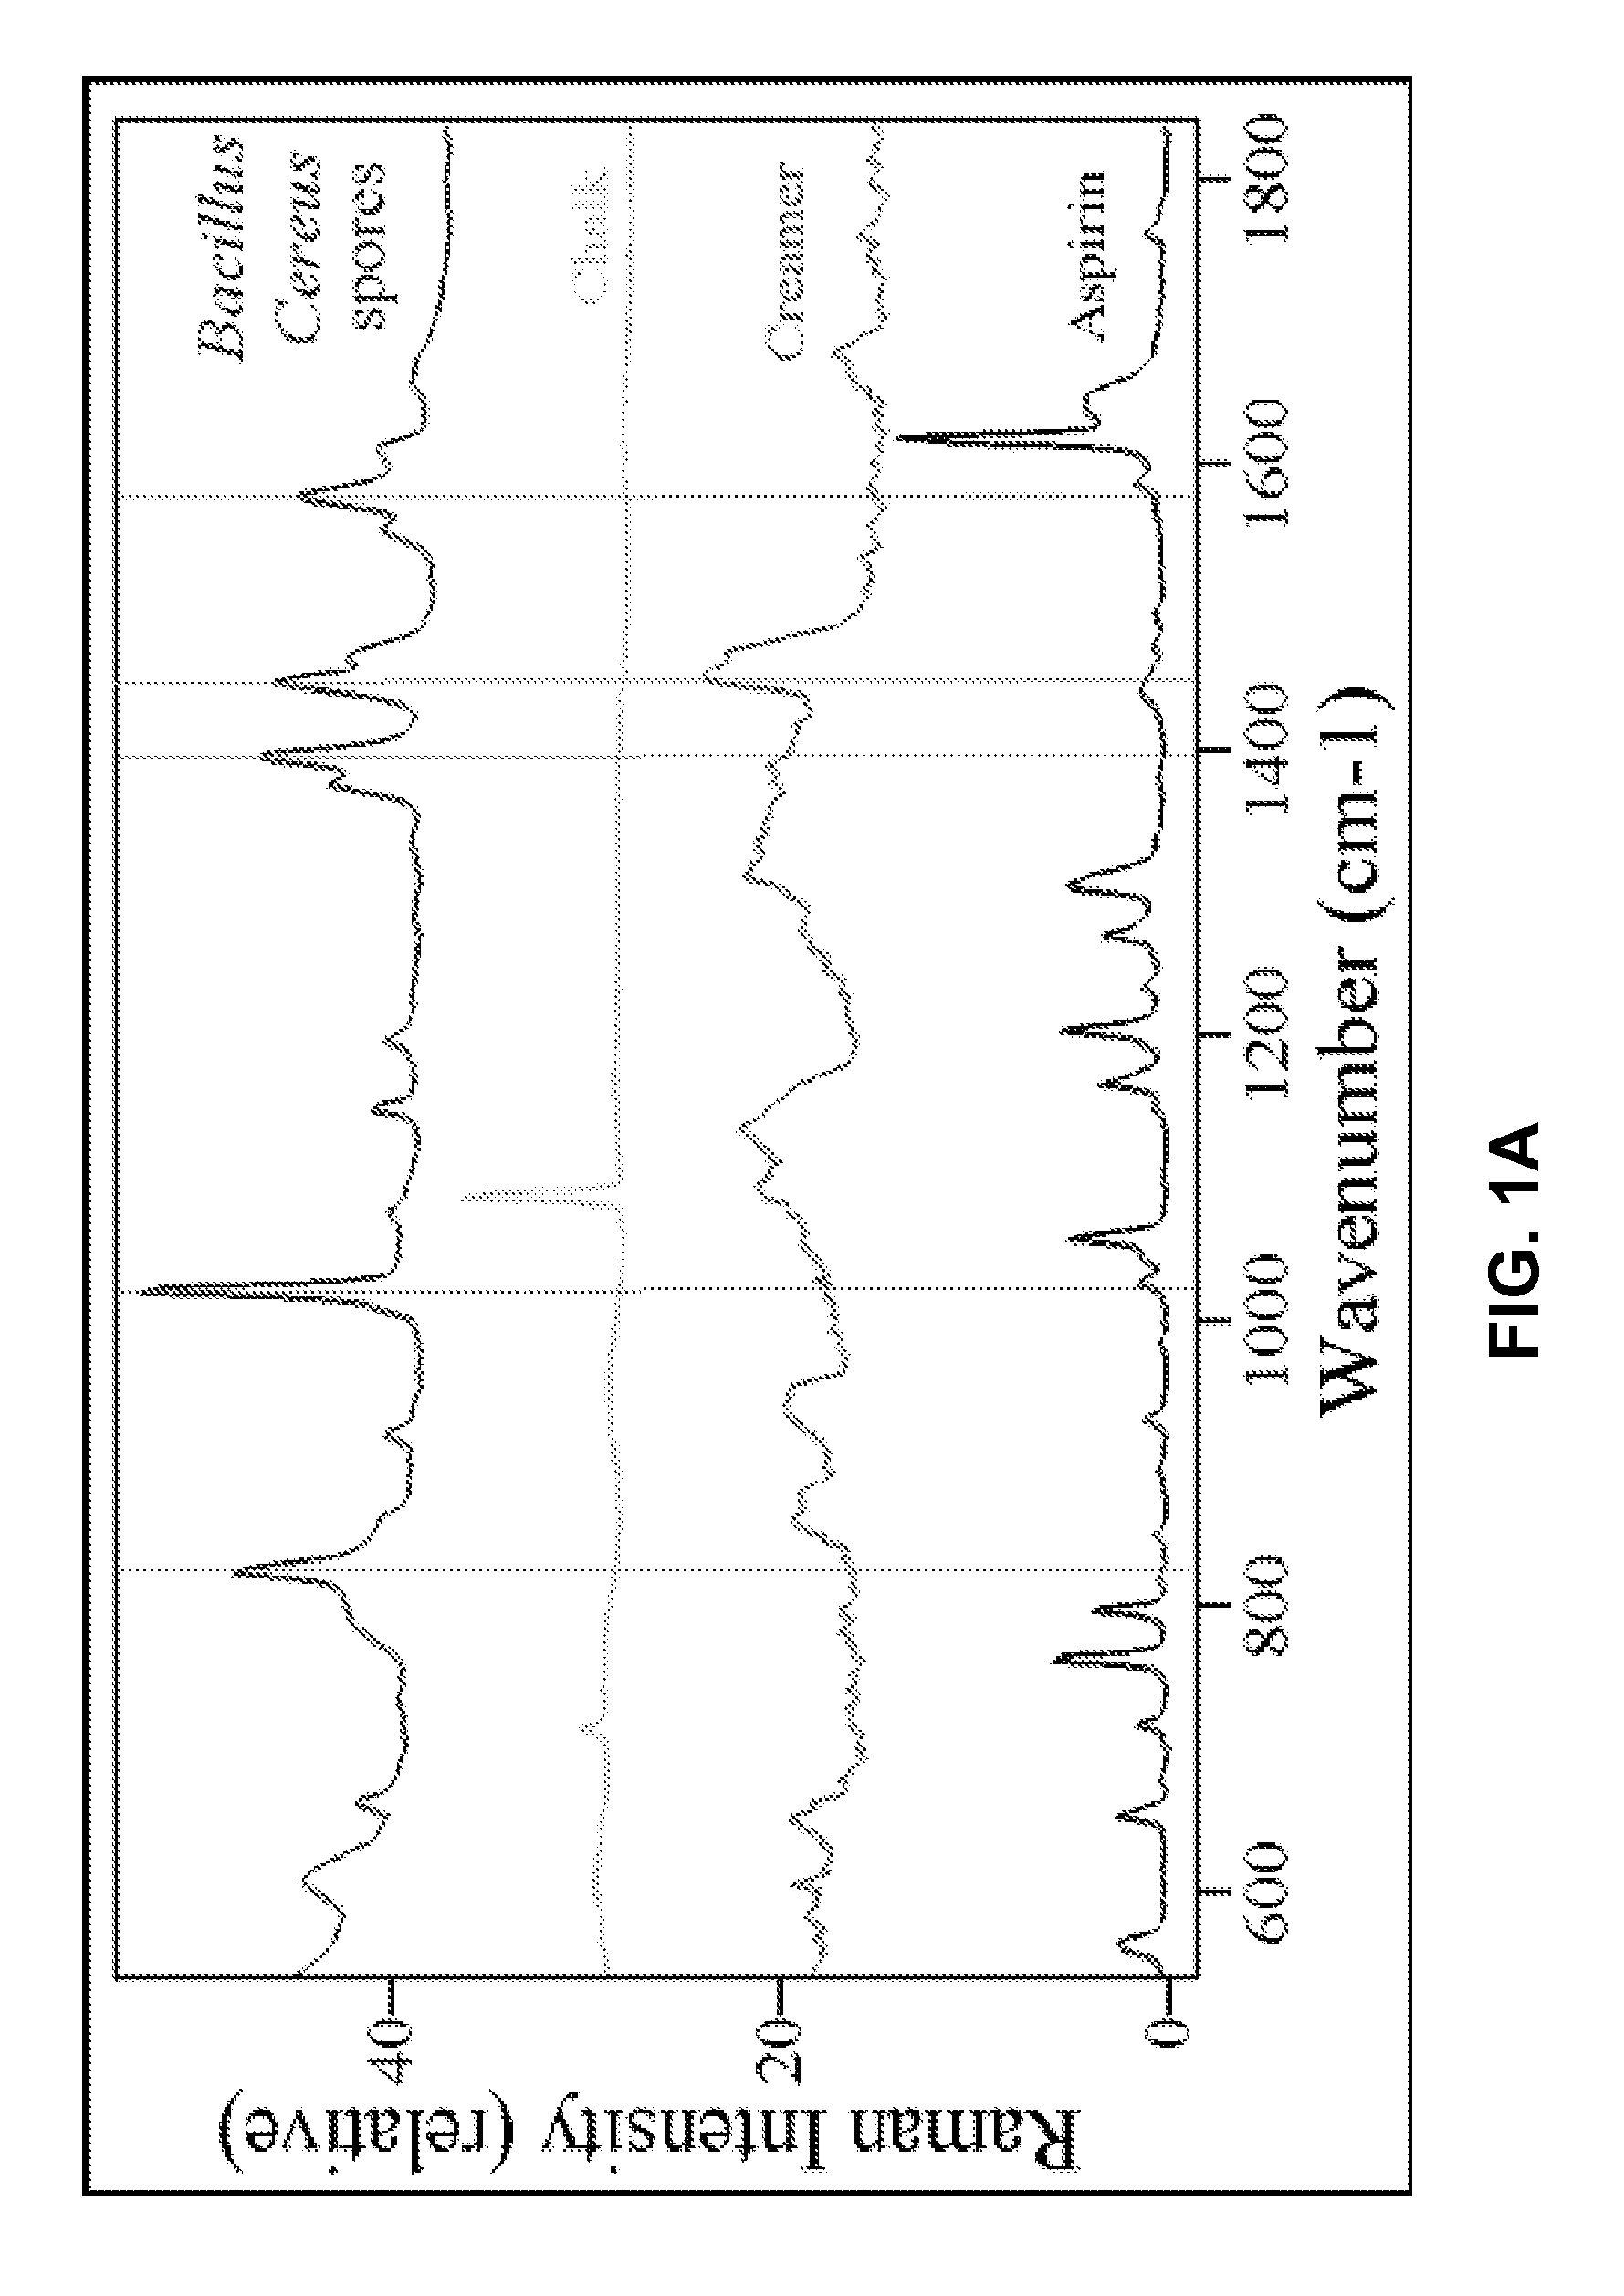
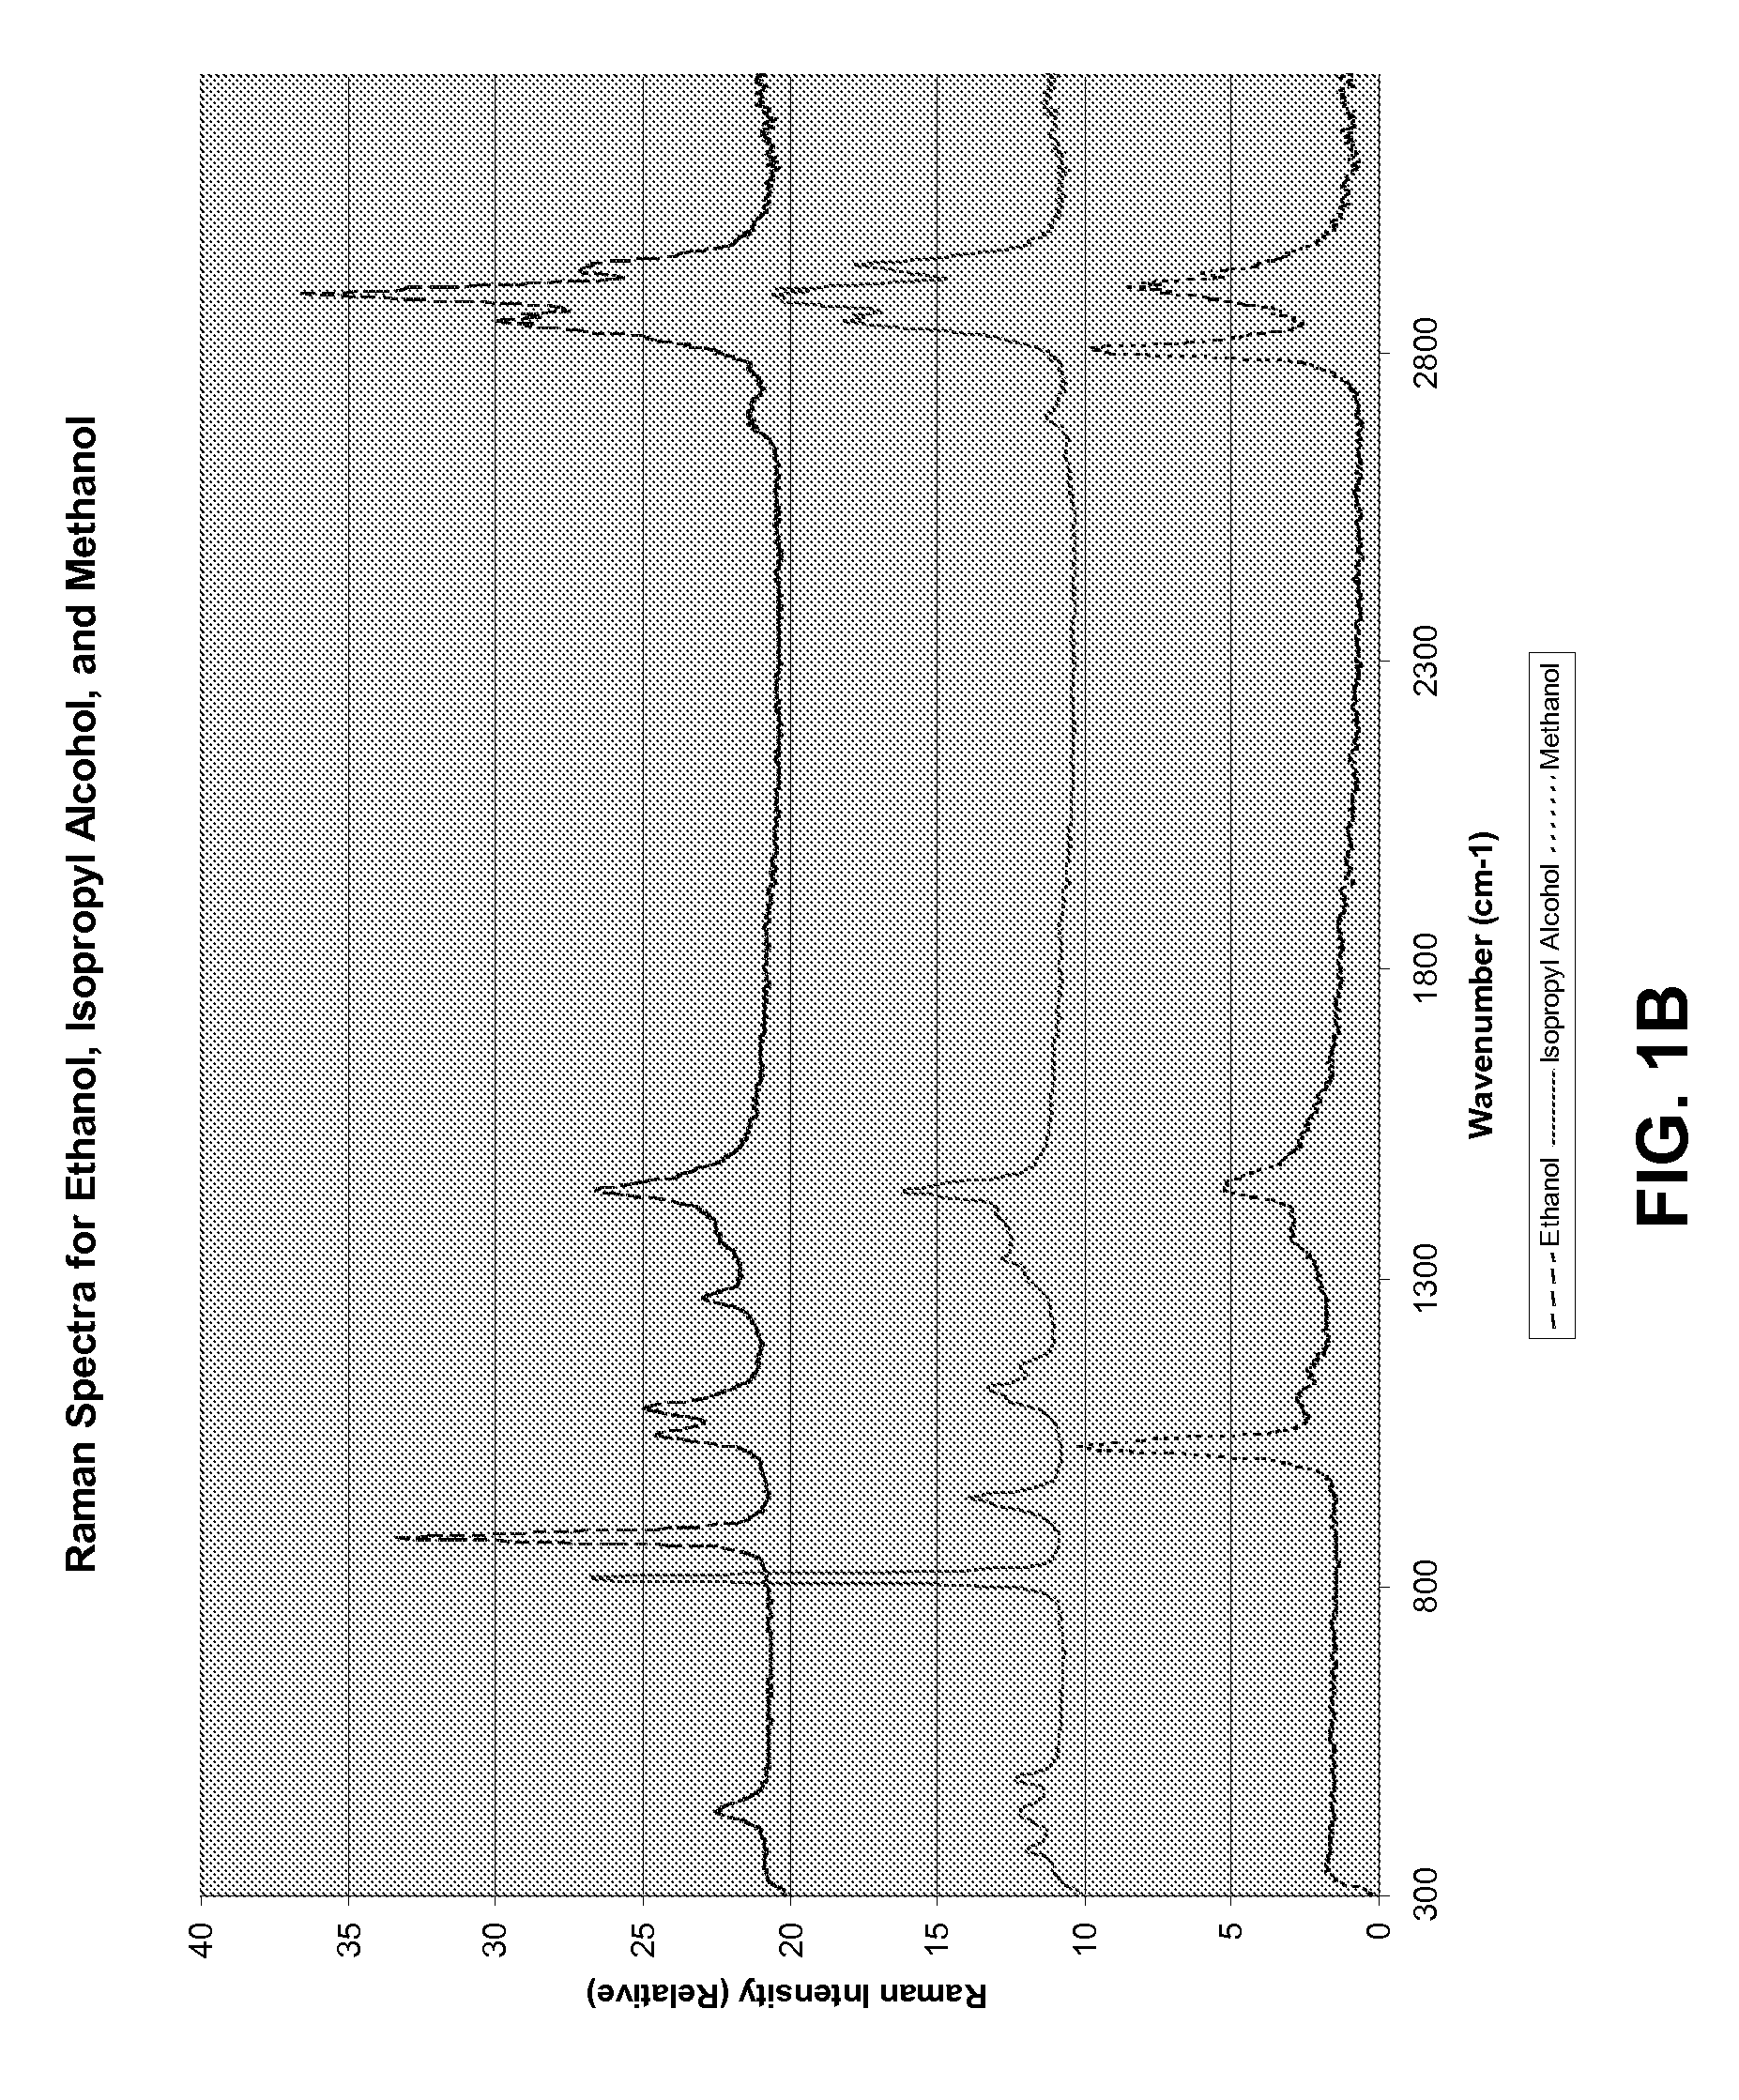
[0019]Detection methods based on Raman analysis have superior specificity since any molecule unique in structure will have a corresponding unique combination of vibrational modes. However, among the multitude of these modes there is usually a significantly smaller number that best distinguish the unique character of the molecule. These modes may correspond to certain collective motions of the atoms unique to their spatial positions relative to each other. These modes may, therefore, be called “Raman signature lines” of a particular molecule. The number of these signature lines may be different for each molecule but it is generally a substantially smaller number than that contained in its entire Raman spectrum. Successful detection of practically any molecule can be carried out by performing correlation of only a small subset of the Raman-active lines in the vibrational spectrum of a sample under study with that of a pure substance of interest.

[0020]This approach greatly simplifies t...


PUM


Abstract

Apparatus for performing Raman analysis may include a laser source module, a beam delivery and signal collection module, a spectrum analysis module, and a digital signal processing module. The laser source module delivers a laser beam to the beam delivery and signal collection module. The beam delivery and signal collection module delivers the laser source beam to a sample, collects Raman scattered light scattered from the sample, and delivers the collected Raman scattered light to the spectrum analysis module. The spectrum analysis module demultiplexes the Raman scattered light into discrete Raman bands of interest, detects the presence of signal energy in each of the Raman bands, and produces a digital signal that is representative of the signal energy present in each of the Raman bands. The digital signal processing module is adapted to perform a Raman analysis of the sample.

Description

CROSS-REFERENCE TO RELATED APPLICATIONS[0001]This application claims benefit under 35 U.S.C. §119(e) of provisional U.S. patent application No. 60 / 854,339, filed Oct. 24, 2006, the disclosure of which is incorporated herein by reference in its entirety.BACKGROUND[0002]Raman analysis is a well-known analytical technique used for structural analysis of molecular species. Raman analysis exploits the inelastic scattering of light by a substance that carries information about the vibrational spectrum of the constituent molecular compounds. The distinguishing feature of Raman analysis compared with, for example, infrared (IR) vibrational analysis is the fact that the optical excitation of the sample is done at a much shorter wavelength of light and the corresponding Raman signal is emitted in the spectral band of a much shorter wavelength than the IR absorption lines of the same sample. This feature allows efficient analysis of aqueous solutions and also makes it possible to construct ver...

Claims


Application Information

Patent Timeline
Patent Type & Authority Patents(United States)
IPC IPC(8): G01J3/44
CPCG01J3/4412G01N21/65G01N21/658G01N2021/1793
Inventor BAN, VLADIMIR SINISAVOLODIN, BORIS LEONIDOVICHSTOKER, NEAL R.
Owner NECSEL INTPROP
Learn More