Use of smith chart to compensate for missing data on network performance at lower frequency

a network performance and data technology, applied in the field of frequency dependent behavior characterization of passive electrical networks, can solve the problems of insufficient theoretical calculations and simulations to predict the behavior of frequency dependent devices, serious inaccuracies in the inverse transformation process, and significant yet unpredictable impact upon impedance matching, etc., to achieve the effect of convenient acquisition

Active Publication Date: 2011-11-08
CADENCE DESIGN SYST INC
View PDF1 Cites 5 Cited by
  • Summary
  • Abstract
  • Description
  • Claims
  • Application Information

AI Technical Summary

Benefits of technology

[0013]Therefore, a Smith Chart technique uses measured high frequency data that can be mo

Problems solved by technology

In higher frequency environments such as video lines, RF and microwave networks, for example, spurious elements like wire inductances, interlayer capacitances and conductor resistances can have a significant yet unpredictable impact upon impedance matching.
As a result, theoretical calculations and simulations may be insufficient to predict frequency dependent device behavior.
If the first data point in the list (which corresponds to the lowest measured frequency) is not an actual DC point, then there can be serious inaccuracies in the inverse transform process.
Unfortunately, in many cases, the lowest frequency at which measured data points are available is much higher than DC.
For signal integrity analysis on digital PCB/Packaging, however, it can be a serious

Method used


Image

  • Use of smith chart to compensate for missing data on network performance at lower frequency
  • Use of smith chart to compensate for missing data on network performance at lower frequency
  • Use of smith chart to compensate for missing data on network performance at lower frequency

Examples


example 1

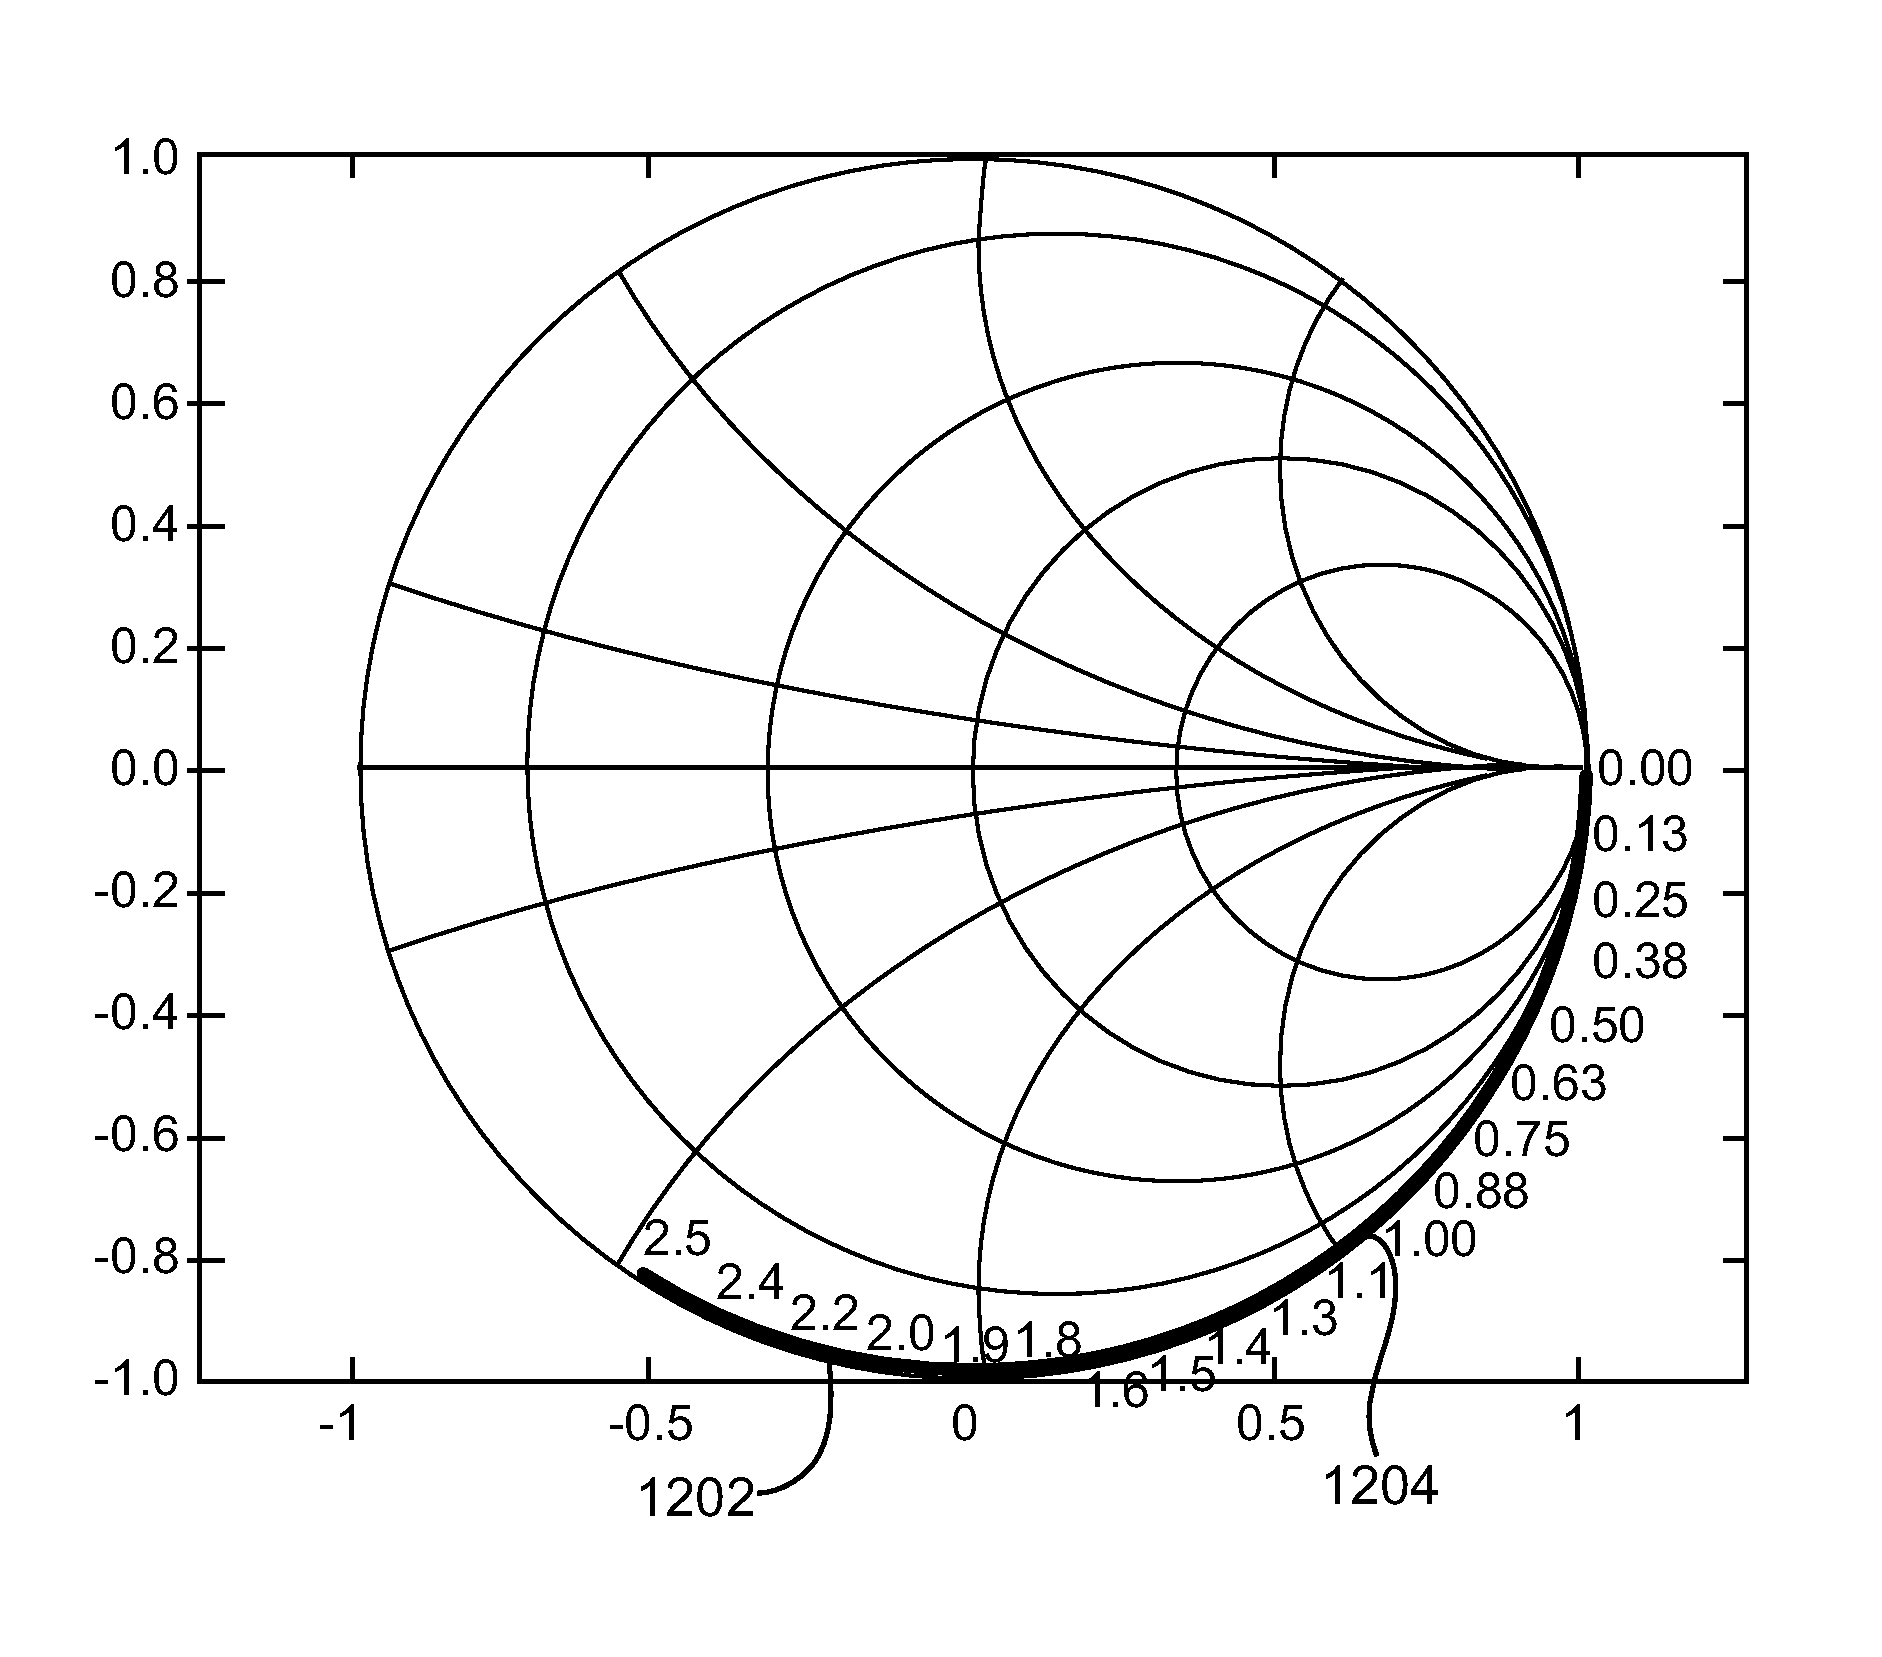
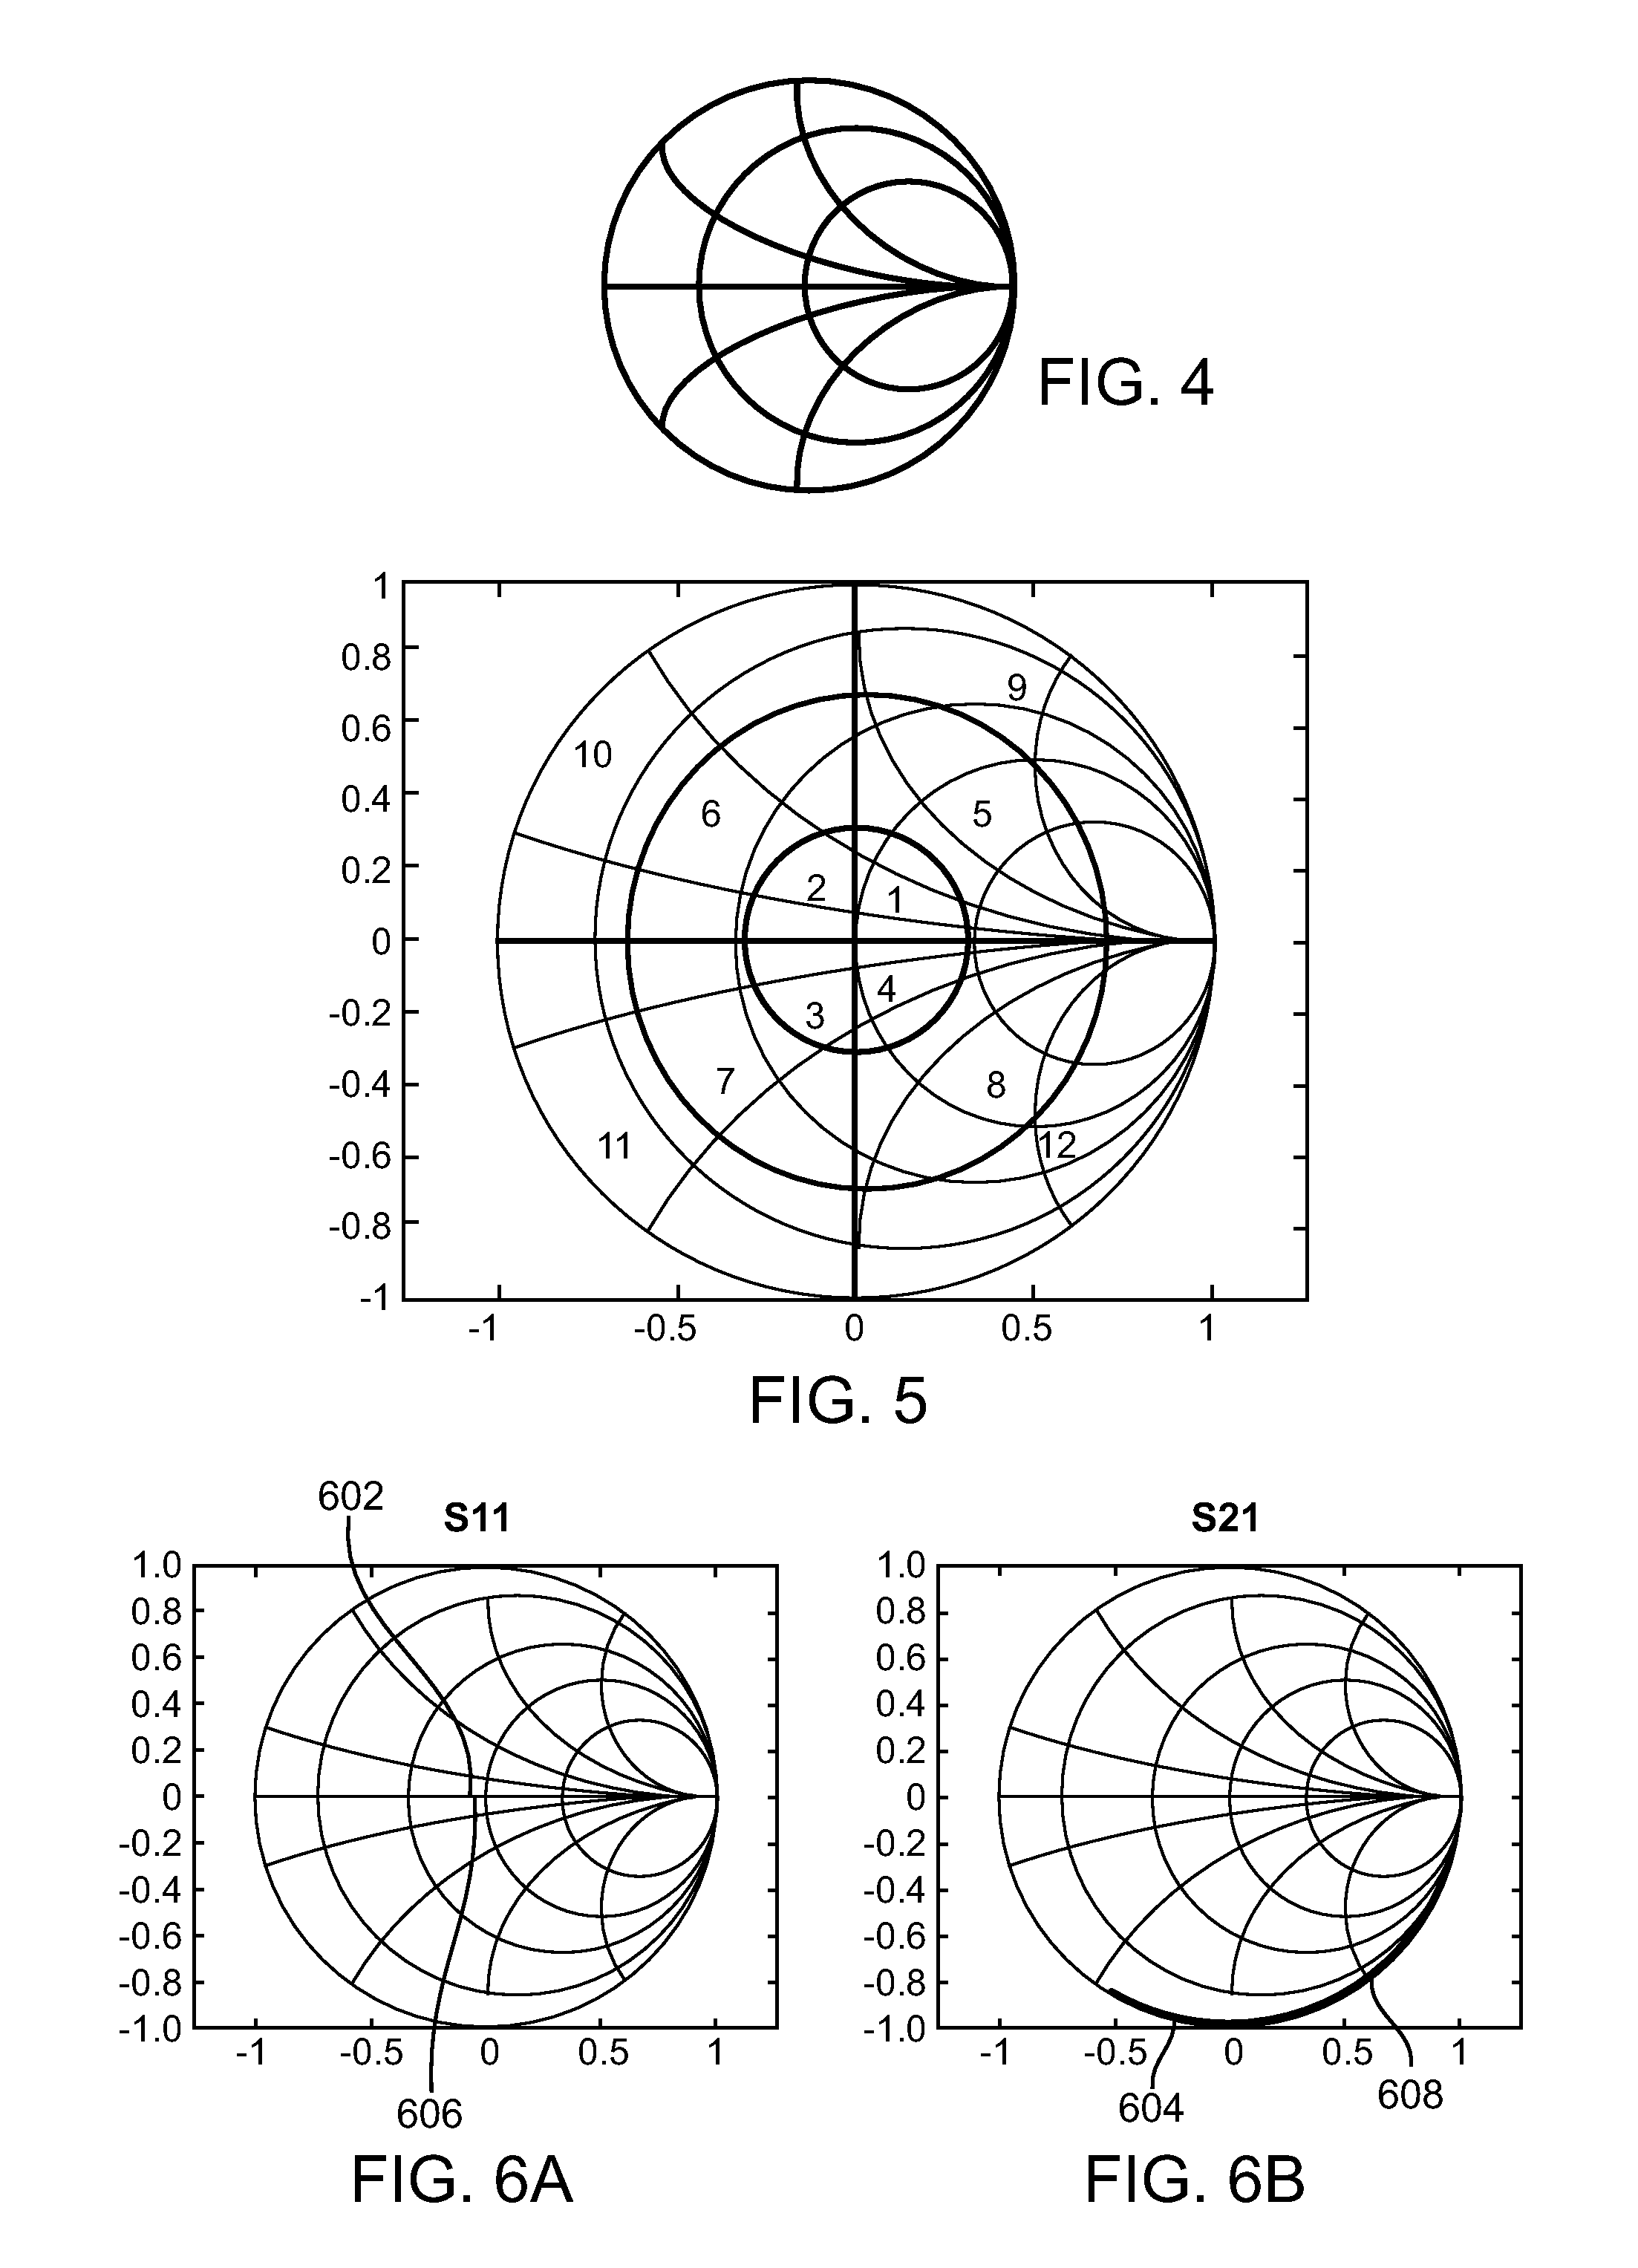
[0091]FIGS. 6A-6B are illustrative graphical representations of Smith Chart plots of S11 and S21 frequency signature traces respectively, for a microstrip transmission line. The S11 plot represents a reflection coefficient at port 1 of the transmission line. The S21 plot represents a transmission ratio from port 1 of the transmission line to port 2 of the transmission line. The solid lines 602, 604 designate first plots comprising measured scattering parameter data. The dashed lines 606, 608 designate second plots comprising extrapolated scattering parameter data using the approximated method. The scattering parameters in this example were obtained via measurements on a network analyzer.

[0092]FIGS. 7A-7B are illustrative time domain transient simulation results corresponding to the frequency domain traces of FIGS. 6A-6B, respectively. The first traces 702, 704 and the second traces 706, 708 correspond to the sending and receiving ends of the transmission line respectively. The no DC...

example 2

[0093]FIGS. 8A-8B are illustrative graphical representations of Smith Chart plots of S11 and S21 frequency signature traces respectively, for I / O channel trace. The solid lines 802, 804 designate first plots comprising measured scattering parameter data. The dashed lines 806, 808 designate second plots comprising extrapolated scattering parameter data using the approximated method. The data in this example were generated using a field solver.

[0094]FIGS. 9A-9B are illustrative time domain transient simulation results corresponding to the frequency domain traces of FIGS. 8A-8B, respectively. The first traces 902, 904 and the second traces 906, 908 correspond to the sending and receiving end of the I / O channel, respectively. The no DC extrapolation result in FIG. 9A shows that the smaller crosstalk waveform does not settle to zero. The result using a DC extrapolation result in accordance with an embodiment of the invention in FIG. 9B shows the smaller waveform settling to zero.

example 3

[0095]FIGS. 10A-10B are illustrative graphical representations of Smith Chart plots of S11 and S21 frequency signature traces respectively, for microstrip line. The solid lines 1002, 1004 designate first plots comprising measured scattering parameter data. The dashed lines 1006, 1008 designate second plots comprising extrapolated scattering parameter data using the approximated method. The measurements in this example were obtained from a network analyzer.

[0096]FIGS. 11A-11B are illustrative time domain transient simulation results corresponding to the frequency domain traces of FIGS. 10A-10B, respectively. The first traces 1102, 1104 and the second traces 1106, 1108 correspond to the sending and receiving end of the microstrip line, respectively. The no DC extrapolation result in FIG. 11A shows that the rising and falling edges of the two waveforms are not sharp and that the falling edge never reaches zero. The result using a DC extrapolation result in accordance with an embodiment...


PUM


Abstract

A method is provided to use a Smith Chart technique to obtain frequency domain network performance information corresponding to a passive network including one or more passive devices comprising: receiving first data representing a first Smith Chart plot of coefficients representing measured mismatch between a source impedance of a network and a load impedance of the network for higher frequency components; and extrapolating a predicted substantially spiral shaped second Smith Chart plot of coefficients based upon the first data, which includes a coefficient representing predicted mismatch between the source impedance of the network and the load impedance of the network for lower frequency components.

Description

BACKGROUND OF THE INVENTION[0001]1. Field of the Invention[0002]The invention relates in general to characterization of frequency dependent behavior of a passive electrical network and more particularly, the use of a Smith Chart to evaluate frequency dependent behavior at lower frequencies.[0003]2. Description of the Related Art[0004]The behavior of electrical networks consisting of passive linear devices such as, connectors, cables, micro strip lines and printed circuit boards may be frequency dependent. Characterization involves measurement of a network's response to excitation by signals at different frequencies. One measure of the frequency response of a network is its complex coefficient, which can be defined in terms of a ratio between a reflected voltage wave and an incident voltage wave. Typically, a network will manifest different coefficient values in response to excitation by signals at different frequencies.[0005]FIG. 1 is an illustrative drawing showing an incident volt...

Claims


Application Information

Patent Timeline
IPC IPC(8): G06F17/50
CPCG06F17/5036G06F2217/36G06F2113/16G06F30/367
Inventor SCHUTT-AINE, JOSETAN, JILINKUMAR, CHIDHAMBARAKRISHNAN
Owner CADENCE DESIGN SYST INC
Why Eureka
Try Eureka