Silicone adhesive composition and method for preparing the same
A composition and organic technology, applied in conductive adhesives, adhesives, etc., can solve problems such as reducing heat transfer, and achieve the effects of low curing temperature, good adhesion, and fast curing rate
- Summary
- Abstract
- Description
- Claims
- Application Information
AI Technical Summary
Problems solved by technology
Method used
Image
Examples
Embodiment 1
[0073] Two separate thermally conductive fillers were used in this formulation. The first filler was Denka DAW-05 alumina filler with an average particle size of 5 μm and a maximum particle size of 24 μm, and the second filler was Sumitomo's AA-04 alumina filler with an average particle size of 0.4-0.6 μm and a maximum particle size of about 1 μm. The thermally conductive filler (604.30 parts total (483.58 parts of the first filler and 120.72 parts of the second filler)) was mixed in a laboratory scale Ross mixer (1 quart capacity) at 140-160°C at approximately 18 rpm for 2.5 hours . The packing is then cooled to 35-45°C, brought to atmospheric pressure and 100 parts of a vinyl terminated polydimethylsiloxane liquid (350-450 cSt, about 0.48 wt% vinyl; SL6000-D1 from GE Silicones ) and 0.71 parts pigment masterbatch (50 wt% carbon black and 50 wt% 10,000 cSt vinyl terminated polydimethylsiloxane fluid; M-8016 from GE Toshiba) and a portion of hydride fluid—1.04 parts hydride ...
Embodiment 3
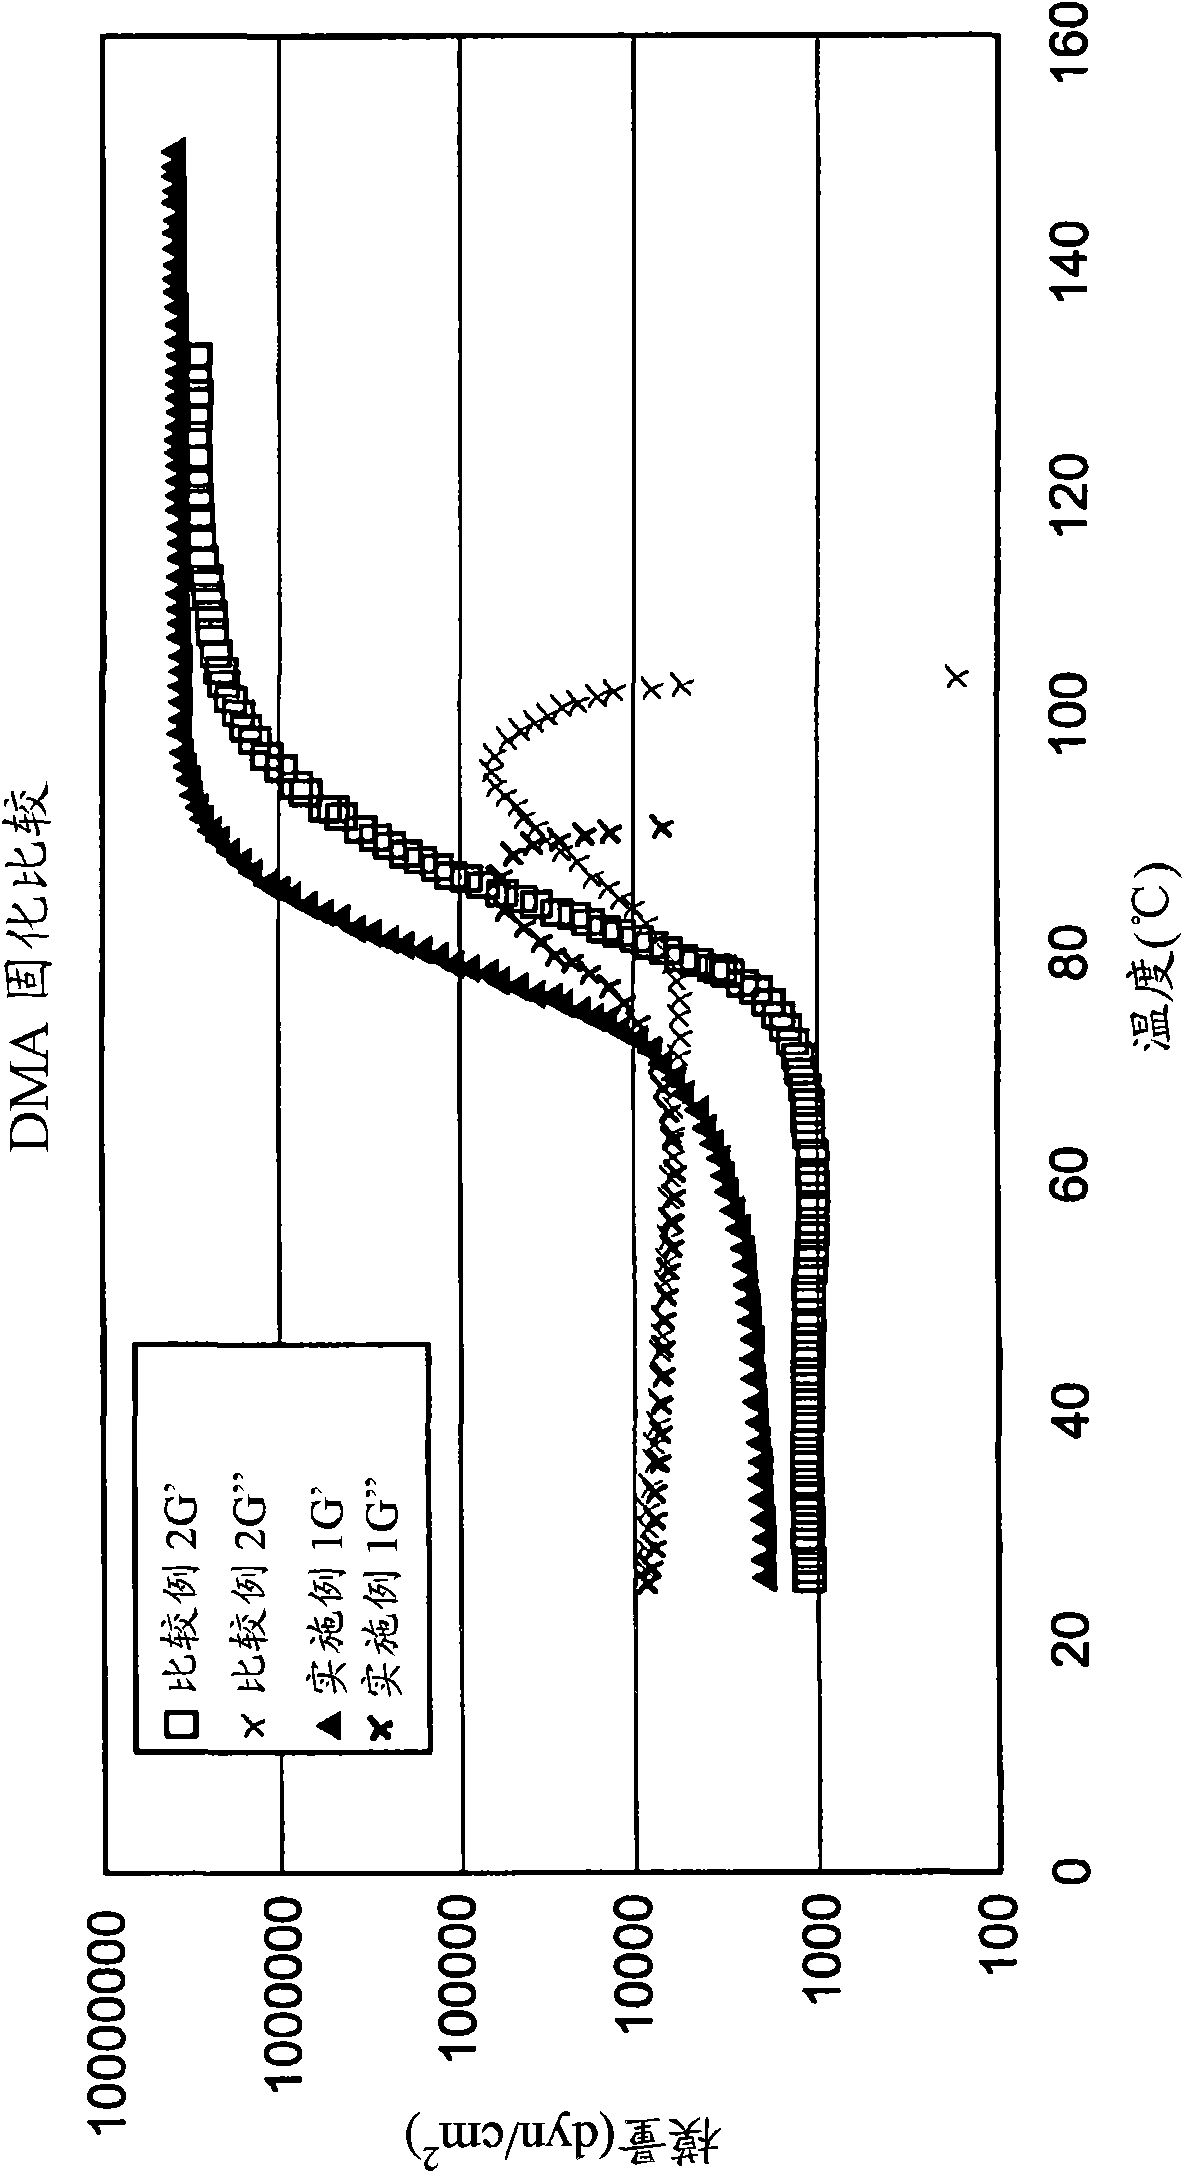
[0077] Dynamic Mechanical Analysis (DMA) was performed using a TA Instruments Ares-LS2 comparing two samples with parallel plate geometry (Example 1 vs Comparative Example 2) when the temperature was ramped from 25°C to 150°C at a rate of 2°C / min ) gel point. See Table 1 and figure 1 .
[0078] The storage (elastic) modulus G' is directly measured by the molecular weight in the polymer system. When curing starts, the molecular weight increases and the G' value increases. When the G' curves of Example 1 and Comparative Example 2 are compared, it is shown that the increase in G' of the Example 1 sample occurs at a much lower temperature than that of the Comparative Example 2 sample. Beginning at about 30°C, the slope of the G' line for the Example 1 sample is positive. In contrast, the slope of the G' curve of the sample of Comparative Example 2 remained at 0 up to about 65°C. This difference highlights the fact that the Example 1 sample starts its curing reaction at a much...
Embodiment 4
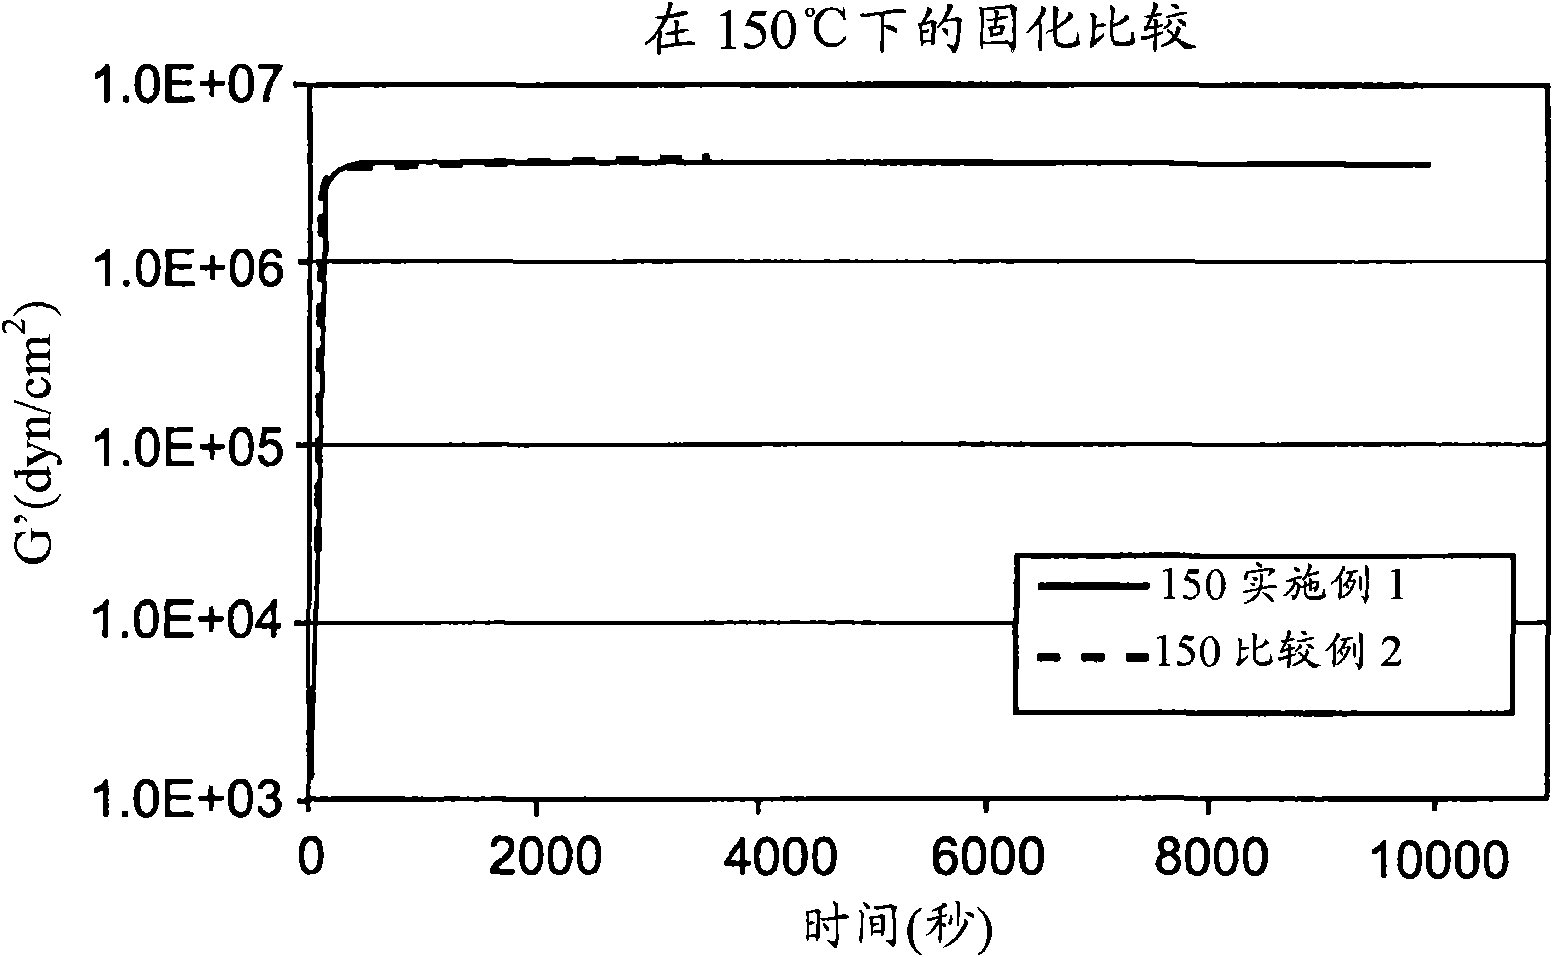
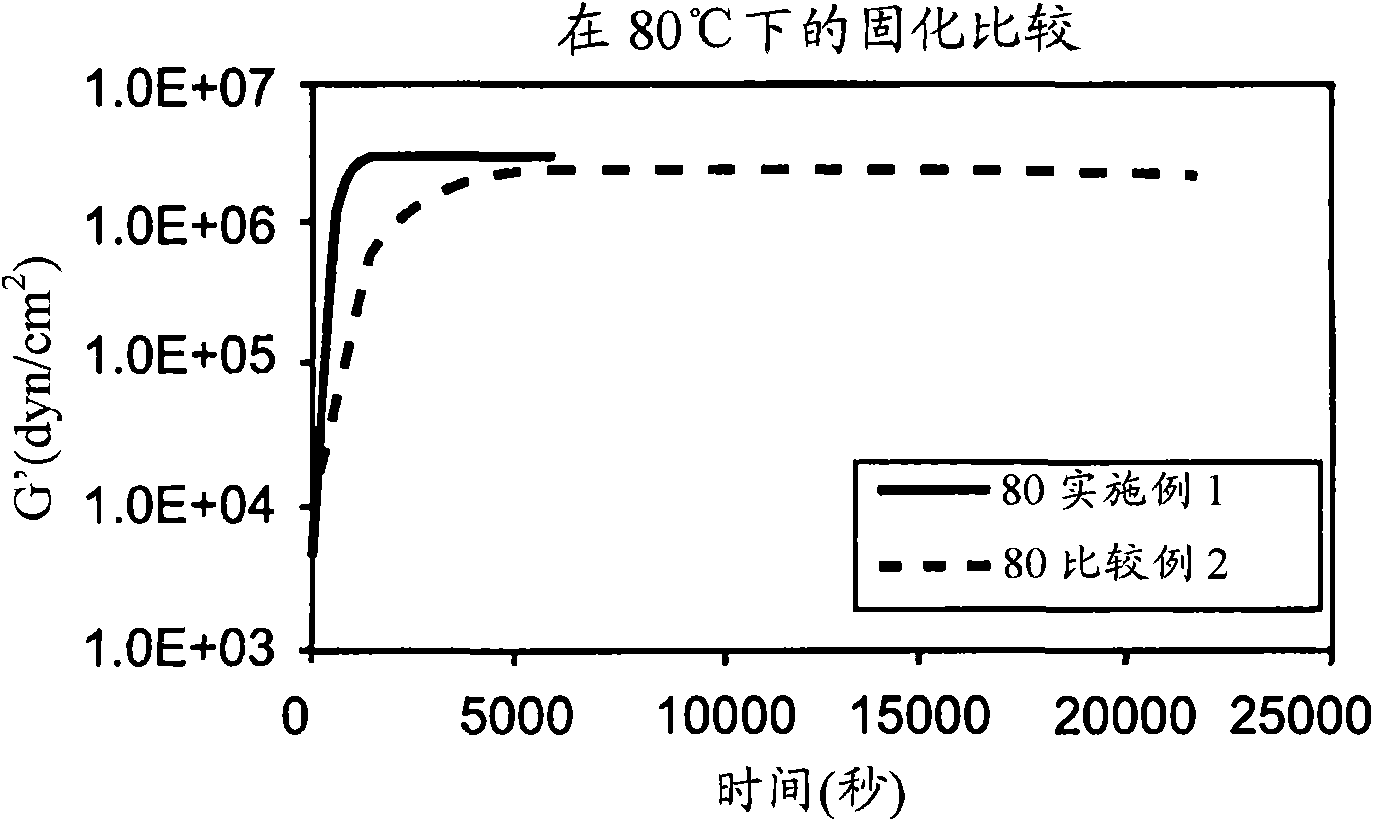
[0084] This example tests the time required to achieve complete cure as a function of different curing temperatures. The G'G" crossing points indicate the onset of cure, and complete cure is indicated by the plateau of the storage modulus (G') in the DMA test. Table 2 below shows the final G' value at the end of the isothermal hold (Final G') vs. The maximum G' value (Maximum G') obtained for each run is substantially the same. The maximum G' value is used in calculations to determine the degree of cure.
[0085] Table 2 shows that when the curing temperature is decreased from 150°C to 80°C, the maximum G' value of the sample of Example 1 is only reduced by 8%. This equivalent reduction in cure temperature for the Comparative Example 2 sample resulted in a 26% reduction in the maximum G' value. A lower G' plateau value indicates a decrease in crosslink density. The greater the reduction in G', the greater the reduction in crosslink density and the less the material cures. T...
PUM
| Property | Measurement | Unit |
|---|---|---|
| particle diameter | aaaaa | aaaaa |
| particle size | aaaaa | aaaaa |
| particle size | aaaaa | aaaaa |
Abstract
Description
Claims
Application Information
 - R&D
- Intellectual Property
- Life Sciences
- Materials
- Tech Scout
- Unparalleled Data Quality
- Higher Quality Content
- 60% Fewer Hallucinations
Browse by: Latest US Patents, China's latest patents, Technical Efficacy Thesaurus, Application Domain, Technology Topic, Popular Technical Reports.
© 2025 PatSnap. All rights reserved.Legal|Privacy policy|Modern Slavery Act Transparency Statement|Sitemap|About US| Contact US: help@patsnap.com


