Measuring method of aluminum alloy CCT (Continuous Cooling Transformation) diagram

A determination method and technology of aluminum alloy, applied in the investigation stage/state change and other directions, can solve the problems of inability to shield the electrode contact measurement accuracy, unstable relative resistance value change data, inability to accurately reflect the phase transformation process, etc., to reach the phase transition point. Accurate and reliable, cost and time saving, fast results

Active Publication Date: 2010-07-28
CENT SOUTH UNIV
View PDF0 Cites 10 Cited by
  • Summary
  • Abstract
  • Description
  • Claims
  • Application Information

AI Technical Summary

Problems solved by technology

Li Hongying and others measured the CCT diagrams of 2A97 and 7475 aluminum alloys by using the continuous relative resistance method combined with DTA, Xrd, microstructure quantitative analysis and other methods. Relative change (R T -R 0 ) / R 0 According to the temperature change curve, the phase change point can be judged. Since the double-arm bridge measurement circuit passes a weak current, it is difficult to eliminate the oxide film with high resistance, and it cannot shield the influence of electrode contact on the measurement accuracy. The measured resistance shows The value is not accurate, it cannot accurately reflect the phase change process, and the relative resistance value change is unstable during the measurement process, and the measured resistance change value is also small, which will bring errors when drawing the CCT diagram. At present, it can be more accurate The method of measuring the CCT map of aluminum alloy has not been reported so far

Method used


Image

  • Measuring method of aluminum alloy CCT (Continuous Cooling Transformation) diagram
  • Measuring method of aluminum alloy CCT (Continuous Cooling Transformation) diagram
  • Measuring method of aluminum alloy CCT (Continuous Cooling Transformation) diagram

Examples


Embodiment 1

[0030] Example 1: Measuring alloy grade: 7A04 aluminum alloy

[0031] Step 1: Determination of aluminum alloy voltage and temperature change data with time under different cooling systems

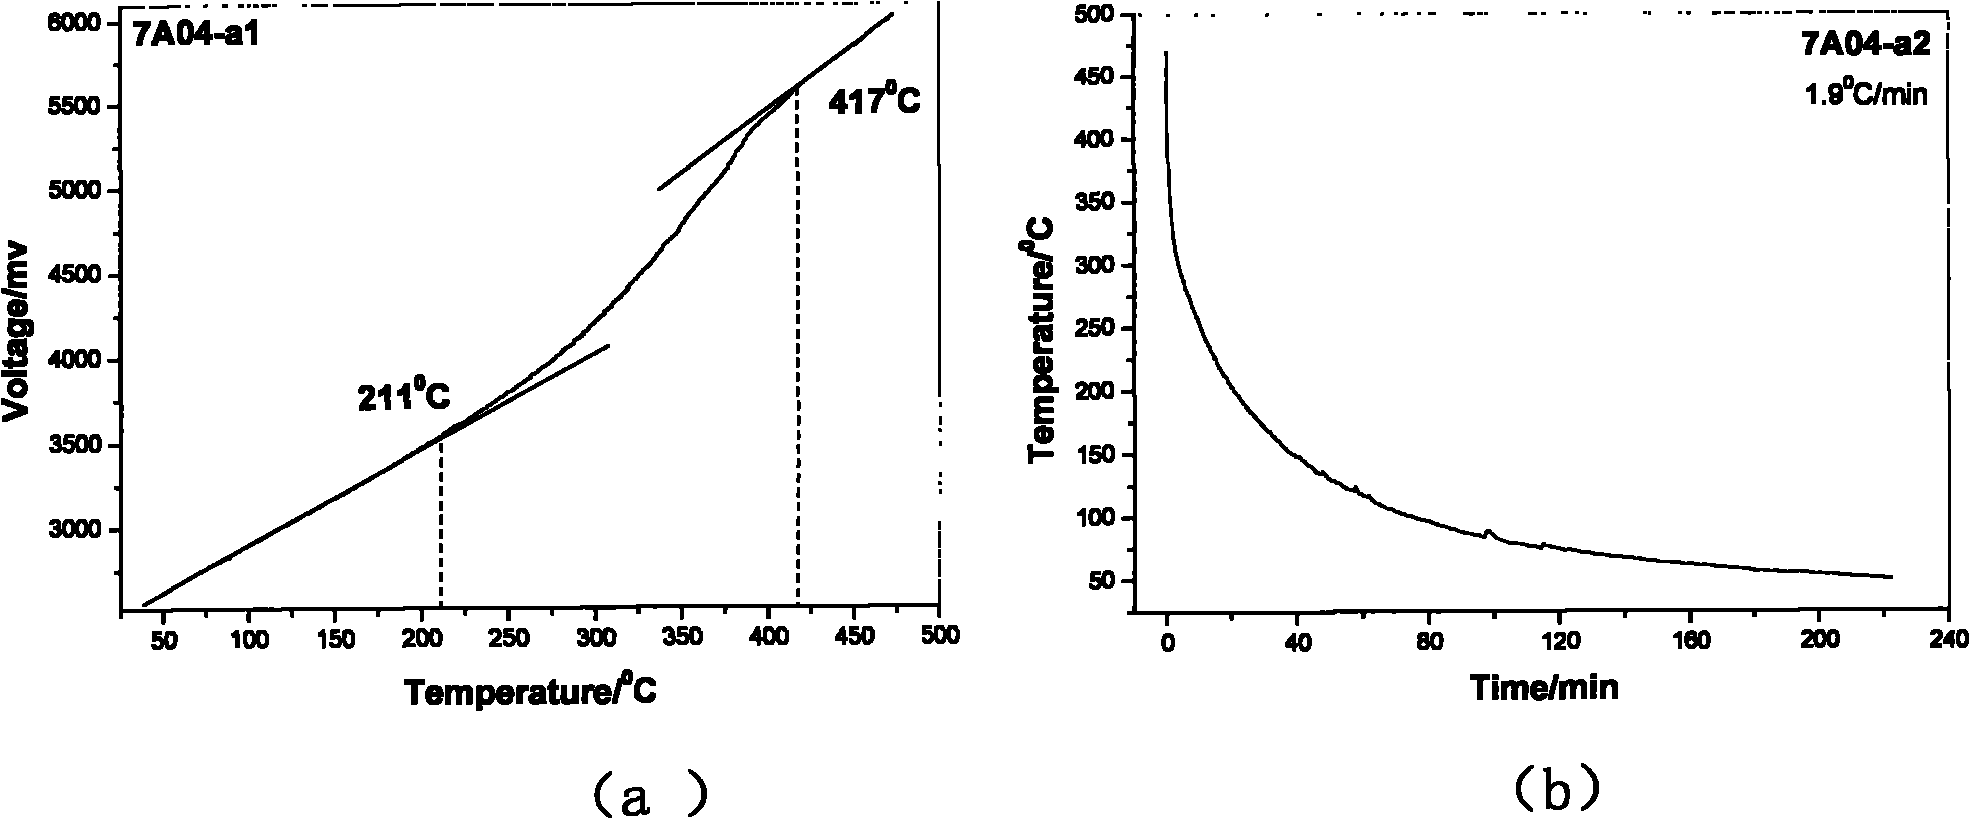
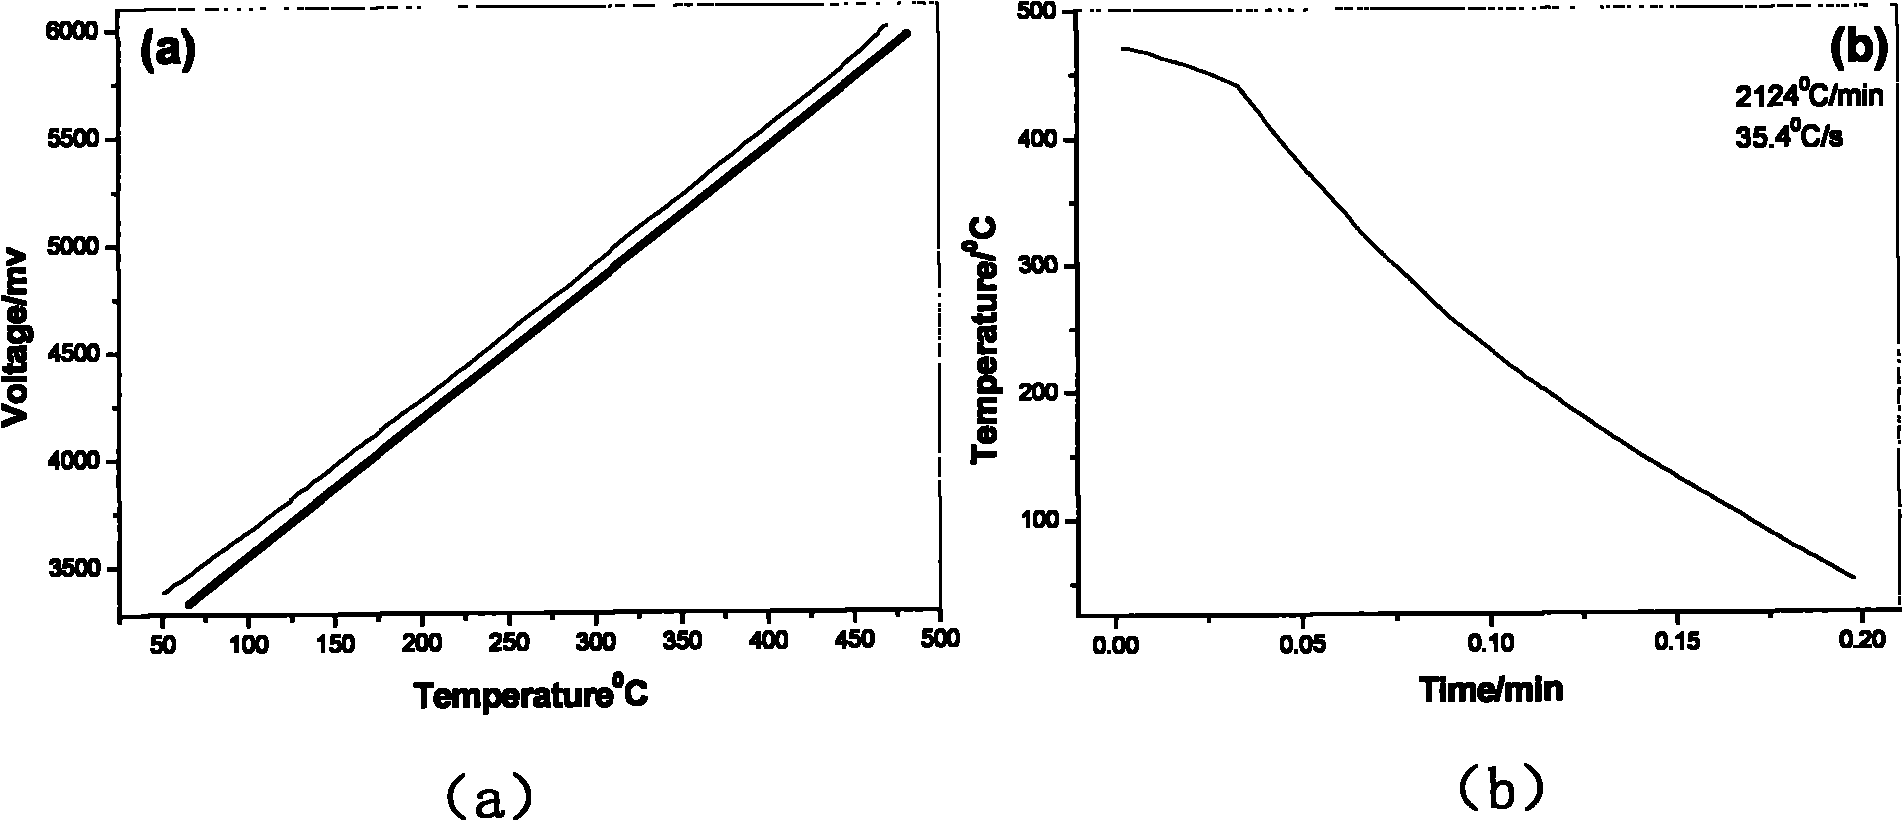
[0032] Select 470°C / 1h as the solid solution process for 7A04 alloy CCT diagram measurement, pass a constant current of 5A to the fully solidified aluminum alloy sample, and adopt furnace cooling, air cooling, air cooling, and liquid nitrogen cooling systems for aluminum alloy samples. Cooling, using dynamic resistance strain gauges and thermocouples to measure the data of sample voltage and temperature changing with time in real time;

[0033] Step 2: According to the data obtained in the first step, draw the voltage-temperature curve and temperature-time curve during the cooling process of the sample; among them, the curve under the partial cooling system is shown in the appendix figure 1 a. attached figure 1 b. attached figure 2 a. attached figure 2 b;

[0034] The third step: det...

Embodiment 2

[0041] Embodiment 2: Measuring alloy grade: 01970 aluminum alloy

[0042] Step 1: Determination of aluminum alloy voltage and temperature change data with time under different cooling systems

[0043] Select 470°C / 1h as the solid solution process for 01970 alloy CCT map measurement, pass a constant current of 5A to the fully solid-soluted aluminum alloy sample, and adopt furnace cooling, air cooling, air cooling, and liquid nitrogen cooling systems for aluminum alloy samples. Cooling, using dynamic resistance strain gauges and thermocouples to measure the data of sample voltage and temperature changing with time in real time;

[0044] Step 2: According to the data obtained in the first step, draw the voltage-temperature curve and temperature-time curve during the cooling process of the sample; among them, the curve under the partial cooling system is shown in the appendix Figure 4 a. attached Figure 4 b. attached Figure 5 a. attached Figure 5 b;

[0045] The third ste...

Embodiment 3

[0052] Embodiment 3: Measuring alloy grade: 6061 aluminum alloy

[0053] Step 1: Determination of aluminum alloy voltage and temperature change data with time under different cooling systems

[0054] Select 530°C / 3h as the solid solution process for 6061 alloy CCT map measurement, pass a constant current of 5A to the fully solidified aluminum alloy sample, and adopt furnace cooling, air cooling, air cooling, and liquid nitrogen cooling systems for aluminum alloy samples. Cooling, using dynamic resistance strain gauges and thermocouples to measure the data of sample voltage and temperature changing with time in real time;

[0055] Step 2: According to the data obtained in the first step, draw the voltage-temperature curve and temperature-time curve during the cooling process of the sample; among them, the curve under the partial cooling system is shown in the appendix Figure 7 a. attached Figure 7 b. attached Figure 8 a. attached Figure 8 b;

[0056] The third step: de...


PUM


Abstract

The invention discloses a measuring method of an aluminum alloy CCT (Continuous Cooling Transformation) diagram, which comprises the following steps: 1. measuring data of aluminum alloy voltage and temperature along with the change of time under various cooling regimes; 2. drawing a voltage-temperature curve and a temperature-time curve in the cooling process of a sample according to the data obtained by the first step; 3. determining phase transformation points: determining the temperatures of phase transformation starting points and phase transformation ending points of the aluminum alloy sample according to the change position of the slope of the voltage-temperature curve; and 4. drawing the CCT diagram: drawing the temperature-time curve of the sample obtained at different cooling speeds to a logarithmic coordinate system, labeling the phase transformation starting points and the phase transformation ending points on corresponding temperature-time curves according to the phase transformation starting points and the phase transformation ending points determined according to the voltage-temperature curve, and connecting the phase transformation starting points and the phase transformation ending points by lines to obtain the CCT diagram of the sample alloy. The method has the advantages of strong operability, simple process, simple operation, high speed, dense acquired points, measuring material saving and higher measuring precision, fills up the blank of a measuring technology of the CCT diagram of the aluminum alloy and is suitable for scientific research units to measure the phase transformation points of the aluminum alloy and the CCT diagram.

Description

technical field [0001] The invention discloses a method for measuring a CCT map of an aluminum alloy, belonging to the technical field of metal material testing. Background technique [0002] Thermal processing and heat treatment processes are very important to improve the microstructure and properties of alloys. After thermal processing and heat treatment, metal materials must adopt appropriate cooling medium and cooling speed, and control the type, size, quantity and distribution of the second phase by controlling the cooling rate. , so as to obtain specific organization and performance. The continuous cooling transformation kinetics curve (CCT diagram) is the basis for studying solid-state phase transition and formulating heat treatment processes. The appropriate cooling medium and cooling rate can be determined by using the CCT diagram. [0003] The method of measuring the continuous cooling transformation kinetic curve of iron and steel materials is becoming more and m...

Claims


Application Information

Patent Timeline
Patent Type & Authority Applications(China)
IPC IPC(8): G01N25/02
Inventor 李红英赵延阔胡琳娜王晓峰唐宜
Owner CENT SOUTH UNIV
Why Eureka
Try Eureka