Method for rapidly identifying scab resistance of wheat
A technology for wheat scab and wheat scab, which is applied in the directions of microorganism-based methods, biochemical equipment and methods, and microbial determination/inspection, and can solve the problem of increasing identification operation steps, inability to perform in vivo identification, and inability to guide production. Practice and other problems, to achieve the effect of more identification results, fast, efficient and accurate identification, and simple response methods
- Summary
- Abstract
- Description
- Claims
- Application Information
AI Technical Summary
Problems solved by technology
Method used
Image
Examples
Embodiment 1
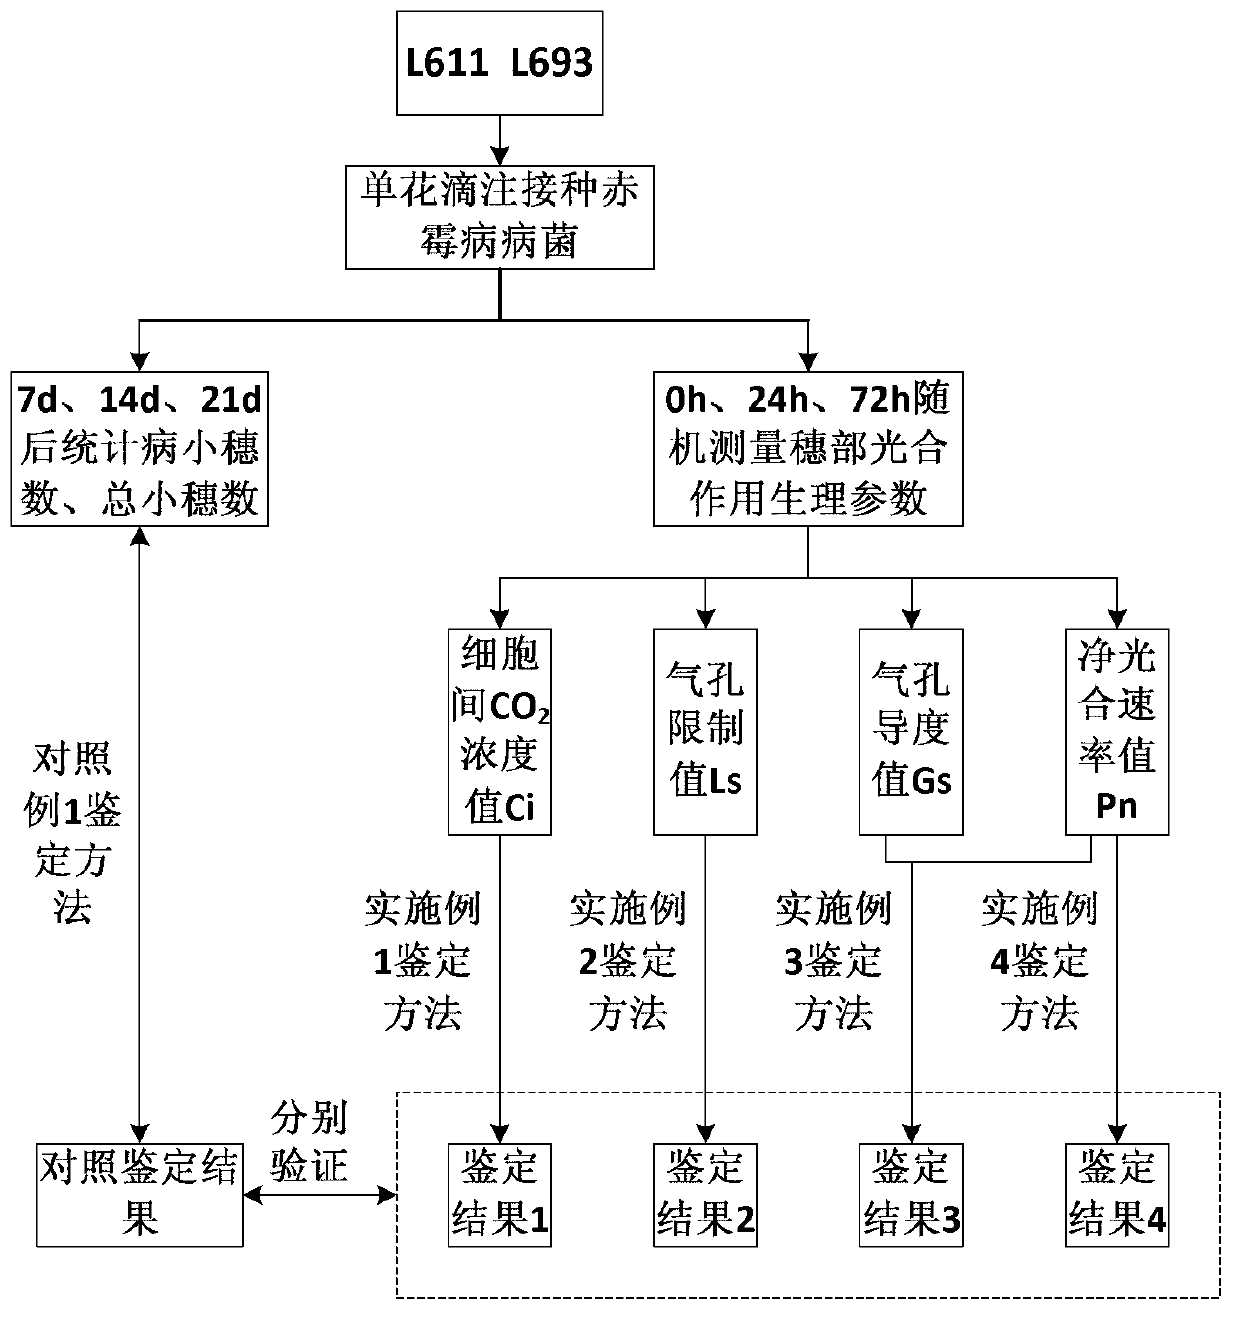
[0065] intercellular CO 2 The concentration value Ci was used to identify the resistance of wheat materials to head blight. figure 1 Shown is the technical circuit diagram.
[0066] 1. Plant material and planting
[0067] Resistant material: wheat head blight resistant strain L693
[0068] Susceptible material: Wheat head blight susceptible strain L661
[0069] L693 and L661 were sown in the experimental field of Sichuan Agricultural University Farm in Wenjiang District, Chengdu at the end of October 2012. The row length is 3m, the row spacing is 0.5m, and the plant spacing is 0.3m.
[0070] 2. Field inoculation of wheat head blight
[0071] Single-flower instillation: select 45 plants for each material, inoculate one panicle per plant and mark it with a hang tag. In the second and fourth florets of a pair of spikelets in the middle of the ear at the flowering stage, inject 5 μL of conidia of Fusarium rubella with a pipette gun (concentration: 200 μL -1), cover the whol...
Embodiment 2
[0080] The resistance of wheat materials to head blight was identified by using the limit value Ls of the stomata in the panicle of the plant.
[0081] Parts 1, 2, and 3 of the identification process are the same as in Example 1.
[0082] 4. Correlation analysis between statistics of Ls value and resistance level
[0083] Table 2 Ls value and significance test of panicles of L661 and L693
[0084]
[0085] Table 2 shows that at 24h and 72h after inoculation, the L693Ls value did not change significantly before and after inoculation (P>0.05), and it was identified as a resistant material; the L661Ls value decreased significantly (P<0.05), and it was identified as a susceptible material. The identification result is consistent with the identification result recorded in Comparative Example 1.
Embodiment 3
[0087] The relative change rate of stomatal conductance value Gs and net photosynthetic rate value Pn at the panicle of the plant was used to identify the resistance of wheat materials to head blight.
[0088] Parts 1, 2, and 3 of the identification process are the same as in Example 1.
[0089] 4. Correlation analysis between statistics of Gs value and Pn value and resistance level
[0090] Table 3 L661 and L693 ear Gs and Pn values and significance test
[0091]
[0092]
[0093] Table 3 shows that at 24h and 72h after inoculation, the change of Gs value and Pn value of L693 is synchronized, that is, the T test value (or P test value) is roughly the same, and it is identified as a resistant material; the change of Gs value and Pn value of L661 is not synchronized (Specifically, Gs>Pn in this embodiment) is identified as a susceptible material. The identification result is consistent with the identification result recorded in Comparative Example 1.
PUM
 Abstract
Description
Claims
Application Information
 - R&D
- Intellectual Property
- Life Sciences
- Materials
- Tech Scout
- Unparalleled Data Quality
- Higher Quality Content
- 60% Fewer Hallucinations
Browse by: Latest US Patents, China's latest patents, Technical Efficacy Thesaurus, Application Domain, Technology Topic, Popular Technical Reports.
© 2025 PatSnap. All rights reserved.Legal|Privacy policy|Modern Slavery Act Transparency Statement|Sitemap|About US| Contact US: help@patsnap.com


