Donor-acceptor distance distribution measuring method based on fluorescence correlation spectroscopy

A technology of fluorescence correlation spectrum and measurement method, which is applied in the field of measurement of fluorescence resonance energy transfer distance distribution, and can solve the problems of measurement, lack of technical effect, and inability to accurately calculate the influence of receptor concentration.

Active Publication Date: 2014-08-13
SOUTH CHINA NORMAL UNIVERSITY
View PDF4 Cites 7 Cited by
  • Summary
  • Abstract
  • Description
  • Claims
  • Application Information

AI Technical Summary

Problems solved by technology

However, when the concentration ratio of the donor and acceptor is not 1:1, the fluorescence signal of the acceptor channel includes the contribution from the fluorescence resonance energy transfer and the influence of the concentration of the acceptor molecule, because neither the spectroscopy nor the fluorescence lifetime method can measure the concentration of the system. Donor-acce

Method used


Image

  • Donor-acceptor distance distribution measuring method based on fluorescence correlation spectroscopy
  • Donor-acceptor distance distribution measuring method based on fluorescence correlation spectroscopy
  • Donor-acceptor distance distribution measuring method based on fluorescence correlation spectroscopy

Examples


Embodiment 1

[0112] Change the distance between the donor-acceptor pair ECFP-Venus to construct 3 independent fluorescence resonance energy transfer systems, 10%, 35%, 75%. The triplet weight distribution of each system shows a narrow peak distribution, such as image 3 shown in the curve. Use the maximum entropy algorithm to invert and calculate the triplet weight distribution of each system, as shown in image 3 is shown by the dotted solid line. The results of maximum entropy inversion show that the calculated results are in good agreement with the actual distribution in the single-distance FRET system.

Embodiment 2

[0114] The ideal result can also be obtained by using the same maximum entropy inversion to put three donor-acceptor pairs with different distances in the same system, such as image 3 The solid lines in represent the inversion results of the three donor-acceptor distances mixed in equal proportions.

[0115] In calculating the transfer rate constant k ET , implying the triplet relaxation time τ tri A to the transfer rate constant k ET There is a one-to-one functional relationship between them. Although the function cannot be expressed explicitly, the functional relationship can be expressed graphically, such as Figure 4a , Figure 4b shown.

[0116] transfer rate constant k ET The function between the distance r to the donor receptor is given by The energy transfer rate constant formula is given by:

[0117] k ET ( r ) = Q ...


PUM


Abstract

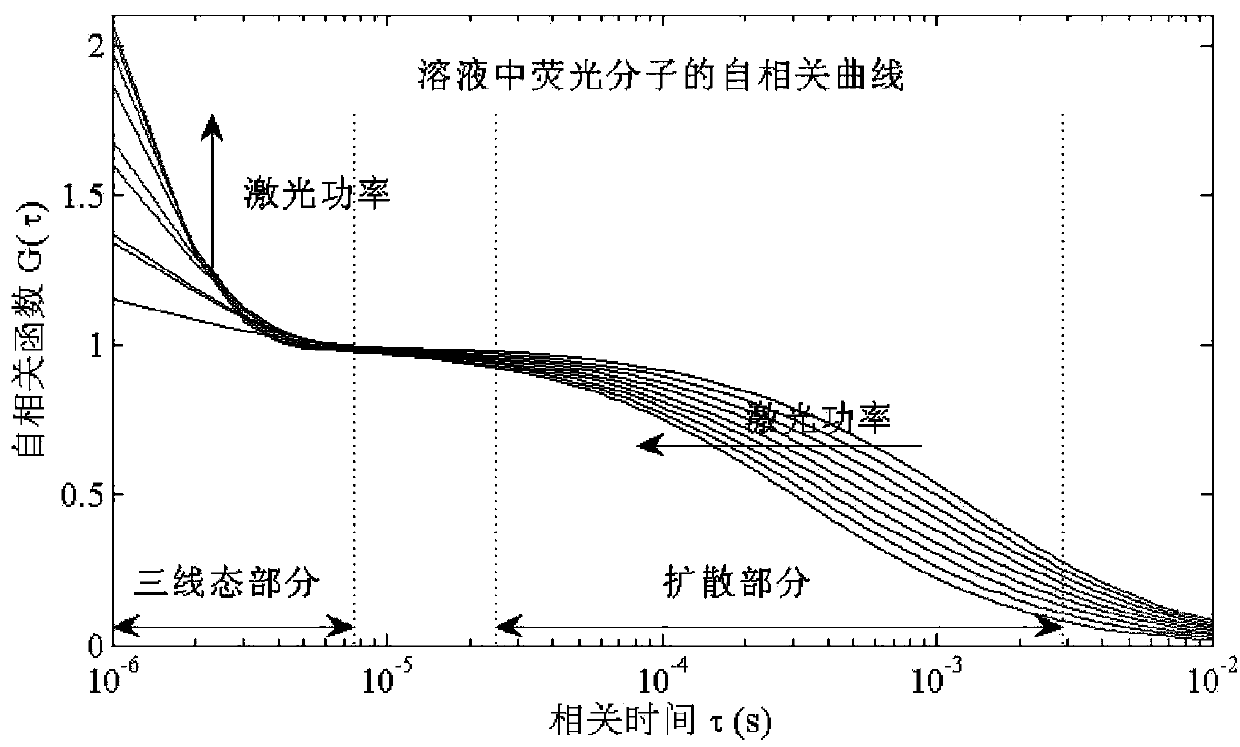
The invention discloses a donor-acceptor distance distribution measuring method based on fluorescence correlation spectroscopy. Fluorescent labeled living cells of donors and acceptors are subjected to a selective donor excitation operation through a fluorescence correlation spectroscopy module of a laser scanning confocal microscope in different laser power. A correlation card acquires photon number fluctuation signals of a donor channel and an acceptor channel to form a self-correlation curve. Energy transfer rate and energy transfer efficiency can be calculated through triplet state analysis of the self-correlation curve of the acceptors. In addition, triplet state distribution of the energy transfer rate and the energy transfer efficiency can be inverted from the self-correlation curve of the triplet state of the acceptors through a maximum entropy algorithm so that donor-to-acceptor distance distribution can be calculated. A fluorescence correlation spectrum analysis method itself is an excellent technology of measuring concentration of a dilute solution, so that the measuring method can be used for measuring donor-acceptor non-paired fluorescence resonance energy transfer efficiency and donor-acceptor non-paired distance distribution after integration items of overlap items of the spectrum being corrected with respect to the donor-acceptor concentration proportion. The measuring method is convenient to use and high in measuring precision.

Description

technical field [0001] The invention relates to a method for measuring the distance distribution of fluorescence resonance energy transfer, in particular to a method for measuring the distance distribution of donor-acceptor based on fluorescence correlation spectrum. Background technique [0002] Fluorescence resonance energy transfer (FRET) is a photophysical process in which excited donor fluorescent molecules transfer excited state energy to adjacent ground state acceptor molecules through dipole-dipole long-range Coulomb interactions. The occurrence of fluorescence resonance energy transfer requires the distance between the donor molecule and the acceptor molecule to be between 1-10 nm. This spatial scale is exactly the linear dimension of various molecular interactions in living cells, so fluorescence resonance energy transfer technology is especially suitable for the study of intracellular molecular interactions and molecular conformation changes. [0003] When FRET o...

Claims


Application Information

Patent Timeline
IPC IPC(8): G01N21/64
Inventor 陈秉灵郭周义
Owner SOUTH CHINA NORMAL UNIVERSITY
Why Eureka
Try Eureka