

Blue-white light conversion fluorescent powder on the basis of UV light excitation and preparation thereof
A phosphor and ultraviolet light technology, applied in luminescent materials, sustainable buildings, climate sustainability, etc., can solve the problems of reducing luminous efficiency, affecting color reproducibility, etc., and achieve good color rendering effect.
- Summary
- Abstract
- Description
- Claims
- Application Information
AI Technical Summary
Problems solved by technology
Method used
Image

Examples
Embodiment
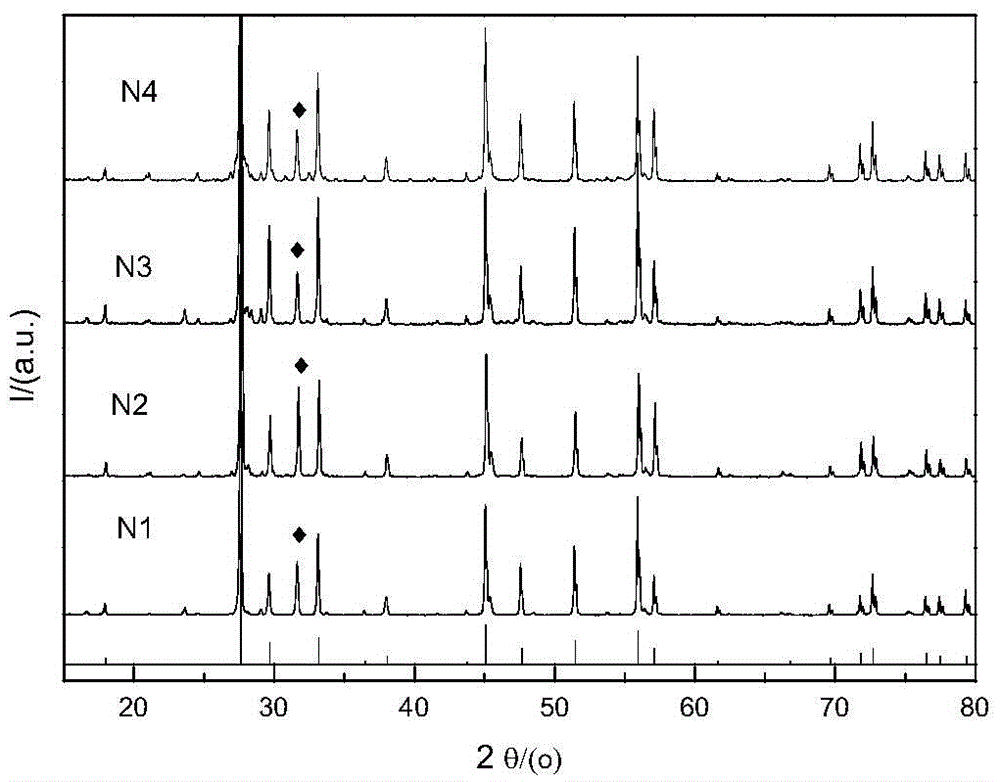
[0022] 1. Preparation of samples N1, N2, N3 and N4
[0023] by NaSr 1-x MoO 4 Cl:xEu stoichiometric ratio Weigh a certain amount of sodium carbonate (Na 2 CO 3 ), strontium carbonate (SrCO 3 ), ammonium molybdate tetrahydrate ((NH 4 ) 6 Mo 7 o 24 4H 2 O), ammonium chloride (NH 4 Cl) (all above are analytically pure) and a certain amount of europium oxide (Eu 2 o 3 ) (99.99%), the Eu contents were 0.02, 0.05, 0.1 and 0.15 respectively; corresponding to sample numbers N1, N2, N3 and N4 (the same below). To prevent NH 4 Cl decomposes and evaporates in the process of heating up, so take 10% more when weighing. Put the weighed raw materials in an agate mortar and grind them thoroughly for 1.5 hours to make them evenly mixed, then put the ground raw materials into a corundum crucible, bake them in a high-temperature resistance furnace at 900°C for 3 hours, and cool down to room temperature with the furnace to obtain the obtained product. Need materials.
[0024] 2. Sa...
PUM
 Abstract
Description
Claims
Application Information