
A Method for Optimal Arrangement of Monitoring Points in Urban Water Supply Network

A layout method, a technology for urban water supply, applied in forecasting, data processing applications, instruments, etc., can solve problems such as inability to guarantee average sensitivity, slow efficiency, and low reliability of classification results

Active Publication Date: 2019-08-09
HANGZHOU DIANZI UNIV
View PDF2 Cites 1 Cited by
  • Summary
  • Abstract
  • Description
  • Claims
  • Application Information

AI Technical Summary

Problems solved by technology

In traditional sensitivity analysis, constructing an objective function by finding the detection point with the highest sensitivity for each abnormal node cannot ensure that the average sensitivity is large enough; and using the average sensitivity as the objective function cannot guarantee that the node with the highest sensitivity can be optimized
And the sensitivity standard deviation method will make the distribution of measuring points uneven, because the node sensitivity is relatively discrete, it cannot guarantee that the actual nodes are relatively dispersed geographically, and cannot well reflect the status of the entire pipe network
In cluster analysis, the weaving network method has problems such as slow efficiency and low reliability of classification results when clustering a large number of nodes.

Method used


Image

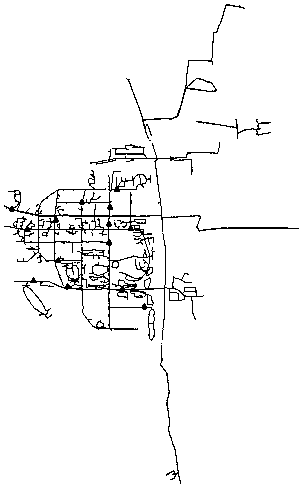
  • A Method for Optimal Arrangement of Monitoring Points in Urban Water Supply Network
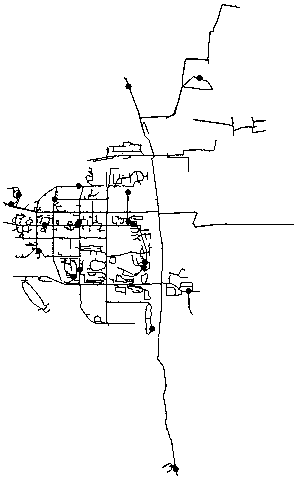
  • A Method for Optimal Arrangement of Monitoring Points in Urban Water Supply Network
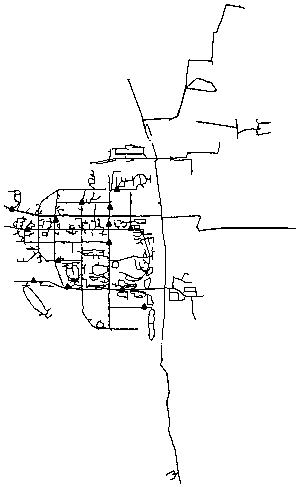
  • A Method for Optimal Arrangement of Monitoring Points in Urban Water Supply Network

Examples


Embodiment Construction

[0054] In order to make the technological innovation realized by the present invention easy to understand, the following describes the implementation of the present invention in detail with reference to the accompanying drawings and examples. The specific steps are as follows:

[0055] 1. Obtain the fuzzy similarity matrix

[0056] (1) Sensitivity coefficient matrix

[0057] There are 5377 DMA nodes in S city (excluding water sources). In order to select better working conditions, the model data of DMA at 12 noon at the maximum working time is used as the test data. Examples of node water demand are shown in Table 1:

[0058] Table 1 Node traffic

[0059]

[0060] Among them, the node numbers are sorted by index. For some nodes, the water demand is 0, such as index 5375, so that the water demand is a very small value, 0.0000001. Run the EPANET model and perform delay simulation to obtain the node pressure vector R before the node water volume changes 0 :

[0061]

[0062] k is the num...


PUM


Abstract

The invention discloses an optimal layout method for urban water supply pipe network monitoring points. The present invention improves the traditional sensitivity analysis and cluster analysis methods respectively, and combines the two methods to obtain an optimized measuring point distribution, so that the measuring point arrangement not only has good sensitivity, but also is relatively dispersed, which is beneficial to demarcate abnormal areas for accurate detection At the same time, the distribution of measuring points is wider and more uniform than the existing measuring points, and the layout of key positions is reasonable, which is conducive to model verification.

Description

Technical field [0001] The invention belongs to the field of urban water supply pipe networks, in particular to a method for optimizing the arrangement of measuring points used for urban water supply pipe network monitoring. Background technique [0002] The measurement point arrangement of the water supply pipe network refers to the distributed installation of a certain number of flow, pressure and other sensors in the water supply pipe network to monitor the operating conditions of the pipe network and provide data support for the pipe network scheduling analysis. Due to the large scale of the urban water supply network in my country and the complex pipelines, the flow and pressure measurement points are not deployed much during the initial construction and expansion of the pipe network, and the lack of system considerations leads to biased measurement and the running state of the water supply network cannot be comprehensive and accurate. Reflect, and then affect the scientific ...

Claims


Application Information

Patent Timeline
Patent Type & Authority Patents(China)
IPC IPC(8): G06Q10/04G06Q50/06
CPCG06Q10/047G06Q50/06
Inventor 徐哲李玉全蔡华强熊晓锋何必仕孔亚广
Owner HANGZHOU DIANZI UNIV
Learn More