Establishment method and application of quality control chart for brucellosis tube agglutination test
A technology for brucellosis and establishment of methods, which can be used in measuring devices, disease diagnosis, biological testing, etc., can solve problems such as not seen, and achieve the effect of improving accuracy and control
- Summary
- Abstract
- Description
- Claims
- Application Information
AI Technical Summary
Problems solved by technology
Method used
Image
Examples
Embodiment 1
[0037] Embodiment 1: the establishment of Brucella quality control figure
[0038] 1. Experimental method
[0039] 1) Refer to the configuration of the turbidimetric tube for judgment
[0040] The reference turbidimetric tube for judgment is configured according to the requirements of Appendix E of "GB / T18646-2002 Animal Brucellosis Diagnostic Technique".
[0041] 2) Reagent compliance test
[0042] The purchased standard positive serum indicated ++ when it was diluted at 1:2400. Dissolve the lyophilized powder of the standard positive serum in 1 mL distilled water for reconstitution. Add 1mL of standard serum (4000IU / mL) into 36.5mL of carbolic saline, dilute to a 1:37.5 solution, and then serially dilute to 1:75, 1:150, 1:300, 1:600, 1: 1200, 1:2400, 1:4800, 1:9600, 1:19200 solutions. Dilute the antigen into a 1:20 working solution according to the antigen instructions. Add the antigen working solution to the above gradient dilution solution. After adding an equal volu...
Embodiment 2
[0065] Embodiment 2: Application of quality control chart
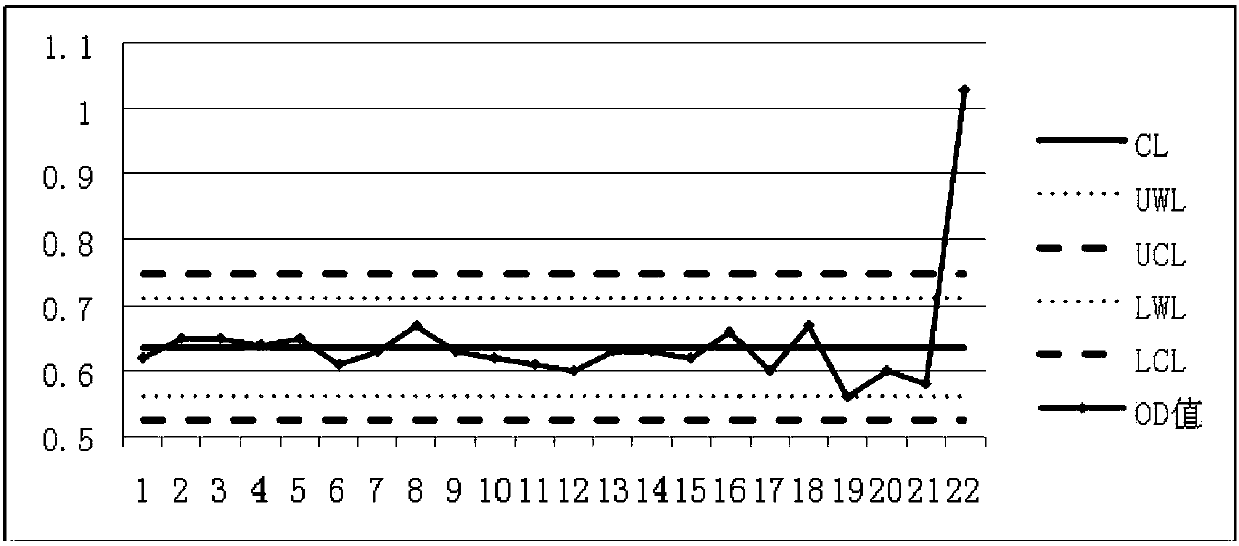
[0066] The application of the quality control chart is to follow the warning lines and control lines of the quality control chart established in Example 1, analyze and test the standard positive serum and the sample to be tested simultaneously, and agglutinate the standard positive serum test tube with a dilution of 1:2400. After the experiment, the OD value of the supernatant was brought in and drawn as a control chart for control. In 22 daily experiments from September 2015 to October 2015, the OD values of the supernatants after the agglutination test of 22 standard positive serum test tubes with a dilution ratio of 1:2400 were collected, and a control chart was drawn for control. The results See figure 2 . Compare the standard negative and positive sera with the reference turbidimetric tube by naked eyes, and the standard positive sera all show ++ when diluted at 1:2400.
[0067] Such as figure 1 As shown, ...
Embodiment 3
[0068] Embodiment 3: Using the quality control chart to determine the influence of experimental conditions on experimental results
[0069] 1. Establish a quality control chart and collect data in the early stage.
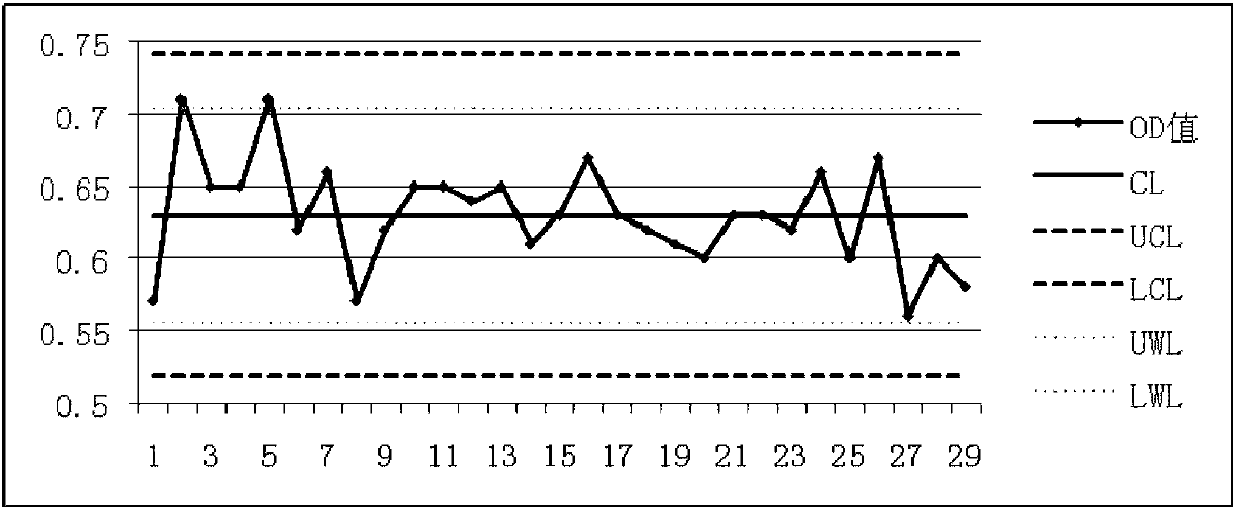
[0070] Routine serum agglutination tests and result judgments were carried out in accordance with the requirements of "GB / T 18646-2002 Brucellosis Laboratory Techniques". After the tube agglutination test was incubated, the supernatant of the standard positive serum at a dilution of 1:2400 was added to the VITEK turbidity test tube, and the OD value was read and recorded using a VITEK matching turbidimeter.
[0071] The 29 sets of data collected in the previous period after removing outliers by using the Dixon test method were used to draw quality control charts in chronological order. The center line (CL) of these 29 sets of data Upper warning limit (UWL) Lower warning limit (LWL) Upper Control Limit (UCL) Lower Control Limit (LCL) Use Excel to make a q...
PUM
 Abstract
Description
Claims
Application Information
 - R&D
- Intellectual Property
- Life Sciences
- Materials
- Tech Scout
- Unparalleled Data Quality
- Higher Quality Content
- 60% Fewer Hallucinations
Browse by: Latest US Patents, China's latest patents, Technical Efficacy Thesaurus, Application Domain, Technology Topic, Popular Technical Reports.
© 2025 PatSnap. All rights reserved.Legal|Privacy policy|Modern Slavery Act Transparency Statement|Sitemap|About US| Contact US: help@patsnap.com


