Method for establishing sample bank for distinguishing driving state of driver
A driving state and establishment method technology, applied in special data processing applications, instruments, electrical digital data processing, etc., can solve problems such as difficulty in obtaining driving state information, impossibility of real realization of dangerous driving state, etc.
- Summary
- Abstract
- Description
- Claims
- Application Information
AI Technical Summary
Problems solved by technology
Method used
Image

Examples
Embodiment Construction
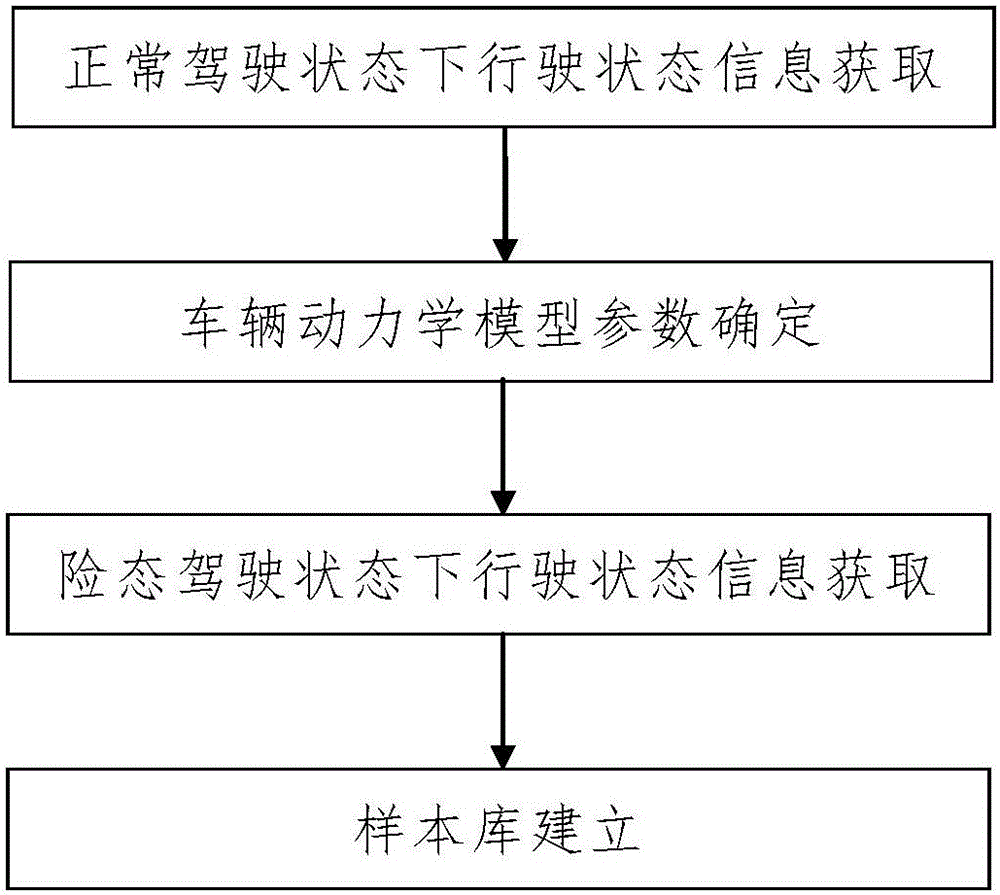
[0053] Such as figure 1 A method for establishing a driver's driving state identification sample library includes the following steps:
[0054] Step 1. Acquisition of driving state information in normal driving state: Using the driving state information monitoring device 1 and according to the pre-designed monitoring frequency, monitor the driving state information of the vehicle driven by the monitored driver during driving according to the pre-designed route, and synchronously transmit the monitored information to the data processor 2 to obtain driving state information at multiple monitoring moments;
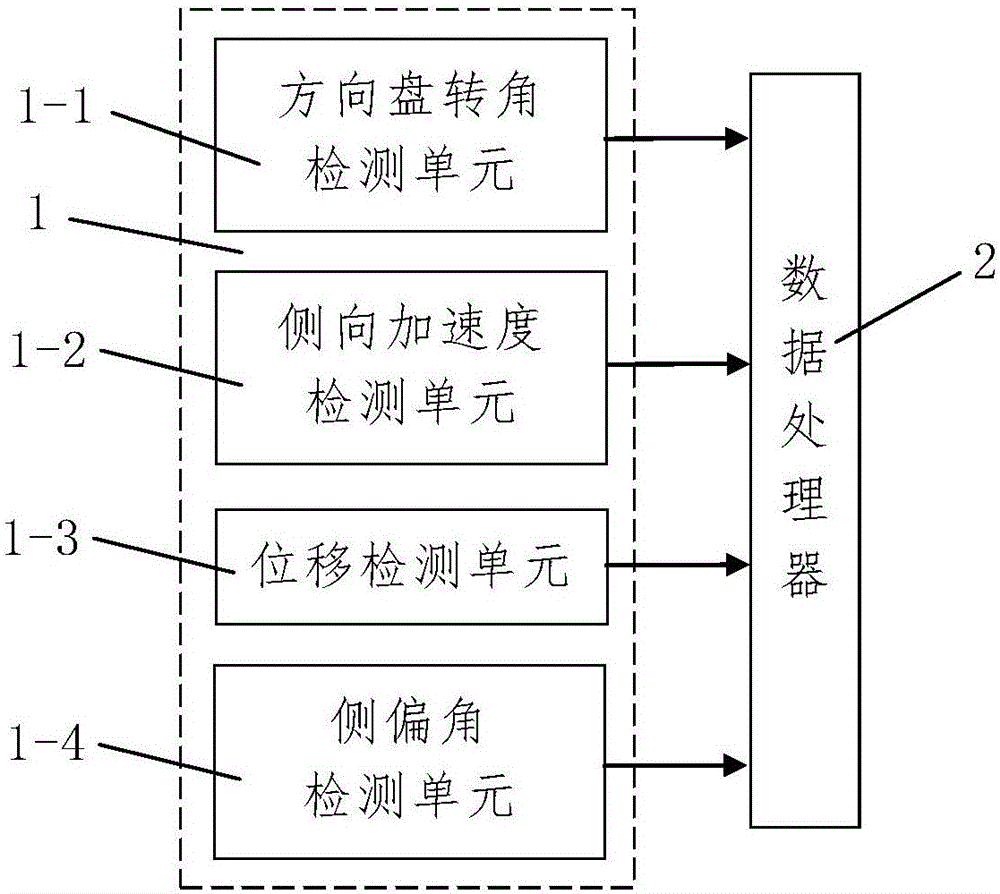
[0055] The driving state information monitoring device 1 includes a steering wheel angle detection unit 1-1 for detecting the steering wheel angle of the driven vehicle and a lateral acceleration detection unit 1-2 for detecting the lateral acceleration of the driven vehicle. The angle detection unit 1-1 and the lateral acceleration detection unit 1-2 are all connected with ...
PUM
 Abstract
Description
Claims
Application Information
PatSnap Eureka turns technology decisions into work you can execute. Powered by our Innovation Knowledge Graph, it runs expert workflows across engineering, life sciences, materials and intellectual property. Get your review-ready output in minutes.


