Low-frequency synthetic aperture radar image comparison and cancellation radio frequency interference suppression method
A technology of synthetic aperture radar and image comparison, applied in the field of signal processing, to achieve the effect of strong robustness, simple structure, and robust RFI suppression performance
- Summary
- Abstract
- Description
- Claims
- Application Information
AI Technical Summary
Problems solved by technology
Method used
Image
Examples
Embodiment 1
[0064] Embodiment 1: Processing the simulation data set A formed by adding the time-domain echoes of time-varying and non-time-varying RFI.
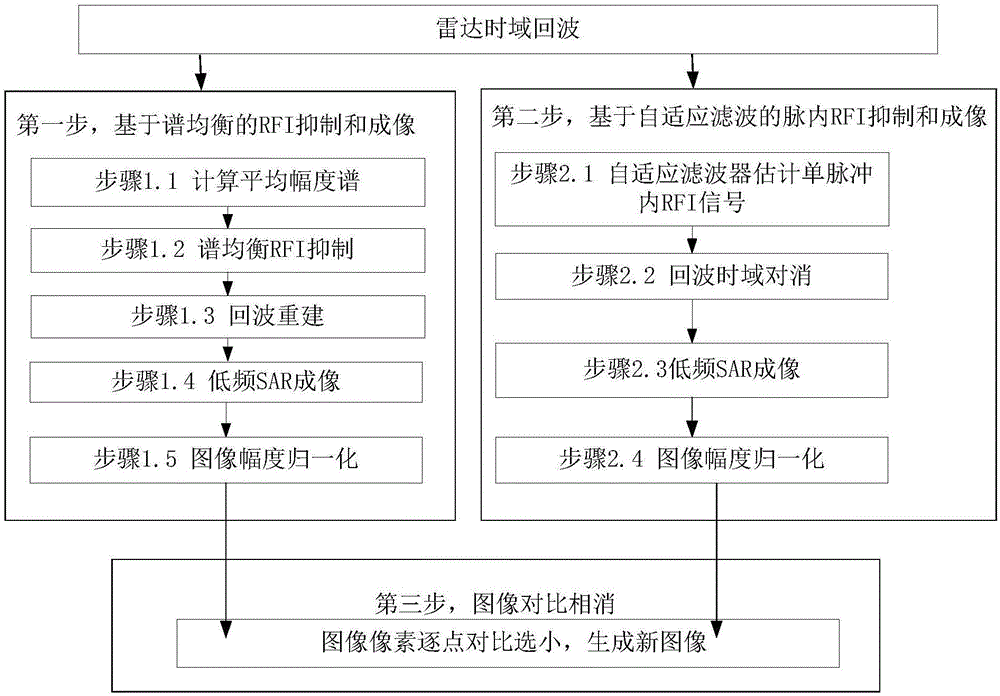
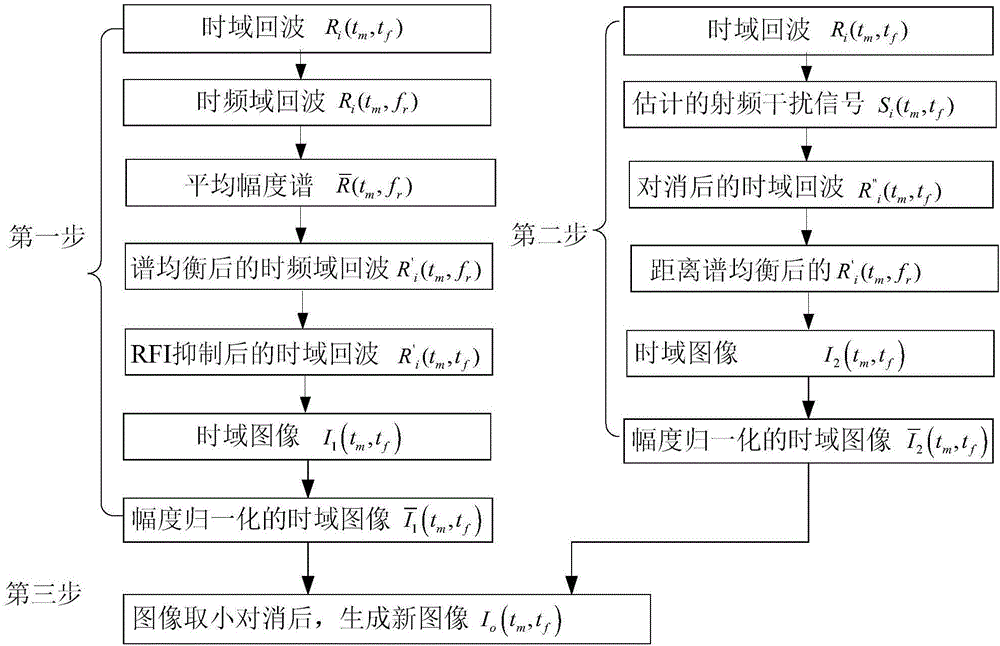
[0065] The first step is range spectrum equalization and SAR imaging based on radar time-frequency domain echoes. Specifically include:
[0066] Step 1.1: Calculate the mean magnitude spectrum
[0067] Take N consecutive time-domain echoes R i (t m ,t f ), where i=1,2,...N, perform Fourier transform on each time-domain echo along the distance time domain, and obtain N time-frequency domain echoes R i (t m , f r ), to obtain the average magnitude spectrum
[0068]
[0069] Step 1.2: Spectral equalization for RFI suppression
[0070] With each time-frequency domain echo R i (t m , f r ) multiplied by the reciprocal of the average amplitude spectrum within the signal bandwidth to suppress RFI for interference higher than the signal strength, and obtain the time-frequency domain echo R after spectrum equalization i '(t m , ...
Embodiment 2
[0099] Embodiment 2: Process the measured data
[0100] The specific process is similar to that of Embodiment 1, and will not be repeated here, only the processing results will be described.
[0101] Figure 8 The results of processing the measured data by spectral equalization RFI suppression method are given. There is time-varying RFI interference in the measured data. Figure 8 There is obvious clutter caused by residual RFI at the position indicated by the arrow in the upper right of the center, and there is a strong target in the circle at the lower left.
[0102] Figure 9 The results of processing the measured data by adaptive NLMS filtering RFI suppression method are given. Figure 9 There is basically no residual RFI interference indicated by the arrow in the upper right of the center, but the same strong target in the lower left circle is opposite Figure 8 Higher sidelobes appear along the distance direction.
[0103] Figure 10 The result of processing the m...
PUM
 Abstract
Description
Claims
Application Information
 - R&D
- Intellectual Property
- Life Sciences
- Materials
- Tech Scout
- Unparalleled Data Quality
- Higher Quality Content
- 60% Fewer Hallucinations
Browse by: Latest US Patents, China's latest patents, Technical Efficacy Thesaurus, Application Domain, Technology Topic, Popular Technical Reports.
© 2025 PatSnap. All rights reserved.Legal|Privacy policy|Modern Slavery Act Transparency Statement|Sitemap|About US| Contact US: help@patsnap.com


