
Method for graphically displaying clock structure and timing sequence correlation

A graphical display and correlation technology, applied in special data processing applications, instruments, electrical digital data processing, etc., can solve problems such as inconvenience in use, inability to display clock structure and timing characteristics at the same time, and many details displayed.

Active Publication Date: 2017-05-10
北京华大九天科技股份有限公司
View PDF5 Cites 6 Cited by
  • Summary
  • Abstract
  • Description
  • Claims
  • Application Information

AI Technical Summary

Problems solved by technology

[0005] However, there are some EDA tools on the market to analyze and display the clock system, but there are some defects and inconveniences in use, for example: the clock structure and timing characteristics cannot be displayed at the same time; for a large clock system, the displayed details Too many to lose readability; poor interaction with users, unable to check the validity and correctness of the existing clock system

Method used


Image

  • Method for graphically displaying clock structure and timing sequence correlation
  • Method for graphically displaying clock structure and timing sequence correlation
  • Method for graphically displaying clock structure and timing sequence correlation

Examples


Embodiment Construction

[0028] The preferred embodiments of the present invention will be described below in conjunction with the accompanying drawings. It should be understood that the preferred embodiments described here are only used to illustrate and explain the present invention, and are not intended to limit the present invention.

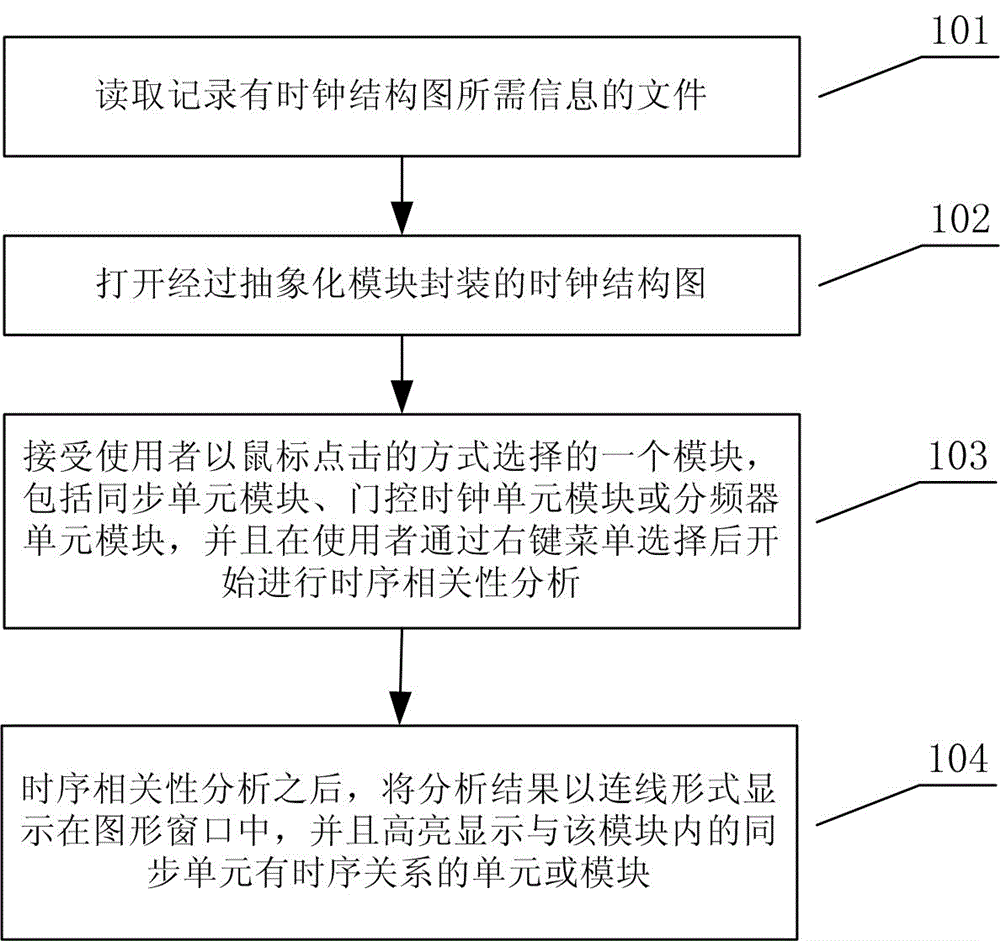
[0029] figure 1 It is a flowchart of a method for graphically displaying the clock structure and timing correlation according to the present invention, which will be referred to below figure 1 , the method for graphically displaying the clock structure and timing correlation of the present invention is described in detail.

[0030] First, in step 101, a file in which information required by the clock structure diagram is recorded is read. Among them, it includes unit library files for designing circuits (such as timing lib format), netlist files for recording circuit connection relationships (such as verilog format), and files for defining clock and delay constrain...


PUM


Abstract

The invention provides a method for displaying a clock structure and timing sequence correlation. The method comprises the following steps that an required information file recording a clock structure graph is read, and the clock structure graph encapsulated by an abstraction module is opened. Timing sequence correlation analysis is conducted on the module, and the analysis result is displayed in a graphics window. By means of the method for displaying the clock structure and the timing sequence correlation, the structure of a complicated clock system can be clearly displayed, the timing sequence correlation between synchronization units is effectively analyzed, a clock tree synthesis tool is assisted so as to improve the synthesis quality, accordingly the design and manufacturing period of a chip is shortened, and the design efficiency is improved.

Description

technical field [0001] The invention relates to the technical field of electronic design automation (EDA), in particular to a method for graphically displaying clock structure and sequence correlation. Background technique [0002] The back-end physical design of VLSI relies more and more on the assistance of electronic design automation (EDA) tools. The clock signal controls the work of all synchronous units in the circuit; the development of ultra-high-speed, low-power, and high-performance integrated circuits puts forward higher design requirements for the clock system, which has become the key to the successful chip production. Usually a clock structure includes clock definition points, combinational logic units (such as AND / OR gate units), gated clock units (such as ICG units), synchronization units (such as flip-flop units), frequency divider units, etc. [0003] The current clock system under deep submicron conditions will be very large: the number of clocks is incre...

Claims


Application Information

Patent Timeline
IPC IPC(8): G06F17/50
CPCG06F30/39G06F30/398
Inventor 刘毅董森华牛飞飞汪燕芳
Owner 北京华大九天科技股份有限公司
Learn More