Application method for detecting hormone in food by joint SERS (Surface Enhanced Raman Scattering) substrate
An application method and substrate technology, applied in the fields of nanomaterials, food safety testing, and photonic materials, can solve problems such as long half-life, difficult biodegradation, and hormone residues, and achieve the effects of low detection limit, high sensitivity, and high sample recovery rate
- Summary
- Abstract
- Description
- Claims
- Application Information
AI Technical Summary
Problems solved by technology
Method used
Image
Examples
Embodiment 1
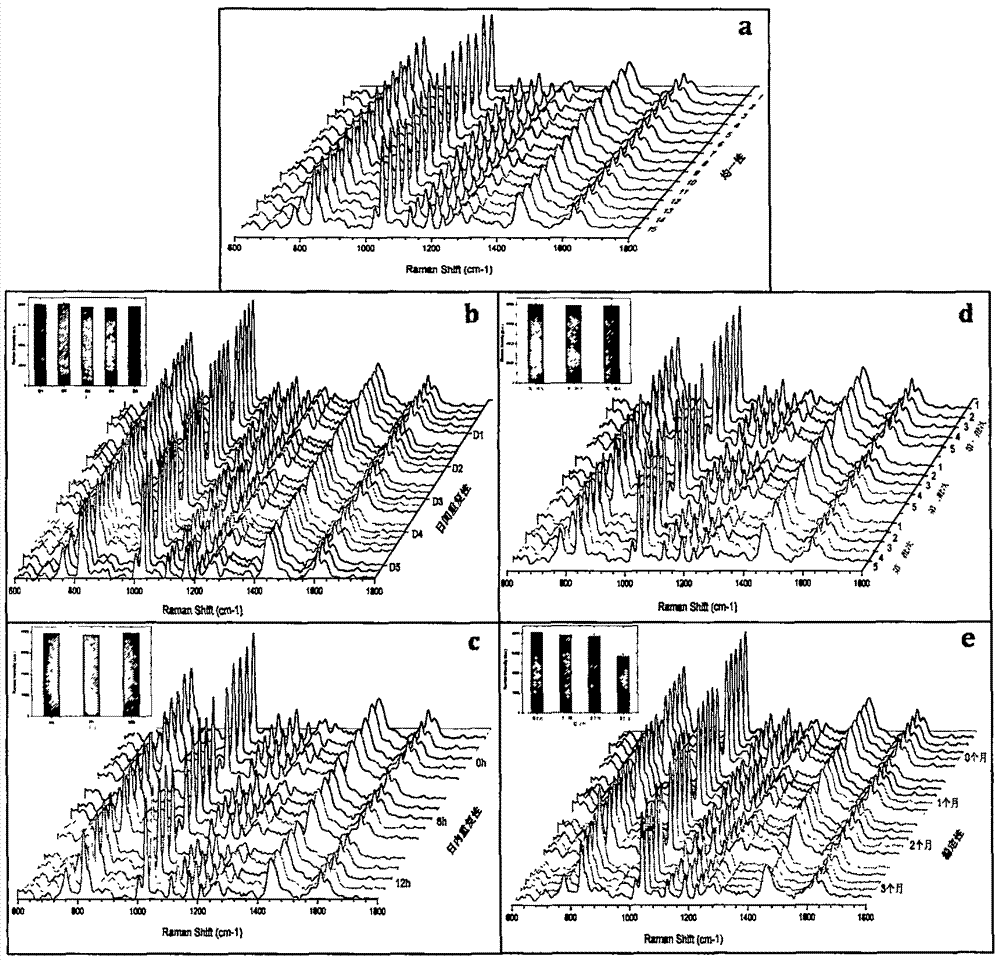
[0032] Uniformity, repeatability and stability investigation of a combined SERS substrate:
[0033] figure 1 The given Fe3O4@SiO2-Ag-C6+ rod silver SERS signal quality research map. From figure 1 a It can be seen that the 15 SERS curves are basically the same, and the Raman characteristic peak of diethylstilbestrol is 1028cm -1 As a reference, the calculated relative standard deviation of the Raman peak intensities of 15 SERS spectra is 4.88%, indicating that the substrate has good uniformity. Day-to-day repeatability, 25 Raman spectrum peaks are obtained, intra-day repeatability is 15 Raman spectrum peaks, batch repeatability, a total of 15 Raman spectrum peaks are collected three times, such as figure 1 b, c, d, at 1028cm -1The histograms of the intensity values of the SERS signal at the position are shown in b, c, and d illustrations, respectively. The acquired SERS spectra show good uniformity, and the dispersion of the SERS signal intensity is relatively large. The...
Embodiment 2
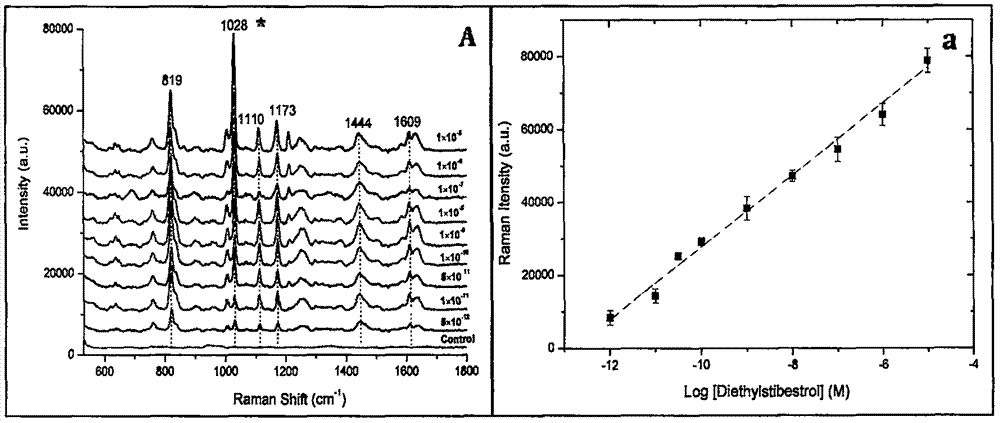
[0035] The application method of using SERS substrate to detect hormones in food is used for qualitative and quantitative analysis of two hormone solutions:
[0036] figure 2 It is the qualitative and quantitative analysis result of diethylstilbestrol solution. We have a concentration range of 10 -5 ~10 -12 The diethylstilbestrol solution of M is detected by Raman, and the 80% methanol of the diethylstilbestrol solution is used as a signal reference, and the obtained SERS spectrum is as follows figure 2 As shown in A. Such as figure 2 As shown in a, we choose 1028cm -1 The log-log curve has been drawn as the characteristic peak of diethylstilbestrol, and the standard deviation of the measurement result is presented in the figure in the form of error bars, at 10 -5 ~10 -12 Within the concentration range of M, the obtained linear equation is y=12661+8044.1465x, r 2 =0.97, the linear relationship is good. The detection limit of this method for diethylstilbestrol is 5p...
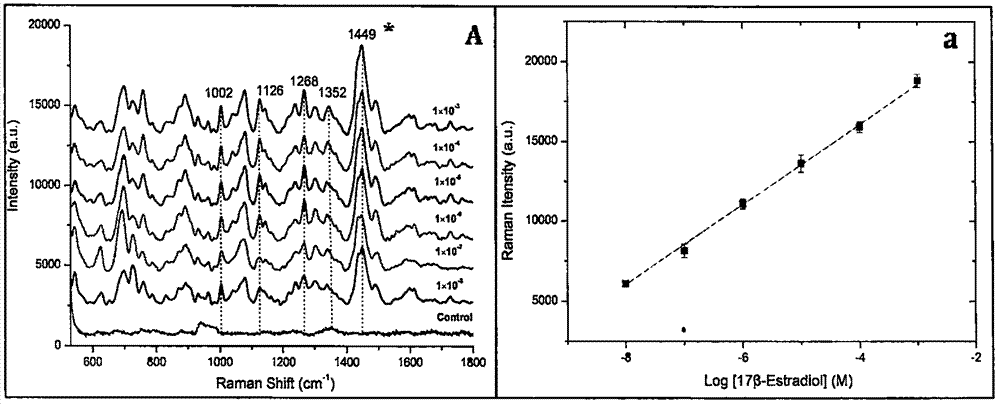
Embodiment 3
[0039] Figure 4-Figure 6 It is the qualitative and quantitative analysis results of diethylstilbestrol in milk and 17β-estradiol in milk. Taking blank milk as a signal reference, the obtained SERS spectrum is as follows: Figure 4 A. Figure 5 Shown in B. Such as Figure 4 a, Figure 5 As shown in b, we selected the characteristic peaks of diethylstilbestrol and 17β-estradiol in the spectrum at 1028cm -1 and 1449cm -1 , draw log-log curves according to their corresponding concentrations in solution. As the concentration of hormones decreased, their intensity corresponding to the characteristic peaks in the SERS spectrum also gradually decreased, diethylstilbestrol and 17β-estradiol were respectively -3 ~10 -10 M and 10 -3 ~10 -8 Within the concentration range of M, the linear equations are y=40532+3495.8084x, r 2 =0.99; y=35161+3540.0586x, r 2 = 0.99, all linear relationships are good. The detection limits of diethylstilbestrol and 17β-estradiol in milk by this m...
PUM
 Abstract
Description
Claims
Application Information
 - R&D
- Intellectual Property
- Life Sciences
- Materials
- Tech Scout
- Unparalleled Data Quality
- Higher Quality Content
- 60% Fewer Hallucinations
Browse by: Latest US Patents, China's latest patents, Technical Efficacy Thesaurus, Application Domain, Technology Topic, Popular Technical Reports.
© 2025 PatSnap. All rights reserved.Legal|Privacy policy|Modern Slavery Act Transparency Statement|Sitemap|About US| Contact US: help@patsnap.com


