Broadband photoelectric detector responsivity tester and testing method thereof

A technology of photodetectors and testing methods, applied in the direction of instruments, etc., can solve the problem that the frequency sweep method cannot get rid of the extra calibration of electro-optic conversion devices, cannot meet the responsivity measurement of ultra-bandwidth photodetectors, and the signal ratio and dynamic range of the intensity-to-noise method are small etc. to achieve the effect of realizing self-referencing measurement, ensuring self-referencing measurement, improving system signal-to-noise ratio and dynamic range

Active Publication Date: 2018-04-27
UNIV OF ELECTRONIC SCI & TECH OF CHINA
3 Cites 7 Cited by

AI-Extracted Technical Summary

Problems solved by technology

[0004] The purpose of the present invention is: from the background technology, it can be seen that the existing technology has these problems: (1) the signal ratio and the dynamic range of the intensity noise method are small; , resulting in high measurement cost, unable to meet the problem of ultra-bandwidth photodetector responsivity measurement;...

Abstract

The invention discloses a broadband photoelectric detector responsivity tester and a testing method thereof, which relate to the technical field of optoelectronics. The broadband photoelectric detector responsivity tester comprises an optical frequency comb output module, a double-drive intensity modulation module and a photoelectric detector to be tested which are optically connected in sequence,further comprises a spectrum analysis and data processing module which is electrically connected with the photoelectric detector to be tested, and comprises a signal source 1 and a signal source 2 which are connected with two RF input ends of the double-drive intensity modulation module separately. The broadband photoelectric detector responsivity tester and the testing method thereof solve the four problems that: (1) a frequency sweeping method cannot get rid of additional calibration of an electronic-to-optical converter; (2) measurement precision and stability of an optical heterodyne method are not high; (3) a signal ratio and a dynamic range of an intensity noise method are small; (4) and a frequency shift heterodyne method is limited to the bandwidth of the electronic-to-optical converter, which results in high measurement cost, low measurement precision and poor reliability, and the responsivity measurement of an ultra-wide bandwidth photodetector cannot be met.

Application Domain

Technology Topic

Image

  • Broadband photoelectric detector responsivity tester and testing method thereof
  • Broadband photoelectric detector responsivity tester and testing method thereof
  • Broadband photoelectric detector responsivity tester and testing method thereof

Examples

  • Experimental program(3)

Example Embodiment

[0047] Example one
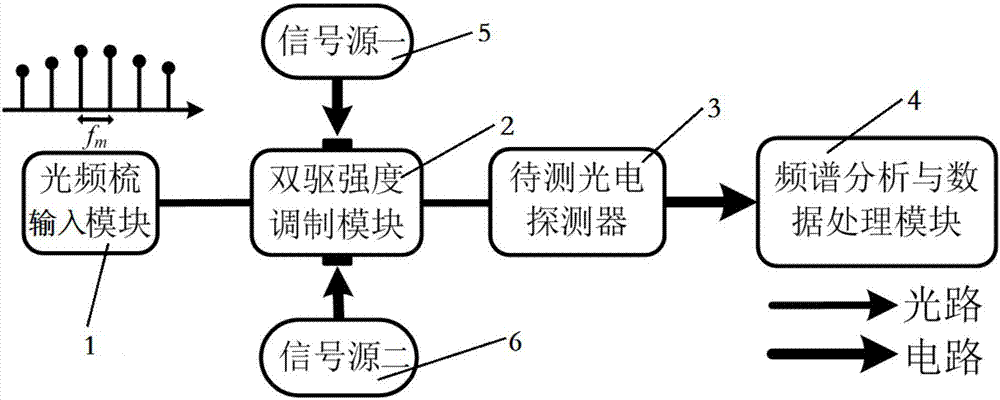
[0048] The optical frequency comb output module in this embodiment uses a mode-locked laser with a repetition frequency of 10 GHz, and the dual-drive intensity modulation module uses a dual-drive Mach-Zehnder modulator. Set the signal source 1 to output a sinusoidal microwave signal at a frequency of 3.01 GHz. The frequency of the sinusoidal microwave signal output by the source 2 is 3GHz. The optical signal output by the dual-drive intensity modulation module is photoelectrically converted in the photoelectric detector to be measured to form an electrical signal, which is analyzed and measured by the spectrum analysis and data processing module.
[0049] When k=0, the measuring frequency is 6.01GHz(f 1 +f 2 ), 0.01GHz(f 1 -f 2 ), respectively A(f 1 +f 2 )=0.0041V, A(f 1 -f 2 )=0.0038V, then according to formula (4), the photoelectric detector under test can be obtained at a frequency of 6.01GHz (f 1 +f 2 ) And 0.01GHz (f 1 -f 2 ) Ratio of responsivity
[0050]
[0051] The general commercial photodetector has a responsivity value of approximately 1 at 0.01GHz, so the responsivity of the photodetector under test is 0.9268 at a frequency of 6.01GHz.

Example Embodiment

[0052] Example two
[0053] The optical frequency comb output module in this embodiment uses a mode-locked laser with a repetition frequency of 10 GHz, and the dual-drive intensity modulation module uses a dual-drive Mach-Zehnder modulator. Set the signal source 1 to output a sinusoidal microwave signal at 3.81 GHz. The frequency of the sinusoidal microwave signal output by the source 2 is 3.8GHz. The optical signal output by the dual-drive intensity modulation module is photoelectrically converted in the photoelectric detector to be tested to form an electrical signal, which is analyzed and measured by the spectrum analysis and data processing module.
[0054] When k=1, the measurement frequency is 17.61GHz(f m +f 1 +f 2 ), 10.01GHz(f m +f 1 -f 2 ), respectively A(f m +f 1 +f 2 )=0.0036V, A(f m +f 1 -f 2 )=0.0029V, then according to formula (4), the frequency of the photoelectric detector under test is 17.61GHz(f m +f 1 +f 2 ) And 10.01GHz (f m +f 1 -f 2 ) Ratio of responsivity
[0055]
[0056] Set the frequency of signal source 1 to output sinusoidal microwave signals to 5.01GHz, and the frequency of signal source 2 to output sinusoidal microwave signals to 5GHz. The optical signals output by the dual-drive intensity modulation module are converted into electrical signals in the photodetector under test. Spectrum analysis and data processing module for analysis and measurement.
[0057] When k=0, the measuring frequency is 10.01GHz(f 1 +f 2 ), 0.01GHz(f 1 -f 2 ), respectively A(f 1 +f 2 )=0.0041V, A(f 1 -f 2 )=0.0036V, then according to formula (4), the photoelectric detector under test can be obtained at a frequency of 10.01GHz (f 1 +f 2 ) And 0.01GHz (f 1 -f 2 ) Response ratio
[0058]
[0059] Obtain the responsivity of the photodetector under test at different frequencies
[0060]
[0061] However, the responsivity value of the general commercial photodetector at 0.01GHz is approximately 1, so the responsivity value of the photodetector under test at the frequency of 17.61GHz is 0.7072=0.861*0.8780.

Example Embodiment

[0062] Example three
[0063] The optical frequency comb output module in this embodiment uses a mode-locked laser with a repetition frequency of 10 GHz, and the dual-drive intensity modulation module uses a dual-drive Mach-Zehnder modulator. Set the signal source 1 to output a sinusoidal microwave signal at a frequency of 4.51 GHz. The frequency of the sinusoidal microwave signal output by the source 2 is 4.5GHz. The optical signal output by the dual-drive intensity modulation module is photoelectrically converted in the photoelectric detector to be measured to form an electrical signal, which is analyzed and measured by the spectrum analysis and data processing module.
[0064] When k=2, the measuring frequency is 29.01GHz (2f m +f 1 +f 2 ), 20.01GHz(2f m +f 1 -f 2 ), respectively A(2f m +f 1 +f 2 )=0.0031V, A(2f m +f 1 -f 2 )=0.0021V, then according to formula (4), the photoelectric detector under test can be obtained at a frequency of 29.01GHz (2f m +f 1 +f 2 ) And 20.01GHz (2f m +f 1 -f 2 ) Response ratio:
[0065]
[0066] Set the frequency of signal source 1 to output sinusoidal microwave signals to 5.01GHz, and the frequency of signal source 2 to output sinusoidal microwave signals to 5GHz. The optical signals output by the dual-drive intensity modulation module are converted into electrical signals in the photodetector under test. Spectrum analysis and data processing module for analysis and measurement.
[0067] When k=0, the measuring frequency is 10.01GHz(f 1 +f 2 ), 0.01GHz(f 1 -f 2 ), respectively A(f 1 +f 2 )=0.0041V, A(f 1 -f 2 )=0.0036V, then according to formula (4), the photoelectric detector under test can be obtained at a frequency of 10.01GHz (f 1 +f 2 ) And 0.01GHz (f 1 -f 2 ) Response ratio:
[0068]
[0069] However, the responsivity value of the general commercial photodetector at 0.01GHz is approximately 1, so the responsivity value of the photodetector under test at the frequency of 10.01GHz is 0.8780.
[0070] When k=1, the measuring frequency is 20.01GHz(f m +f 1 +f 2 ), 10.01GHz(f m +f 1 -f 2 ), respectively A(f m +f 1 +f 2 )=0.0036V, A(f m +f 1 -f 2 )=0.0031V, according to formula (4), the photoelectric detector under test can be obtained at a frequency of 20.01GHz(f m +f 1 +f 2 ) And 10.01GHz (f m +f 1 -f 2 ) Response ratio:
[0071]
[0072] Obtain the responsivity of the photodetector under test at different frequencies:
[0073]
[0074] Therefore, the responsivity value of the photodetector under test at a frequency of 29.01GHz is 0.5121=0.6774*0.8611*0.8780.
[0075] By analogy, gradually increase the value of k (k 1 From 0.11GHz to 5.01GHz, f 2 Sweep frequency synchronously from 0.1GHz to 5GHz and keep f 1 -f 2 = 0.01GHz unchanged, then fine sweep frequency measurement of the photodetector under test in the frequency range of 0.01-10.01GHz, 10.01-20.01GHz, 20.01-30.01GHz, etc. can be obtained, so as to obtain the ultra-fine, Ultra-wideband sweep frequency measurement.

PUM

no PUM

Description & Claims & Application Information

We can also present the details of the Description, Claims and Application information to help users get a comprehensive understanding of the technical details of the patent, such as background art, summary of invention, brief description of drawings, description of embodiments, and other original content. On the other hand, users can also determine the specific scope of protection of the technology through the list of claims; as well as understand the changes in the life cycle of the technology with the presentation of the patent timeline. Login to view more.

Similar technology patents

Classification and recommendation of technical efficacy words

Why Eureka
Try Eureka