Linear array scanning image sleeper positioning and counting method based on gradient projection
A technology of line scan and gradient projection, applied in image data processing, image analysis, image enhancement, etc., can solve the problems of low precision and poor reliability, and achieve the effect of less image data, easy storage and management
- Summary
- Abstract
- Description
- Claims
- Application Information
AI Technical Summary
Problems solved by technology
Method used
Image
Examples
Embodiment 1
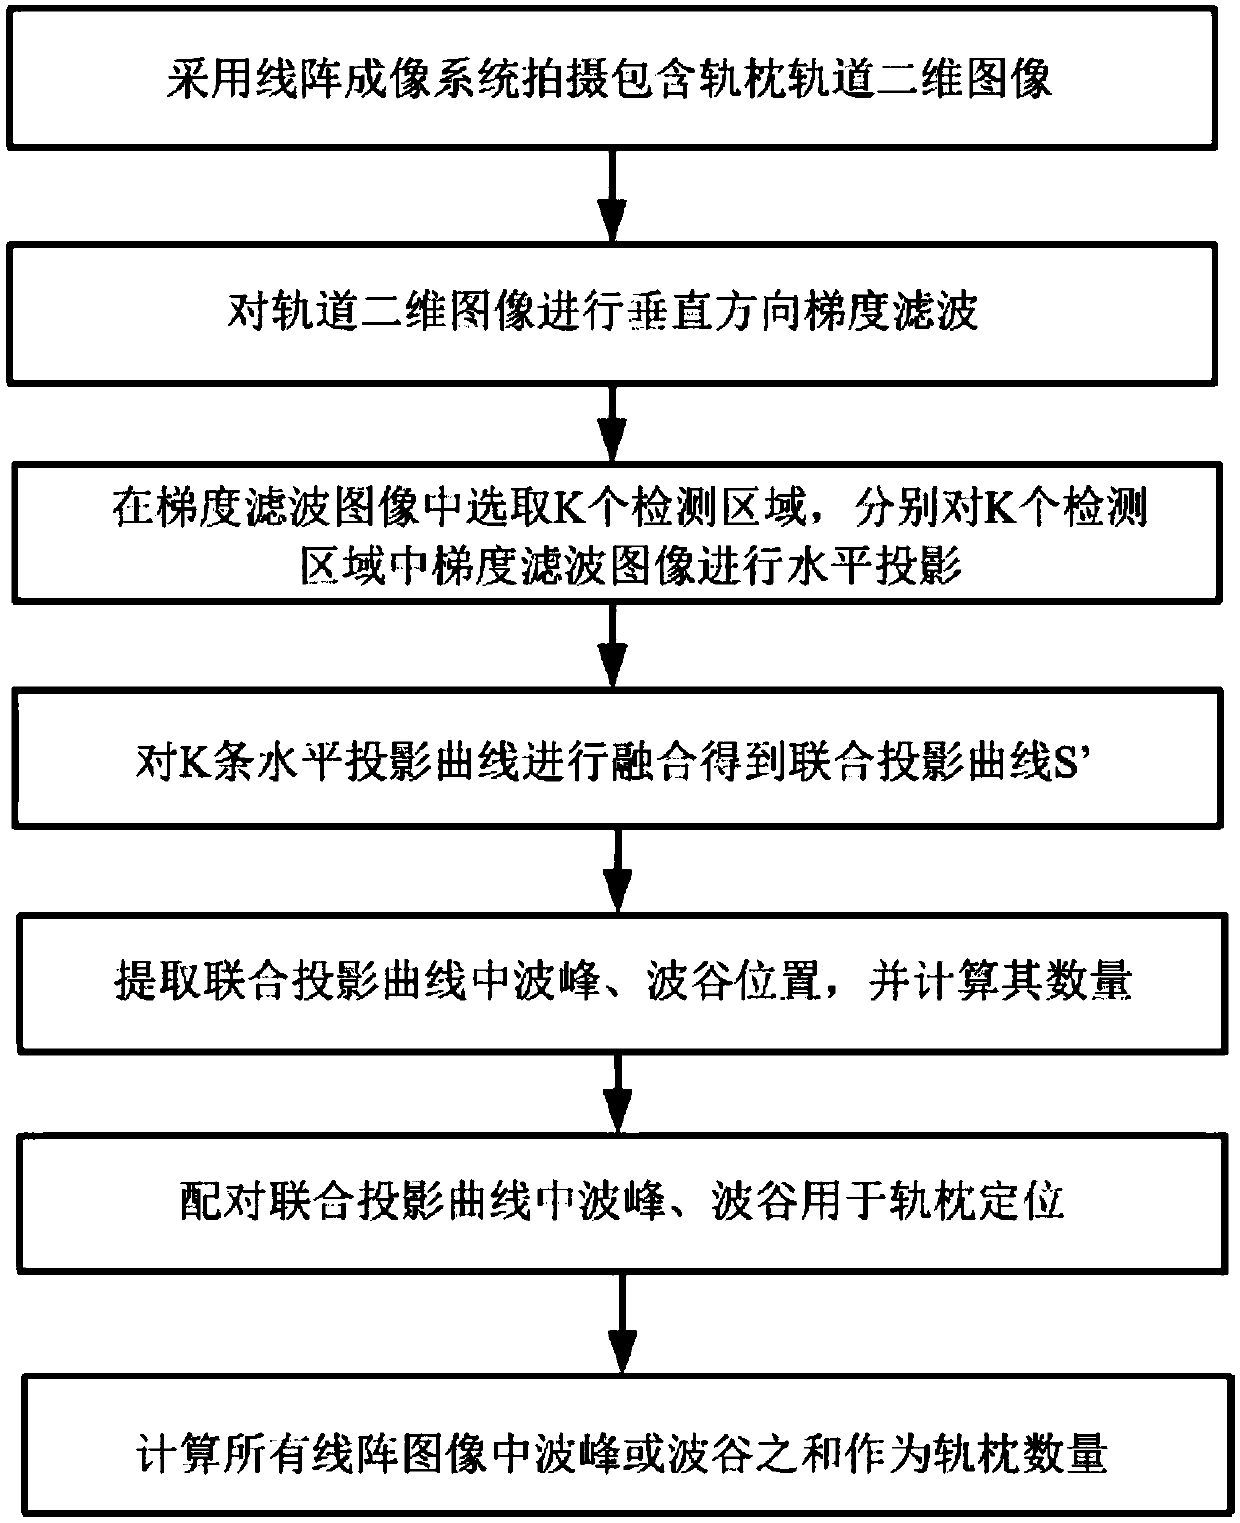
[0058] The linear array imaging system is used to scan and image the track pavement along the moving direction of the train or detection platform, and obtain 20 linear array images including sleepers.
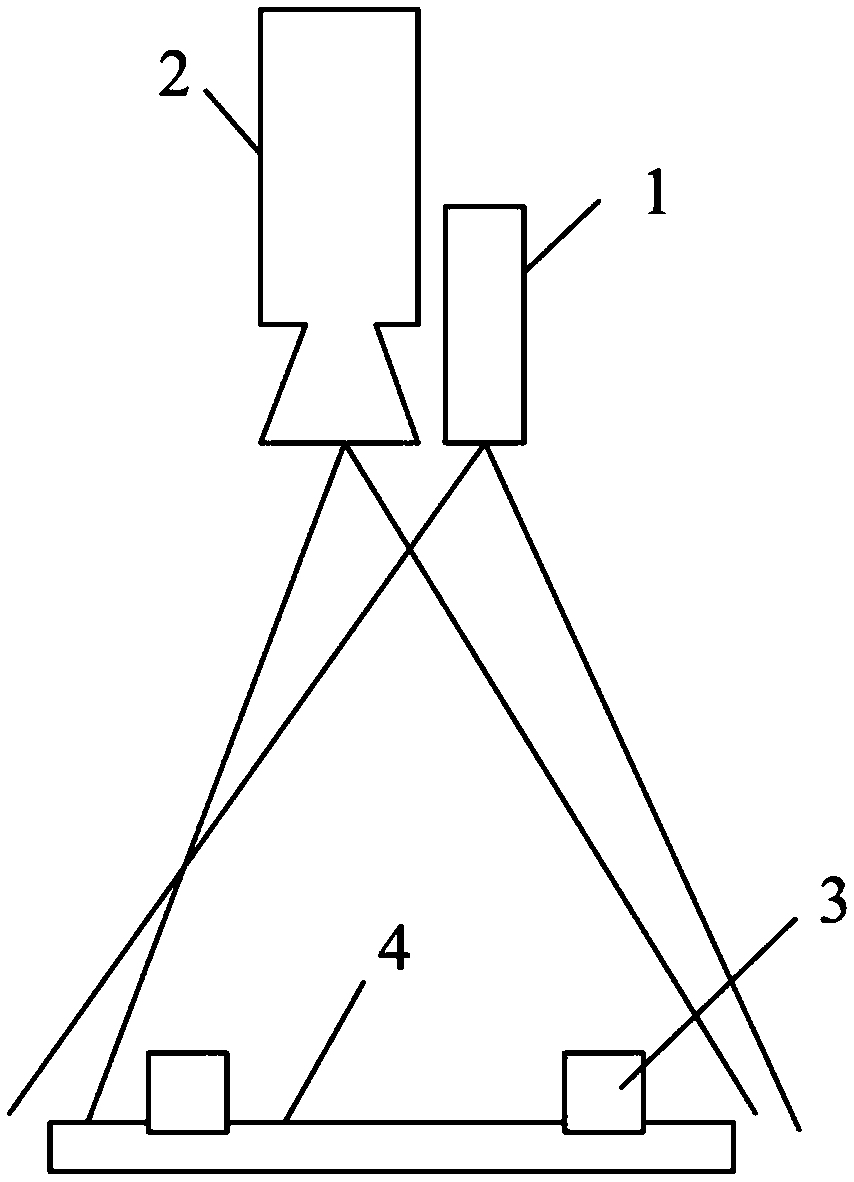
[0059] Schematic diagram of the line array imaging system figure 2 As shown, it is composed of line light source 1 and line array camera 2, located directly above the railway, the projection plane of line light source 1 and the imaging plane of line array camera 2 are coplanar, and the projection direction of line light source 1 and the optical axis of line array camera 2 are perpendicular to the railway road surface .
[0060] The line light source 1 is a narrow-band light source with a wavelength a, and a narrow-band filter with a wavelength a is set at the front end of the line array camera 2 to eliminate ambient light interference, and the wavelength a=500nm.
[0061] The imaging controller is composed of a photoelectric code disc or a photoelectric encoder fixed on the w...
Embodiment 2
[0080] Replace step 3 in Example 1 with: for 3 horizontal projection curves {S 1 ... S 3} Fusion by means of cumulative multiplication to obtain the joint projection curve S′, the result is as follows Figure 9 As shown, the specific formula of the cumulative multiplication operation is:
[0081]
[0082] Among them, S′(i) represents the value of the i-th element in the joint projection curve S′, S k (i) represents the kth horizontal projection curve S k The value of the i-th element in , K is the number of joint projection curves, Π represents the multiplication operation, and N is the height of the detection area.
[0083] All the other steps are the same as in Example 1.
Embodiment 3
[0085] Steps 4-6 in Embodiment 1 or 2 are replaced successively by:
[0086] Step 4: Extract the trough in the joint projection curve S′, and obtain the number of troughs and coordinates
[0087] First, the joint projection curve S′ is divided into several negative square waves by using the fixed threshold method, and the trough is found by the minimum value method in the negative square wave area, and the result is shown in the figure Figure 10 shown.
[0088] Step 5: Take the paired valley coordinates in the joint projection curve S' for sleeper positioning.
[0089] The trough pairing method is: when the value of the first m / 2 row elements in the differential operator is greater than 0, from the top to the bottom of the line scan image, pair them in the order of the trough; when the value of the first m / 2 row elements in the differential operator is less than When 0, from the top to the bottom of the line scan image, pair them in the order of troughs.
[0090] Step ...
PUM
 Abstract
Description
Claims
Application Information
 - R&D
- Intellectual Property
- Life Sciences
- Materials
- Tech Scout
- Unparalleled Data Quality
- Higher Quality Content
- 60% Fewer Hallucinations
Browse by: Latest US Patents, China's latest patents, Technical Efficacy Thesaurus, Application Domain, Technology Topic, Popular Technical Reports.
© 2025 PatSnap. All rights reserved.Legal|Privacy policy|Modern Slavery Act Transparency Statement|Sitemap|About US| Contact US: help@patsnap.com


