

HPLC fingerprint spectrum determination method for cannabis sativa
A determination method and a fingerprint technology, which are applied in the field of cannabis HPLC fingerprint determination, can solve the problems of single quality evaluation method of cannabis, unstable measurement effect, poor spectral fit, etc., and achieve good peak shape, easy identification, repeatability and the like. Good results
- Summary
- Abstract
- Description
- Claims
- Application Information
AI Technical Summary
Problems solved by technology
Method used
Image

Examples
Embodiment 1
[0090] The selection of embodiment 1 test sample processing condition
[0091] plan 1)
[0092] Preparation of the test solution: Take an appropriate amount of cannabis flowers and leaves, pulverize them, pass through a No. 2 sieve, and bake at 120° C. for 90 minutes. Take 0.5 g of the roasted cannabis flowers and leaves powder, weigh them accurately, and place them in a conical flask. Add 35ml of 95% ethanol, ultrasonically extract (power: 400W, frequency: 30kHz) for 10 minutes, let it cool to room temperature, pass through a 0.22μm microporous membrane, and take the subsequent filtrate.
[0093] Scenario 2)
[0094] Preparation of the test solution: Take an appropriate amount of cannabis flowers and leaves, pulverize them, pass through a No. 2 sieve, and bake at 120° C. for 90 minutes. Take 0.5 g of the roasted cannabis flowers and leaves powder, weigh them accurately, and place them in a conical flask. Add 50ml of 95% ethanol, ultrasonically extract (power: 400W, frequenc...
Embodiment 2
[0108] The selection of embodiment 2 high performance liquid chromatography conditions
[0109] (1) Inspection of detection wavelength
[0110] Prepare the test solution according to the method of Example 1 scheme (1).
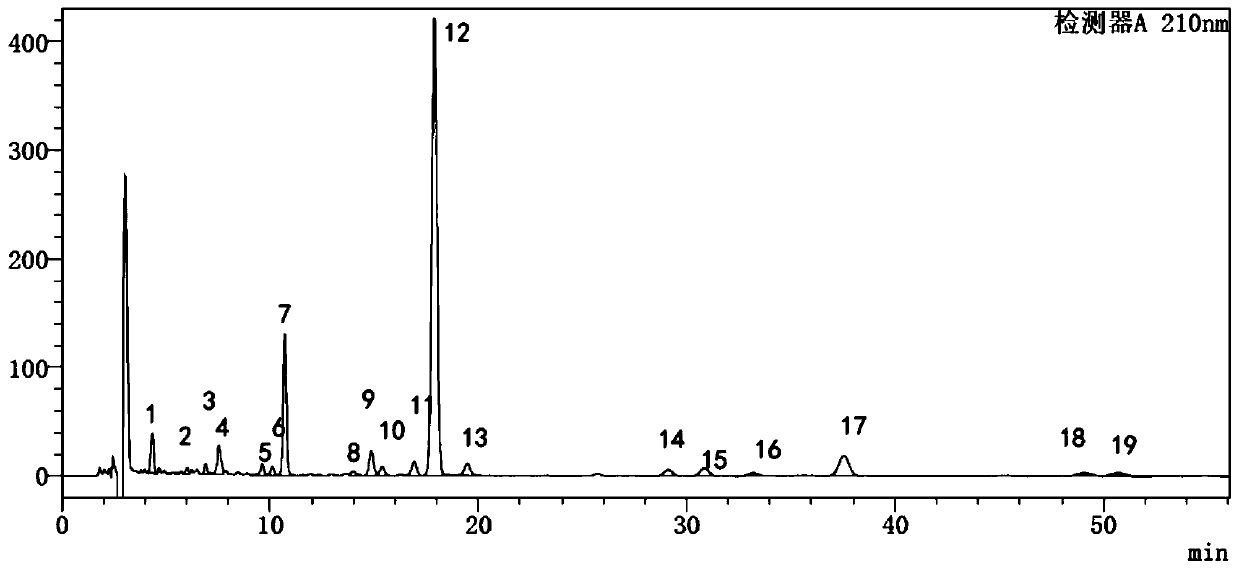
[0111] The assay method of reference example 1 and the high-performance liquid chromatography condition except detection wavelength, measure under the detection wavelength of 210,220,230,254,280nm respectively, record chromatogram, successively as follows Figure 4-8 shown.
[0112] Depend on Figure 4-8 As can be seen, under the detection wavelength of 210 and 220nm, 8 chromatographic peaks ( Figure 4 The peaks shown (7, 9, 10, 11, 12, 13, 17, 19) are clearly distinguishable, and at other detection wavelengths, some peaks are difficult to distinguish and even many components do not appear. And compared with 220nm, the peak shape is better at the detection wavelength of 210nm, so 210nm is selected as the suitable detection wavelength.
[0113] (2) Invest...
Embodiment 3
[0129] Embodiment 3 Precision experiment
[0130] Prepare the test solution according to the method of Example 1 scheme (1).
[0131] Get the same part of the test solution, continuously repeat 6 injections, adopt the chromatographic conditions selected in Example 2, and investigate the precision. The results are shown in Tables 1 and 2. The common peak retention time RSDs were all less than 0.18%, and the peak area RSDs were all less than 0.95%. The similarity between the 6 repeated injections was all 1.000, and the precision was good.
[0132] Table 1 precision experiment result (retention time)
[0133]
[0134]
[0135] Table 2 precision test results (peak area)
[0136]
[0137]
PUM
| Property | Measurement | Unit |
|---|---|---|
| Wavelength | aaaaa | aaaaa |
Abstract
Description
Claims
Application Information