
Spectral Acquisition Method for Improving Raman Spectral Signal-to-Noise Ratio

A Raman spectrum and acquisition method technology, applied in the field of spectrum acquisition, can solve the problems of affecting the linear responsivity of the signal, increasing the cost of the instrument, prolonging the integration time, etc., so as to improve the acquisition efficiency and operation flexibility, improve the cost performance, and improve the noise amplitude Effect

Active Publication Date: 2022-02-11
奥谱天成(厦门)光电有限公司
View PDF5 Cites 0 Cited by
  • Summary
  • Abstract
  • Description
  • Claims
  • Application Information

AI Technical Summary

Problems solved by technology

[0006] The existing Raman spectrum acquisition method with high signal-to-noise ratio adopts the method of prolonging the integration time to increase the S R The long integration time also produces a series of problems: First, the acquisition time is long, plus the background acquisition time, a measurement needs 2 times the integration time length, due to the extension of time, it will lead to S E Increased chance of occurrence
The second is that the probability of random hotspots in the detector increases. In addition to random Gaussian noise, the array detector will also have irregular hotspot responses that significantly exceed the average amplitude of the noise. The longer the time, the greater the probability of hotspots; the third is the longer the integration time. , the probability of being interfered by cosmic rays is also greater; in addition, as the integration time prolongs, the array detection noise will significantly raise the baseline, and in severe cases, it will also affect the linear response of the signal
For a series of problems caused by prolonging the integration time, the current direct solution is to choose better quality and more precise array components, or suppress dark noise by reducing the detector temperature, so that the cost of the instrument is significantly increased

Method used


Image

  • Spectral Acquisition Method for Improving Raman Spectral Signal-to-Noise Ratio
  • Spectral Acquisition Method for Improving Raman Spectral Signal-to-Noise Ratio
  • Spectral Acquisition Method for Improving Raman Spectral Signal-to-Noise Ratio

Examples


Embodiment 1

[0077] The following takes the Raman spectrum of carbon tetrachloride excited at 532nm collected by an array spectrometer as an example.

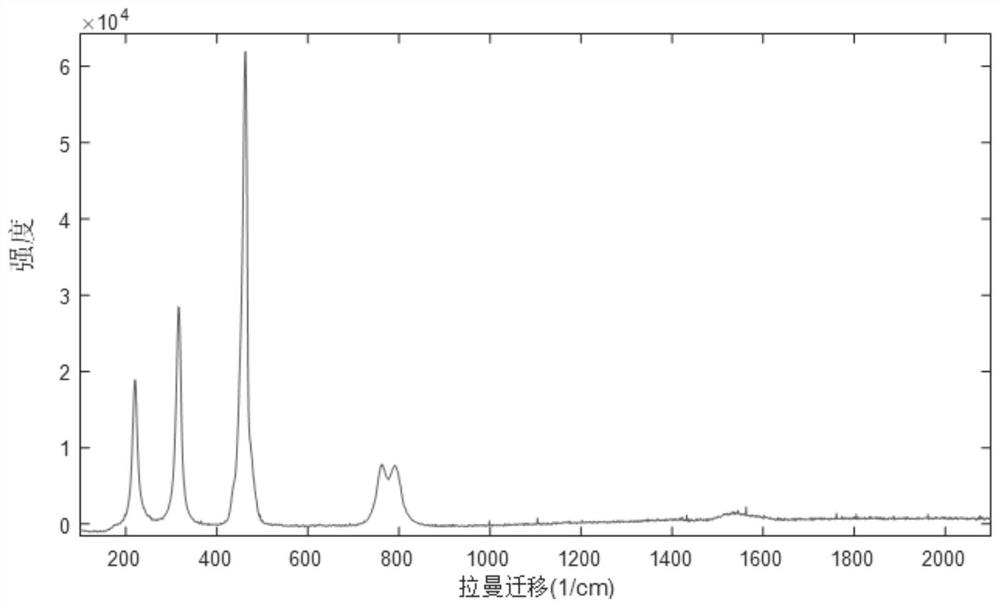
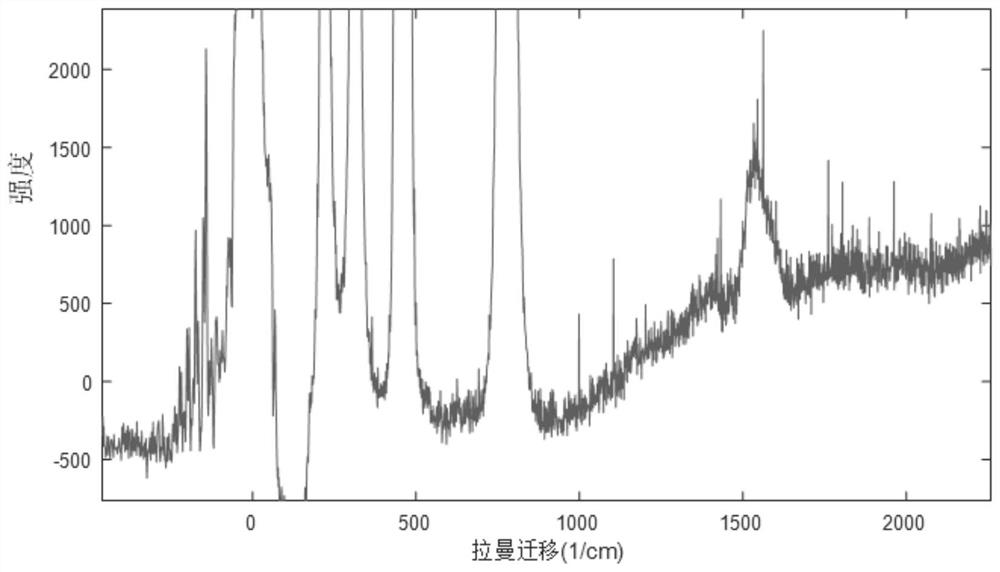
[0078] figure 1 It is the carbon tetrachloride spectrum collected according to the full scale of 1100ms. At this time, the spectrum has obvious hot spot interference. figure 2 can be clearly seen in .

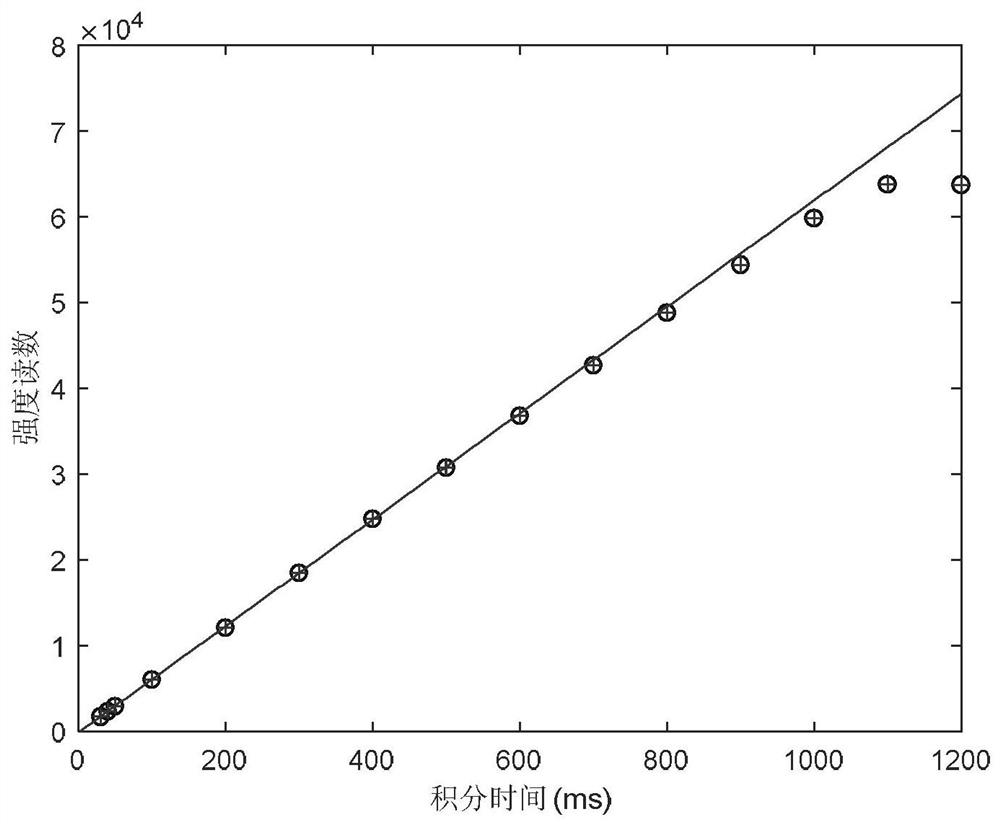
[0079] image 3 is the CCl collected from 10ms to 1200ms 4 Main peak (461cm -1 ), it can be seen that as the intensity increases, the linear responsivity of the intensity becomes worse.

[0080] The following is the implementation of the present invention:

[0081] A spectral acquisition method for improving Raman spectral signal-to-noise ratio, the method comprising the following steps:

[0082] 1) Obtain the noise floor of the spectrometer array S A :

[0083] 1-1) Judging the integration time t when the spectrometer obviously has thermal noise H :

[0084] Choose a CMOS array spectrometer with 4094 pixels, obtain a series of ...


PUM


Abstract

A spectral acquisition method for improving the signal-to-noise ratio of Raman spectra, relating to a spectral acquisition method, comprising the steps of: 1) obtaining the background noise of the spectrometer array S A ;2) Measurement series of micro-unit integration time spectrum signal sets; 3) Differential projection and contrast differential calculation to obtain the real spectrum of the sample S s . The present invention increases the number of measurements within a fixed measurement time by shortening the unit integration time; more sampling times are beneficial to reduce S G , while reducing S E The probability of occurrence, and by eliminating abnormal units, eliminate S E Impact. Each unit after the present invention will restore S Accumulated to obtain a high signal-to-noise ratio at a fixed time S R response, of which S G The magnitude is proportional to the square root of the number of accumulations, so that S G get suppressed. The invention can improve the Raman spectrum signal-to-noise ratio, improve the linear responsivity of the instrument, help reduce the cost of the instrument, improve the collection efficiency and operation flexibility, significantly eliminate the burr on the baseline, and improve the cost performance of the instrument.

Description

technical field [0001] The invention relates to a spectrum acquisition method, in particular to a spectrum acquisition method for improving the Raman spectrum signal-to-noise ratio. Background technique [0002] Spectral signal collected by spectrometer with array detector S , consisting of sequence values, S =[s1,s2,...,sn], as a whole sequence according to deterministic, including four parts: definite spectral signal S R , definite but time-dependent array noise S A , random Gaussian noise S G and uncertain interference S E ,which is: S = S R + S A (t) + S G + S E . [0003] in: [0004] S R It should have good linear responsivity, that is, the ideal spectrum is linearly positively correlated with the integration time, but in terms of physical properties, the linearity will become worse as the intensity increases. S A Caused by the individual differences between the photosensitive points of the array, because the manufacturing cannot guarantee that ...

Claims


Application Information

Patent Timeline
Patent Type & Authority Patents(China)
IPC IPC(8): G01N21/65
CPCG01N21/65
Inventor 姚志湘姚桔粟晖张景清
Owner 奥谱天成(厦门)光电有限公司
Learn More