Method for inducing differentiation of human induced pluripotent stem cells into endothelial progenitor cells
A technology of pluripotent stem cells and endothelial progenitor cells, applied in the field of stem cell induced differentiation
- Summary
- Abstract
- Description
- Claims
- Application Information
AI Technical Summary
Problems solved by technology
Method used
Image
Examples
Embodiment 1
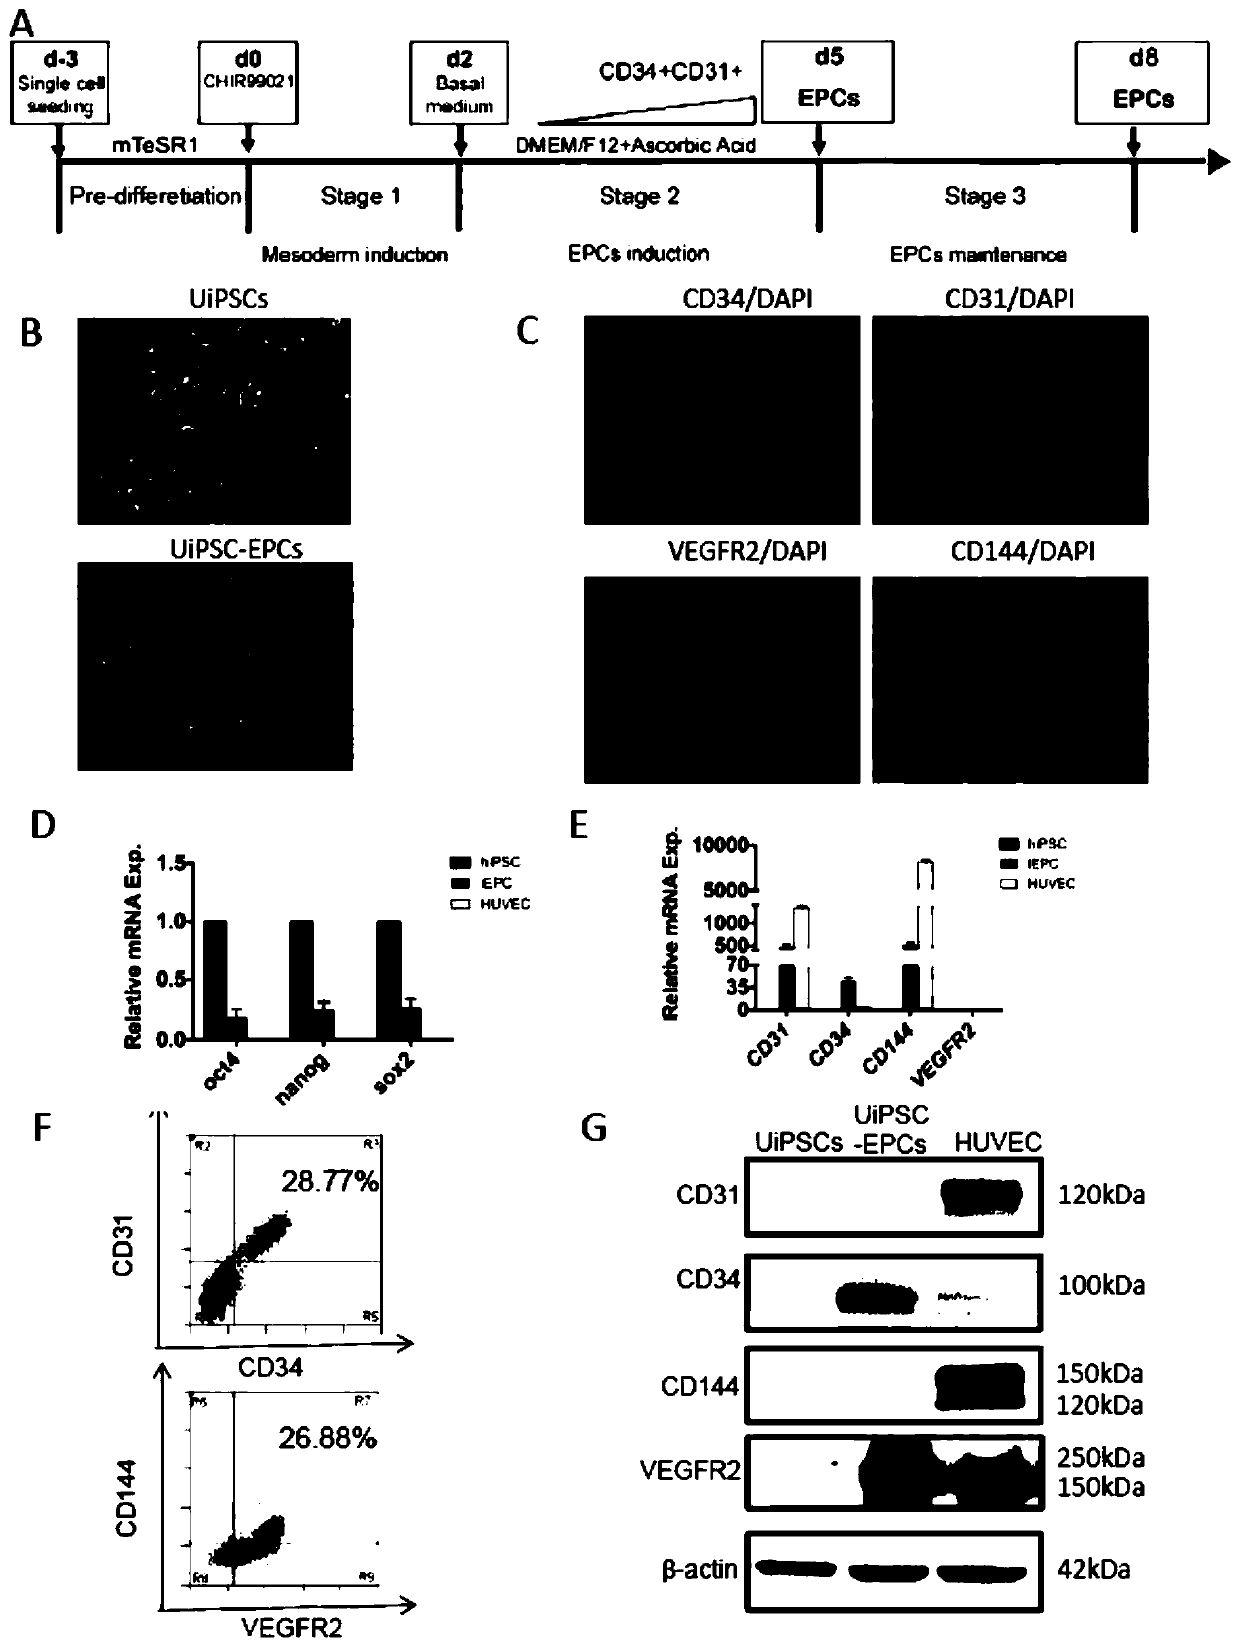
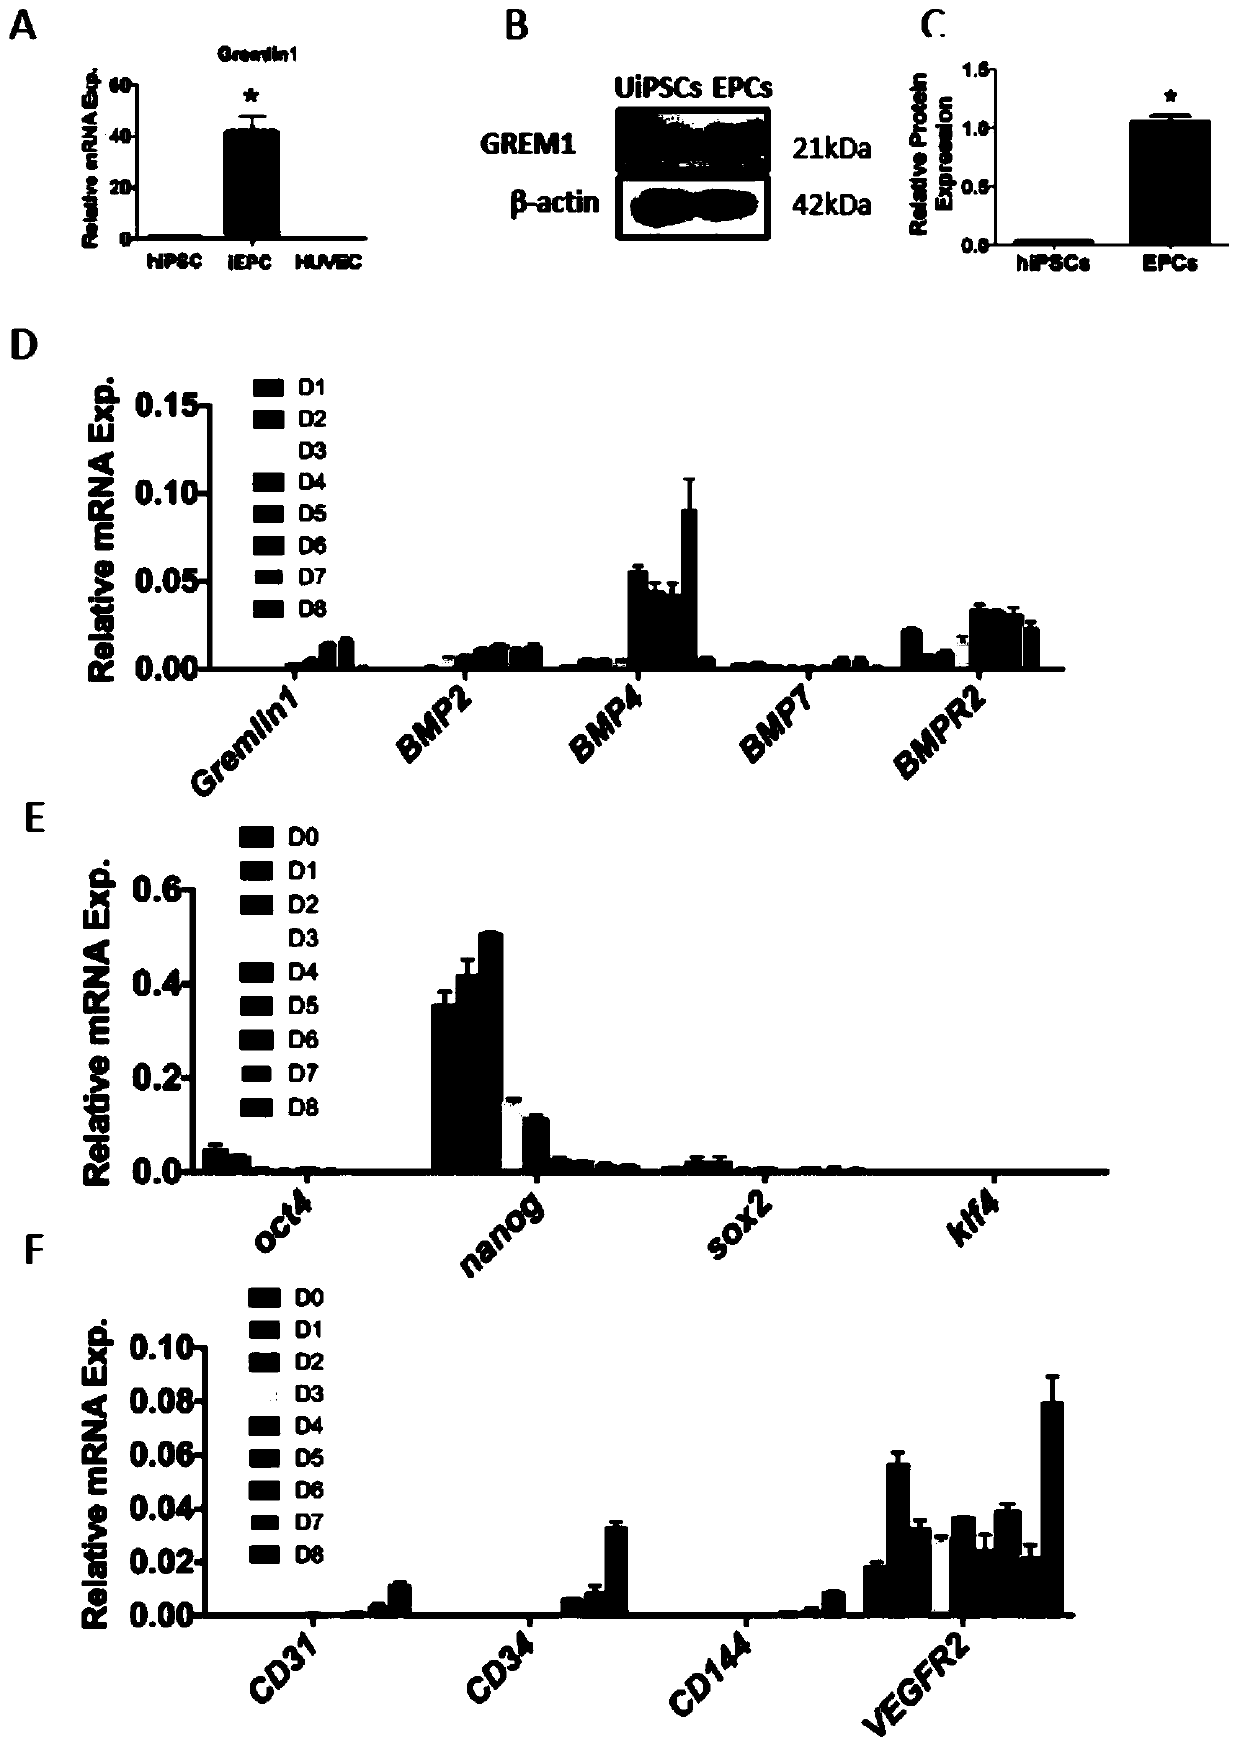
[0043] Example 1 Stage-specific expression of GREM1 during the differentiation and maintenance of hiPSCs into endothelial progenitor cells
[0044] In this example, differentiation was induced according to the following protocol, which included two steps: the first step was to induce undifferentiated hiPSCs to differentiate into mesoderm for 2 days with CHIR99021; the second step was to induce endothelial progenitors with DMEM / F12 medium plus ascorbic acid Cells were grown for 3 days, and then continued to maintain cells ( figure 1 A); clonally grown hiPSCs transformed into endothelial progenitor cells ( figure 1 B) On day 5 of differentiation, the expression of endothelial progenitor cell surface markers CD34, CD31, VEGFR2 and CD144 was detected by immunofluorescence ( figure 1 C); qPCR was used to detect gene expression.
[0045] The experimental results showed that the stem cell markers OCT4, Nanog and SOX2 all decreased after differentiation ( figure 1 D). In contrast,...
Embodiment 2
[0048] Example 2 Knockdown of GREM1 at stage 1 (0-2 days of differentiation) increases the differentiation of hiPSCs into EPCs
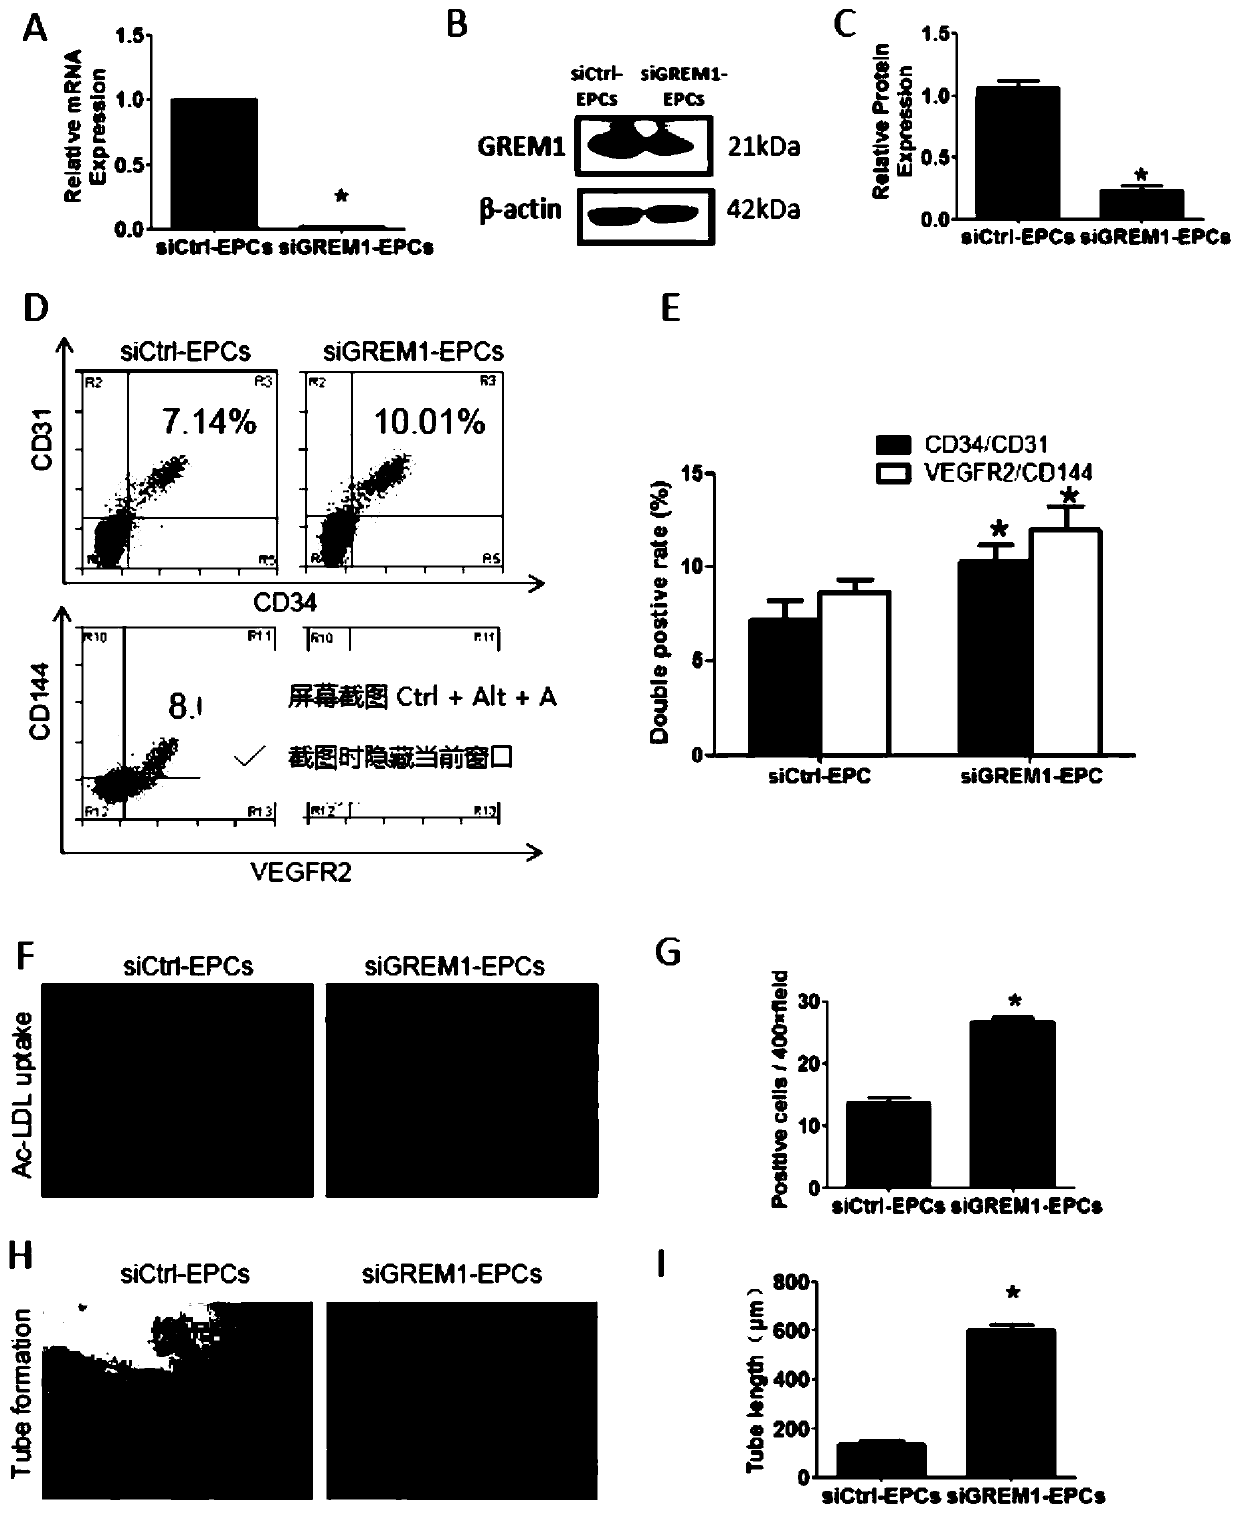
[0049] To examine the role of GREM1, GREM1 expression was knocked down using si-GREM1. QPCR results showed that the efficiency of si-GREM1 was above 80% ( image 3 A). WB results confirmed the downregulation of GREM1 at the protein level ( image 3 B, image 3 C).
[0050] When GREM1 was knocked out from day 0 to day 2, FACS results on day 2 showed that CD34 / CD31 increased from (7.21±0.57)% to (10.31±0.53)%, VEGFR2 / CD144 increased from (8.66±0.40) % increases to (11.98±0.75)% ( image 3 D, 3E). Ac-LDL uptake increased in siGREM1 group ( image 3 F, 3G). Tube formation in the siGREM1 group also increased ( image 3 H, 3I).
[0051] Meanwhile, downregulation of GREM1 promoted cell proliferation at this stage. Immunofluorescence of Ki67 expression showed that the positive cells per high-power field of view increased from (37.00±6.97)% to (68....
Embodiment 3
[0052] Example 3 Knockdown of GREM1 in the second stage (2-5 days of differentiation) inhibits the differentiation of hiPSCs into EPCs
[0053] From day 2 to day 5, the expression of GREM1 decreased, and the surface markers of CD34 / CD31 decreased from (19.17±0.52)% to (13.51±0.38)% on day 5, and VEGFR2 / CD144 decreased from (15.60±0.49)% down to (11.33±0.58)% ( Figure 5 A, 5B). The dil-ac-LDL uptake and tube-forming function decreased in the siGREM1 group ( Figure 5 C, 5D, 5E, 5F).
[0054] Simultaneous detection of cell proliferation and apoptosis. Ki67 positive cells decreased from (70.09±1.81)% to (35.00±2.50)% ( Figure 6 A, 6B). The cell cycle showed that the ratio of cells in G1 phase decreased and the ratio of cells in S phase increased in the si-GREM1 group ( Figure 6 C, 6D). PI / AnnexinV results showed that the double positive rate rose from (0.89±0.11)% to (7.58±0.37)% ( Figure 6 E, 6F).
PUM
| Property | Measurement | Unit |
|---|---|---|
| concentration | aaaaa | aaaaa |
Abstract
Description
Claims
Application Information
 - R&D
- Intellectual Property
- Life Sciences
- Materials
- Tech Scout
- Unparalleled Data Quality
- Higher Quality Content
- 60% Fewer Hallucinations
Browse by: Latest US Patents, China's latest patents, Technical Efficacy Thesaurus, Application Domain, Technology Topic, Popular Technical Reports.
© 2025 PatSnap. All rights reserved.Legal|Privacy policy|Modern Slavery Act Transparency Statement|Sitemap|About US| Contact US: help@patsnap.com


