Method for quantifying urea and analyzing device
An analysis device and urea technology, which are applied in chemical method analysis, measurement device, and analysis using chemical indicators, etc., can solve problems such as the inability to measure urea concentration stably
- Summary
- Abstract
- Description
- Claims
- Application Information
AI Technical Summary
Problems solved by technology
Method used
Image
Examples
example 1
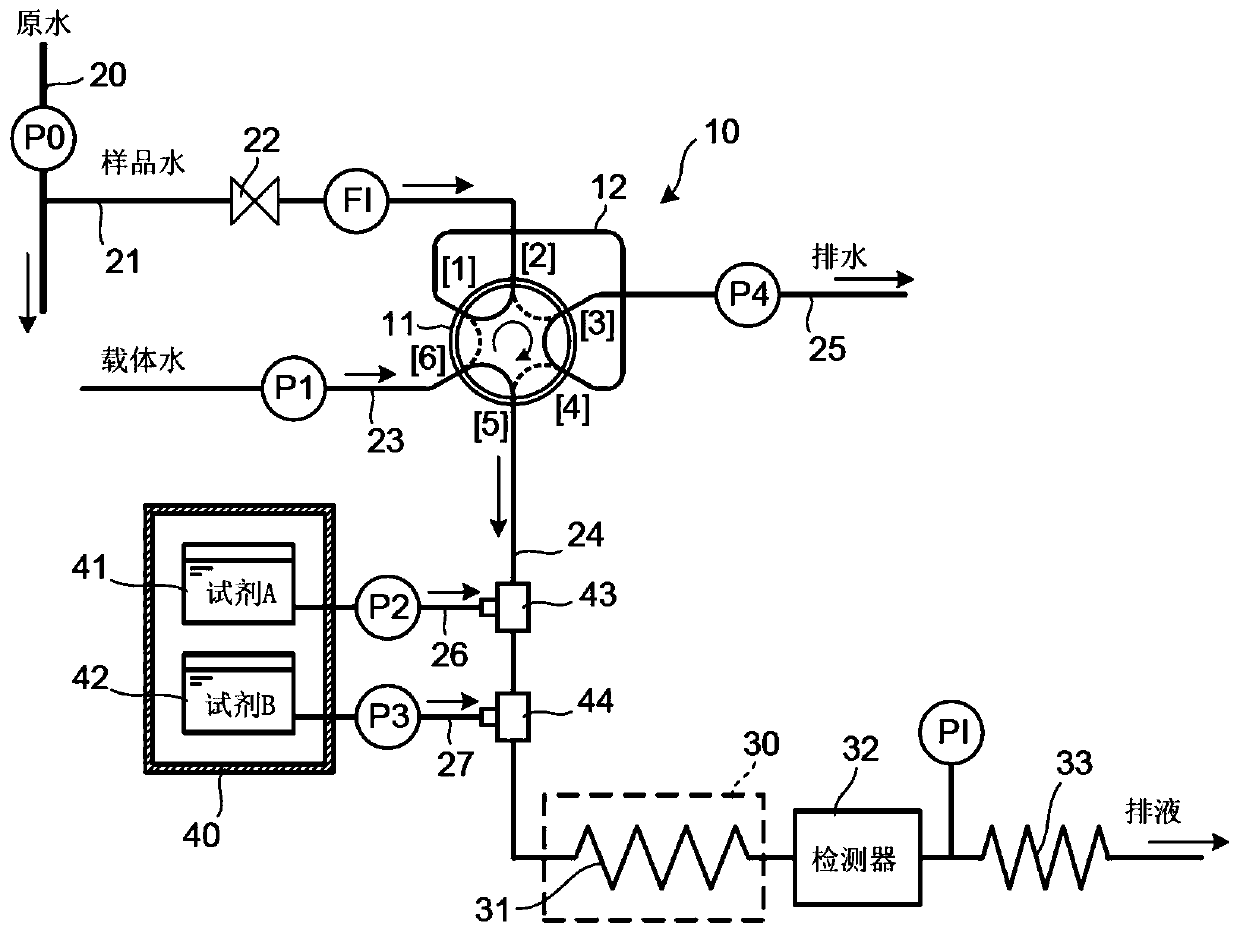
[0035] figure 1 The device shown in is assembled. However, a portion from the line 20 to the flow meter FI is not provided so that the standard solution prepared to have a urea concentration of 60 ppb can be continuously supplied to the sampling valve 10 as sample water. Then, continuously monitor the urea concentration of the standard solution. Here, it was examined how the urea concentration obtained by the detector 32 as the measured value of the peak value of the detected absorbance varied when the standard solution was continuously measured. In this example, 2 g of diacetylmonoxime was dissolved in 100 mL of 10% acetic acid to prepare reagent A (i.e., an acetic acid solution of diacetylmonoxime), and 0.2 g of antipyrine was dissolved in 9 mol / L of sulfuric acid In, to prepare reagent B (that is, the reagent solution containing antipyrine) that the total amount is 100mL, those reagents after preparation are respectively stored in the storage tank 41,42, and each reagent ...
example 2
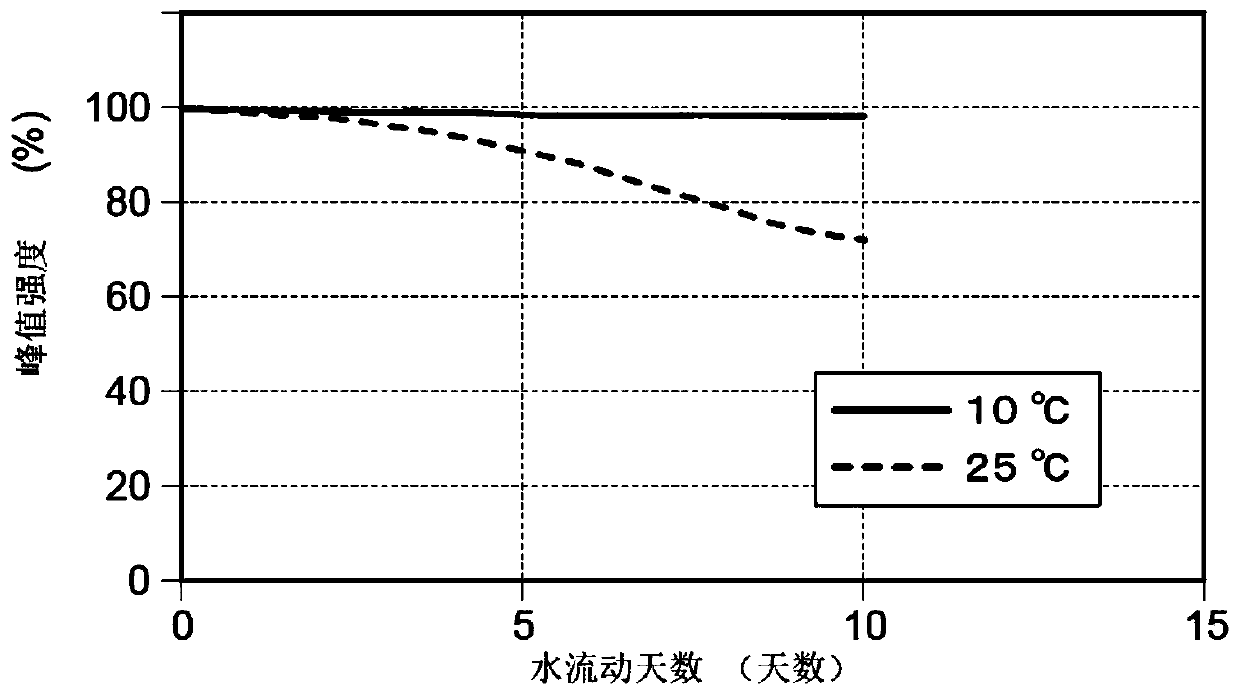
[0038] Reagent B was prepared as in the case of Example 1 and then stored at temperatures of 5°C, 10°C, 15°C, 20°C and 25°C for 10 days. Then, the reagent B stored in this way is supplied to figure 1 device shown. Immediately after supplying reagent B to the device, measure the standard solution with a urea concentration of 60 ppb to obtain its peak intensity. At this time, the peak intensity obtained when the standard solution was measured immediately after the reagent B was prepared was defined as 100%. Reagent A was prepared as in the case of Example 1, then stored and used at normal temperature. Table 1 shows the results.
[0039] [Table 1]
[0040] Reagent storage temperature (°C) Peak intensity (%) 5 98 10 99 15 89 20 80 25 72
[0041] As shown in Table 1, the peak intensity hardly decreased when the storage temperature was 5 °C and 10 °C, while it decreased by about 10% when stored at 15 °C. When stored at 20°C, the peak in...
example 3
[0043] The same experiment as Example 2 was performed except that Reagent A of Example 2 was stored at the same storage temperature as Reagent B of Example 2.
[0044] When reagent A and reagent B were refrigerated and then measured, results obtained were similar to those obtained when only reagent B was refrigerated and then measured (Table 1).
[0045] Figure List Marking
[0046] 10 Sampling valve
[0047] 11 Sample Loop
[0048] 31 Reaction coil
[0049] 32 detectors
[0050] 33 Back pressure coil
[0051] 40 refrigerator
[0052] 41, 42 storage tank
[0053] 43, 44 Mixer
PUM
 Abstract
Description
Claims
Application Information
 - R&D
- Intellectual Property
- Life Sciences
- Materials
- Tech Scout
- Unparalleled Data Quality
- Higher Quality Content
- 60% Fewer Hallucinations
Browse by: Latest US Patents, China's latest patents, Technical Efficacy Thesaurus, Application Domain, Technology Topic, Popular Technical Reports.
© 2025 PatSnap. All rights reserved.Legal|Privacy policy|Modern Slavery Act Transparency Statement|Sitemap|About US| Contact US: help@patsnap.com


