Component quantitative analysis method, test system and storage medium

A quantitative analysis and testing system technology, applied in the direction of material analysis, material excitation analysis, material analysis through optical means, etc., can solve the analysis difficulties of existing proportions, increase the application threshold of laser-induced breakdown spectroscopy technology, and cannot achieve full Element detection and other issues

Active Publication Date: 2021-04-20
HUNAN UNIV
View PDF6 Cites 0 Cited by
  • Summary
  • Abstract
  • Description
  • Claims
  • Application Information

AI Technical Summary

Problems solved by technology

[0004]However, the common problem of the current laser-induced breakdown spectroscopy technology is that, on the one hand, the usual laser-induced breakdown spectroscopy requires the use of nanosecond lasers to obtain higher If the volume is reduced, it is not enough to excite the hydrogen ions in the sample, and the detection of all elements cannot be realized; on the other hand, the integration of the test process is relatively low
This demand has increased the application threshold of laser-induced breakdown spectroscopy
At the same time, in the absence of corresponding data and algorithm support, the analysis of the elemental composition of the target sample through the spectral information obtained by laser-induced breakdown spectroscopy is usually limited to qualitative analysis, while quantitative analysis is relatively difficult.
That is, it is only possible to analyze whether a certain element is contained in the sample material, but it is relatively difficult to analyze the proportion of a specific element in the target sample

Method used


Image

  • Component quantitative analysis method, test system and storage medium
  • Component quantitative analysis method, test system and storage medium
  • Component quantitative analysis method, test system and storage medium

Examples


Embodiment Construction

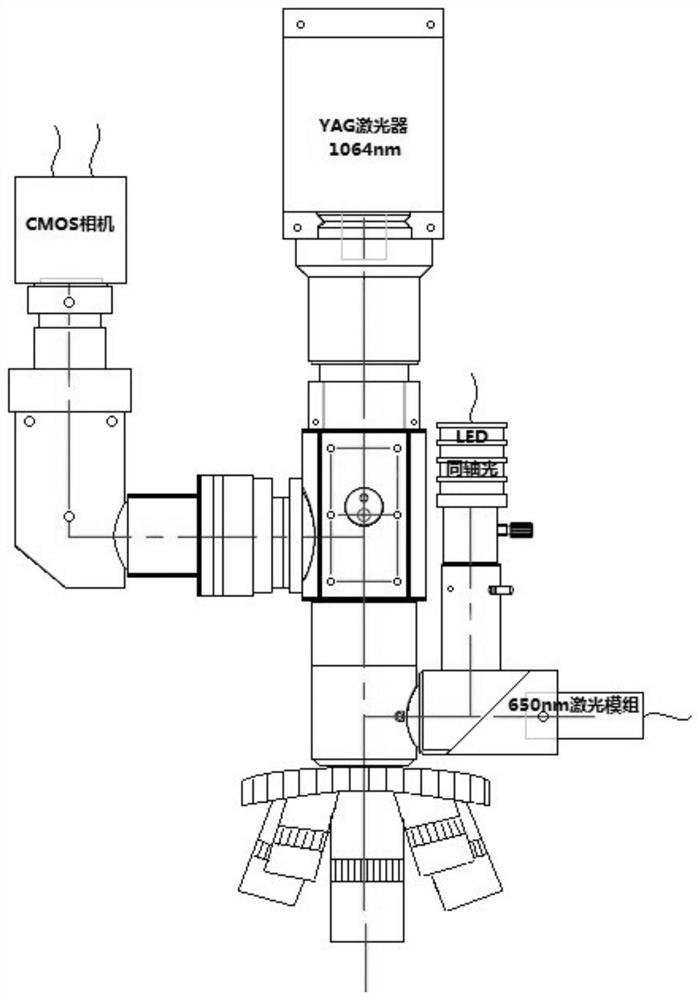
[0037] The present invention will be further described below in conjunction with examples. Such as figure 1 As shown, the test system provided by the embodiment of the present invention is a fully automatic quantitative test system for components based on picosecond laser-induced breakdown spectroscopy. The system is not limited to that described in this embodiment.

[0038] In this embodiment, the test system includes: YAG picosecond laser with 1064nm wavelength (Germany PicoQuantVisUV-1064), CMOS camera (U.S. FLI Kepler KL4040), LED illumination light (U.S. ThorLabs Solis-3C), semiconductor laser with 650nm wavelength (China Huake Optoelectronics DD650), three-axis mobile microscope system (Newport MS-200M-XYZ, USA).

[0039] The three-axis mobile microscope system has a total of four optical path access ports, which are No. 1 optical path access port, No. 2 optical path access port, No. 3 optical path access port and No. 4 optical path access port. The three-axis mobile ...


PUM


Abstract

The invention discloses a component quantitative analysis method, a test system and a storage medium. The method comprises the following steps: acquiring spectral data of a plurality of samples after laser excitation and the real content of components in each sample; training a partial least squares regression+support vector machine regression model by utilizing the spectral data of each sample, and during training of the partial least squares regression model, taking the spectral data with the maximum contribution degree corresponding to each sample in the training set as input data and taking the real content of each component of the corresponding sample as a training label; when a support vector machine regression model is trained, acquiring the predicted content of each component of a sample in a prediction set by using the trained partial least squares regression model, using the residual error between the predicted content and the real content as a training label, and using the spectral data of each sample in the prediction set as input data. According to the invention, quantitative measurement of components is realized based on the constructed model, and a set of test system for quantitative analysis of components by using laser-induced breakdown spectroscopy is constructed.

Description

technical field [0001] The invention belongs to a fully automatic full-component detection technology, and specifically relates to a component quantitative analysis method, a test system and a storage medium using laser-induced breakdown spectroscopy, which are used to realize rapid and convenient detection of materials in the case of low material loss. Quantitative analysis and measurement of components. Background technique [0002] Laser-induced breakdown spectroscopy technology is a kind of plasma that uses laser to break down a small part of the material on the surface of the sample and generate light, and then analyze the spectrum emitted by the plasma, that is, to analyze the composition of the sample material All-element detection means. This test method has many features and advantages. First of all, the detection process of laser-induced breakdown spectroscopy has little damage to the target sample, and only needs to break down the microgram-level material on the...

Claims


Application Information

Patent Timeline
Patent Type & Authority Applications(China)
IPC IPC(8): G01N21/63G01N21/01
CPCY02P90/30
Inventor 潘安练
Owner HUNAN UNIV
Why Eureka
Try Eureka