Method for measuring content of hydrogen peroxide through low-field nuclear magnetic resonance
A technology of low-field nuclear magnetic resonance and measurement methods, applied in the direction of analysis by nuclear magnetic resonance, etc., can solve problems such as short measurement time, environmental pollution, and poor accuracy of measurement results, and achieve the effect of short detection cycle
- Summary
- Abstract
- Description
- Claims
- Application Information
AI Technical Summary
Problems solved by technology
Method used
Image
Examples
Embodiment 1
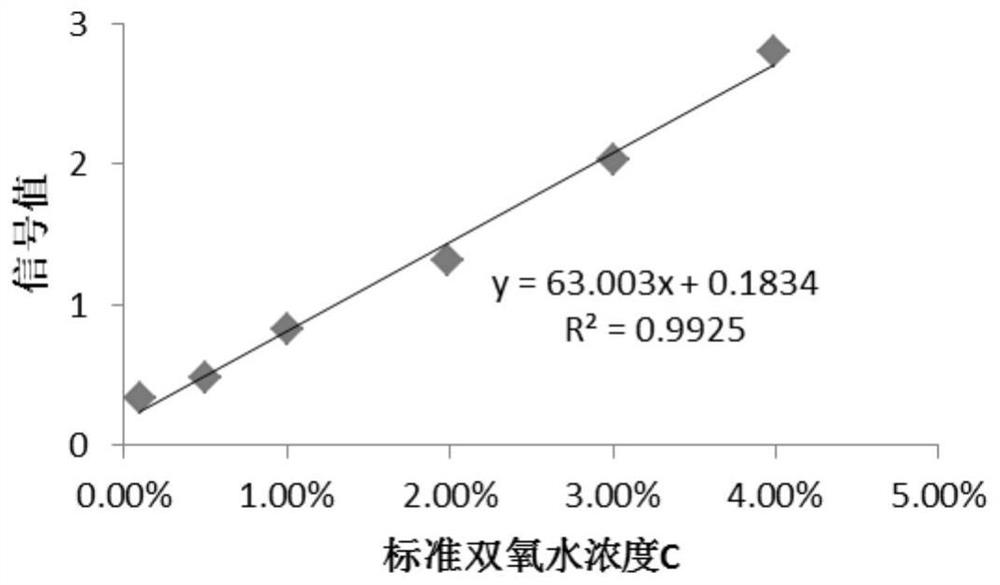
[0033] First use the standard oil sample to calibrate the low-field NMR; then prepare standard hydrogen peroxide with different concentrations (0.10%, 0.50%, 1.00%, 1.99%, 3.00%, 3.99%), and record the signal values of each concentration with a low-field NMR analyzer Si; take the prepared standard hydrogen peroxide concentration as the abscissa, convert the signal to the ordinate, and draw a Si and Ci scatter diagram; then use a one-dimensional linear equation to fit, calculate the regression equation, and calculate the working curve of hydrogen peroxide.
[0034] The concentration of the standard hydrogen peroxide provided in Example 1 of the present invention and the measured corresponding signal values are recorded in Table 1.
Embodiment 2
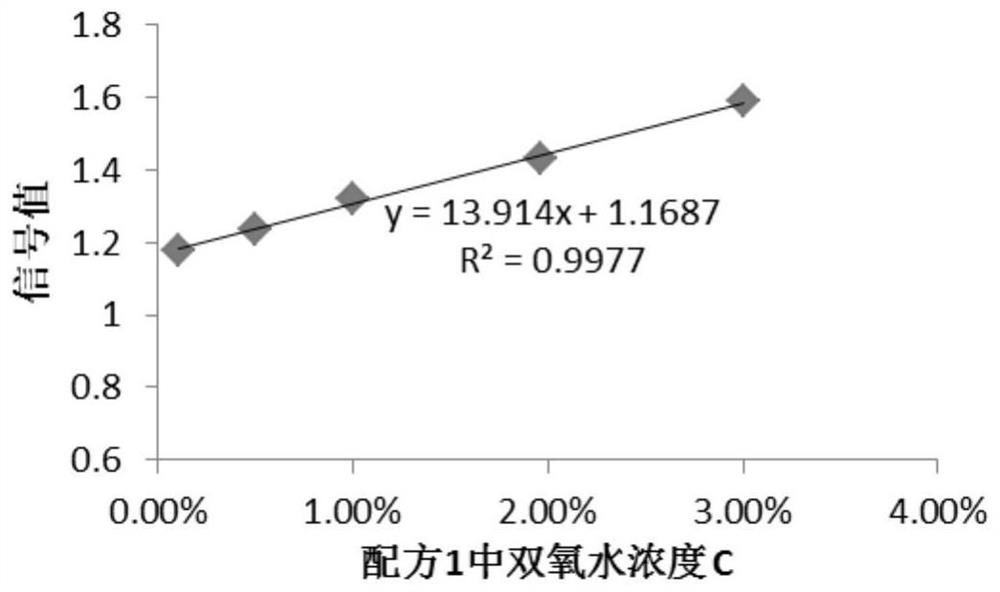
[0036] First, a standard oil sample is used to calibrate the low-field NMR; then, standard hydrogen peroxide is added to formula 1, which is a neutral formula solution. Using a low-field nuclear magnetic resonance analyzer, first measure the base signal S0 of the formula when hydrogen peroxide is not added (C=0); For the standard hydrogen peroxide sample, its signal value is recorded as Si respectively; with the concentration of the added standard hydrogen peroxide as the abscissa and the signal value as the ordinate, draw a Si and Ci scatter diagram; Obtain the working curve of hydrogen peroxide; take the sample to be tested, measure its relaxation signal value S, and calculate the corresponding concentration of hydrogen peroxide according to the working curve.
[0037] The concentration of the standard hydrogen peroxide provided in Example 2 of the present invention and the measured corresponding signal values are recorded in Table 2.
Embodiment 3
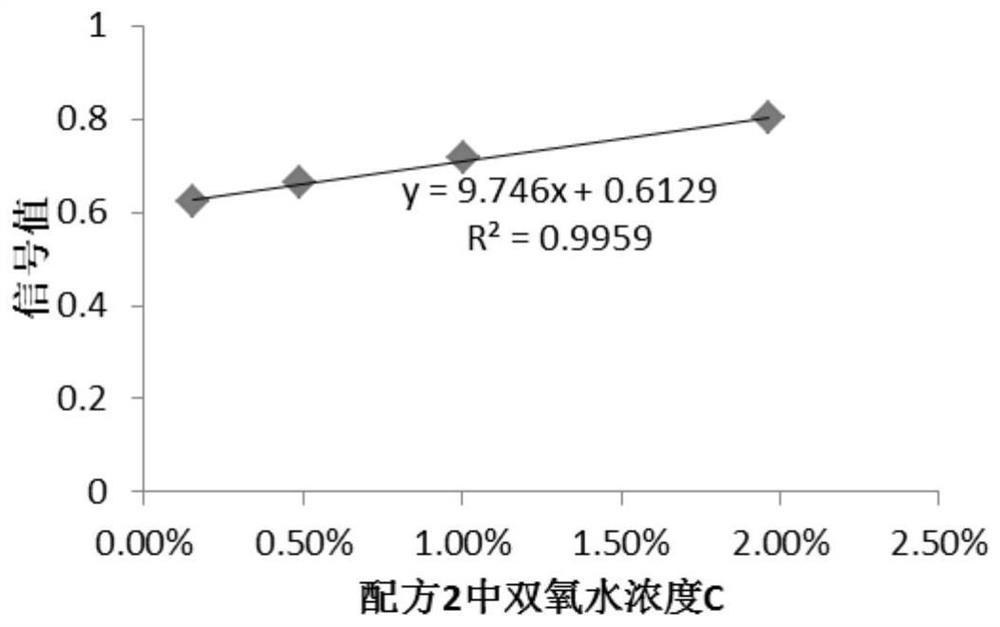
[0039]First, a standard oil sample is used to calibrate the low-field NMR; then, standard hydrogen peroxide is added to formula 2, which is an alkaline formula solution. Using a low-field nuclear magnetic resonance analyzer, first measure the base signal S0 of the formula (C=0) without adding hydrogen peroxide; then measure a plurality of standard hydrogen peroxide samples with different concentrations (0.155%, 0.488%, 1.003%, 1.963%) , its signal value is denoted as Si respectively; With the concentration of standard hydrogen peroxide added as abscissa, the signal value is ordinate, draw Si and Ci scatter diagram; Working curve: take the sample to be tested, measure its relaxation signal value S, and calculate the corresponding hydrogen peroxide concentration according to the working curve.
[0040] The concentration of the standard hydrogen peroxide provided in Example 3 of the present invention and the measured corresponding signal values are recorded in Table 3.
PUM
 Abstract
Description
Claims
Application Information
 - R&D
- Intellectual Property
- Life Sciences
- Materials
- Tech Scout
- Unparalleled Data Quality
- Higher Quality Content
- 60% Fewer Hallucinations
Browse by: Latest US Patents, China's latest patents, Technical Efficacy Thesaurus, Application Domain, Technology Topic, Popular Technical Reports.
© 2025 PatSnap. All rights reserved.Legal|Privacy policy|Modern Slavery Act Transparency Statement|Sitemap|About US| Contact US: help@patsnap.com


