Method for diagnosing alzheimer's disease using silver nanogap shell
A silver nanotechnology for Alzheimer's disease, applied in disease diagnosis, material inspection products, instruments, etc., can solve problems such as unreachable sensitivity, patient pain, and high cost
- Summary
- Abstract
- Description
- Claims
- Application Information
AI Technical Summary
Problems solved by technology
Method used
Image
Examples
Embodiment 1
[0046] Example 1. Preparation of AgNGS-Aβ40 and AgNGS-Aβ42
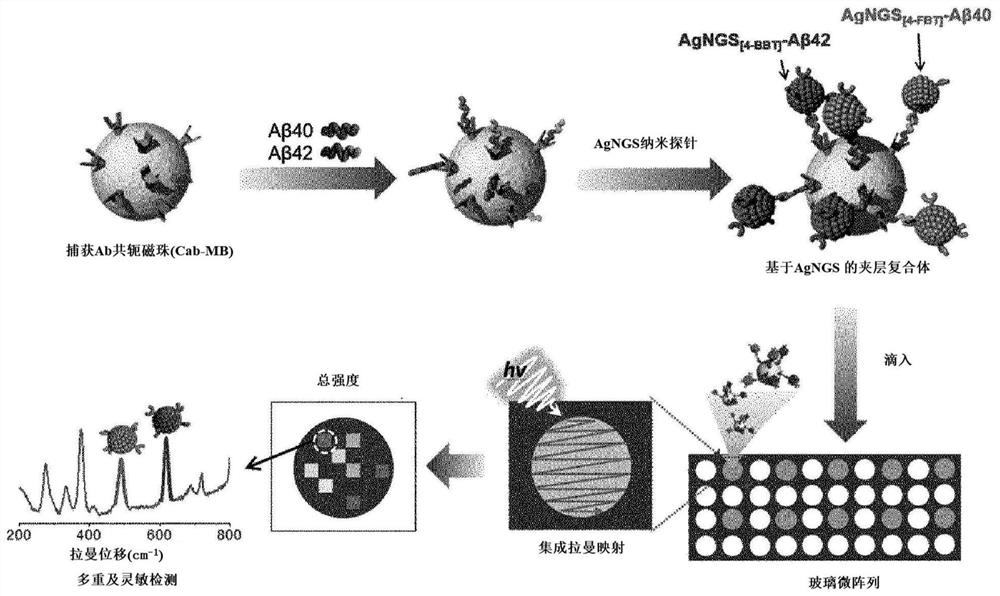
[0047] Silver nanoslit shells into which antibodies specific for Aβ40 or Aβ42 were independently introduced were produced according to the method described below (see KR 10-1944346).
[0048] 1-1. Synthesis of silica particles and formation of thiol interaction groups
[0049] (1) Dissolve tetraethyl orthosilicate in 40ml of pure ethanol, add ammonium hydroxide, and react at room temperature for 20 hours.
[0050] (2) After removing unreacted substances with a centrifuge, the final dilution was to a concentration of 1 mg / ml.
[0051] (3) Add mercaptopropyltripolyethoxysilane and ammonium hydroxide to 1 ml of synthetic silica particles (1 mg / ml), and react at room temperature for 12 hours.
[0052] (4) Use a centrifuge to remove unreacted substances. (MPTS-silica)
[0053] 1-2. Formation of silver nano-cracked shells on the surface of silica particles using thiol-silver binding force
[0054] (1) MPTS-silica,...
Embodiment 2
[0064] Example 2. Detection of two kinds of Alzheimer's disease (AD) biomarkers (Aβ40, Aβ42)
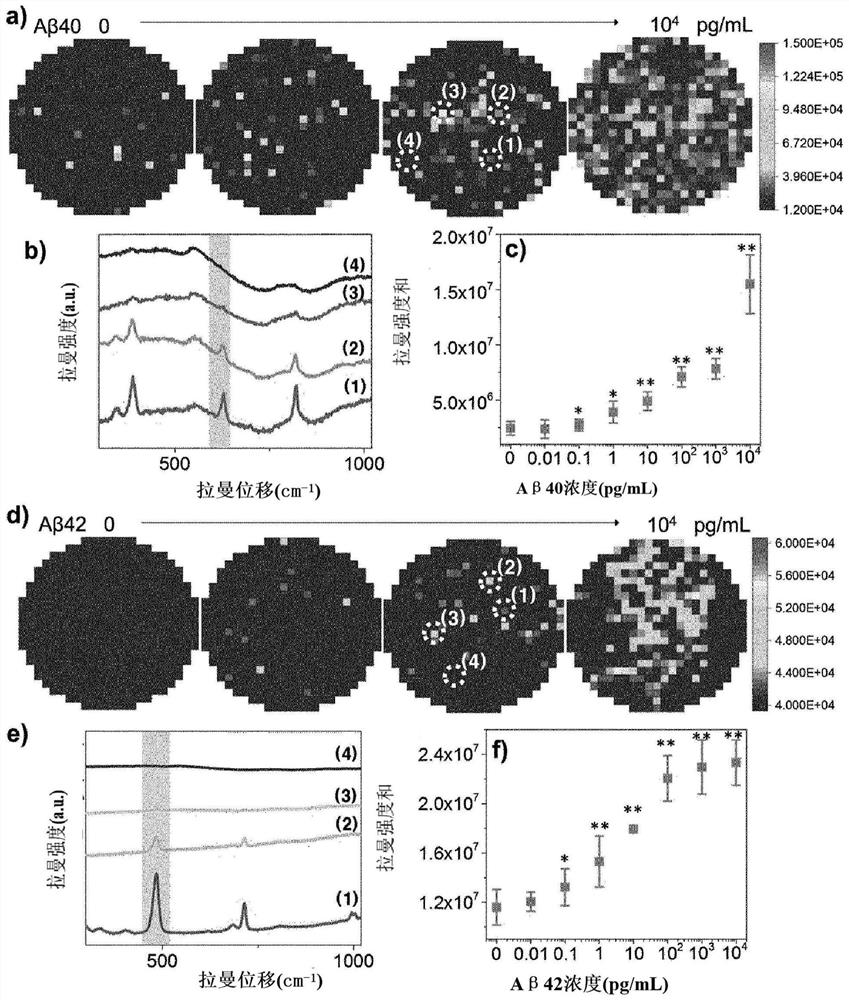
[0065] figure 2 It is a figure showing the detection results of two kinds of Alzheimer's disease (AD) biomarkers (Aβ, Aβ) ((a) is a microarray mapping image for each concentration detected for Aβ, (b) is a microarray mapping image showing (a) is a graph of the AgNGS Raman signal for the region indicated, (c) is a graph of the signal for each concentration of (a), (d) is a microarray mapping image for each concentration of Aβ detection, (e) is For the Raman signal of AgNGS in the region shown in (d), (f) is a graph of the signal for each concentration of (d)).
[0066] if refer to figure 2 It was confirmed that Aβ40 and Aβ42 can be detected in a concentration-dependent manner by the AgNGS-based SERS immunoassay.
Embodiment 3
[0067] Example 3. Specificity test of AgNGS-based SERS immune response
[0068] image 3 is a graph showing the specificity test of the AgNGS-based SERS immune response.
[0069] image 3 (a) AgNGS modified with an antibody specific for each target reacts only with target biomarkers specifically for each target, and exhibits a Raman signal by immunoreaction. image 3 (b) When the concentration of Aβ42 is fixed at 10 ng / mL and the concentration of Aβ40 is changed to 0-10 ng / mL, for the mixed solution of the two biomarkers, the AgNGS-based SERS immunoassay shows the expression of the two biomarkers. Raman signal slope with concentration change. Additionally, if referring to image 3 (c), When Aβ40 and Aβ42 are present in the ratio on the x-axis, the AgNGS-based SERS immunoassay shows a propensity for Raman signals reflecting the concentration changes of the two biomarkers. From the corresponding results, it can be demonstrated that the AgNGS-based SERS immunoassay can spe...
PUM
 Abstract
Description
Claims
Application Information
 - R&D
- Intellectual Property
- Life Sciences
- Materials
- Tech Scout
- Unparalleled Data Quality
- Higher Quality Content
- 60% Fewer Hallucinations
Browse by: Latest US Patents, China's latest patents, Technical Efficacy Thesaurus, Application Domain, Technology Topic, Popular Technical Reports.
© 2025 PatSnap. All rights reserved.Legal|Privacy policy|Modern Slavery Act Transparency Statement|Sitemap|About US| Contact US: help@patsnap.com


