Biomarker for white matter lesion and application thereof
A biomarker and white matter technology, applied in the field of biomarkers for white matter lesions, can solve the problems of high cost and expensive detection equipment, and achieve the effects of cost reduction and accurate detection results.
- Summary
- Abstract
- Description
- Claims
- Application Information
AI Technical Summary
Problems solved by technology
Method used
Image
Examples
Embodiment 1
[0035] (1) Patient population standard
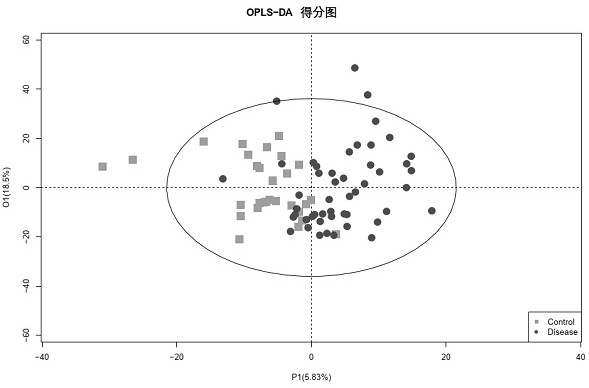
[0036] The model establishment sample group was 78 people. The control group: there were no abnormalities in the MRI nuclear magnetic resonance examination, and the age range was above 45, a total of 29 people.
[0037] Patient population: 49 patients with an age range of 45 and above showed infarcts in the white matter of the brain as detected by MRI.
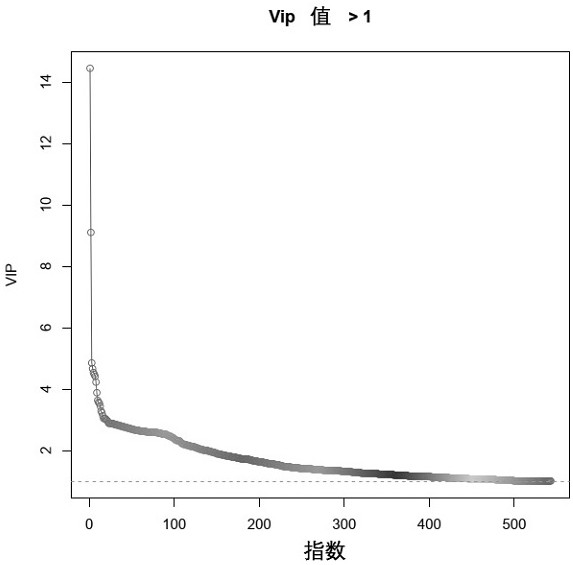
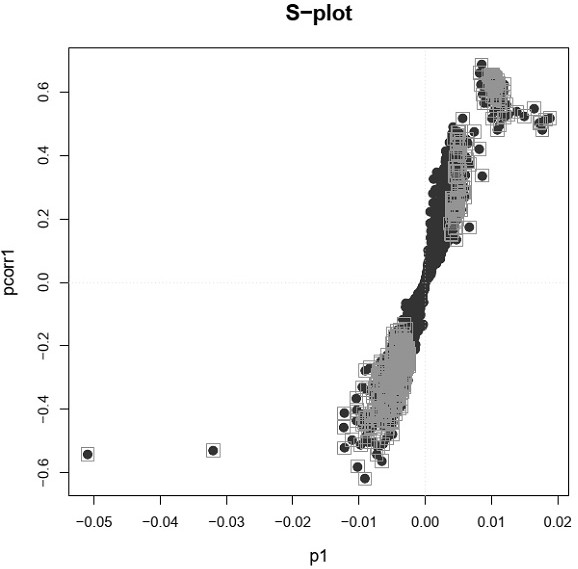
[0038] (2) Model establishment
[0039] 1. Sample pretreatment
[0040] The clinical information and serum samples of the above population were collected, 200 μL of serum was extracted with 600 μL of pre-cooled isopropanol, vortexed with a vortex oscillator (MX-S, Scilogex, USA) for 1 min, incubated at room temperature for 10 min, and then the extraction mixture was placed in- Store overnight at 20°C, centrifuge at 4000rr for 20min in a refrigerated centrifuge (D3024R, Scilogex, USA), transfer the supernatant to a new centrifuge tube, and wash with isopropanol / acetonitrile / water (2:1:...
Embodiment 2
[0070] The logistic regression model established in Example 1 was verified using an external data set. The model verification sample group was 130 people, and the sampling standard was the same as that in Example 1. There were 85 patients and 45 normal controls. Use the method in Example 1 to perform ultra-high performance liquid chromatography-mass spectrometry to detect the above five biomarkers in serum and combine them with any one of fasting blood glucose, homocysteine, glycosylated hemoglobin, cholesterol and body weight Item or two indicators, to verify the accuracy of the model results in Example 1, and draw the corresponding ROC curve, the results are as follows:
[0071] "Model A" variable is R1+R20+K9, and the result of the ROC curve is as follows Figure 4 , Sensitivity (sensitivity)=1, Specificity (specificity)=1, Accuracy (accuracy)=1.
[0072] "Model B" variable is R1+R14+K3+K9, the result of the ROC curve is as follows Figure 5 As shown, Sensitivity (sensiti...
PUM
 Abstract
Description
Claims
Application Information
 - R&D
- Intellectual Property
- Life Sciences
- Materials
- Tech Scout
- Unparalleled Data Quality
- Higher Quality Content
- 60% Fewer Hallucinations
Browse by: Latest US Patents, China's latest patents, Technical Efficacy Thesaurus, Application Domain, Technology Topic, Popular Technical Reports.
© 2025 PatSnap. All rights reserved.Legal|Privacy policy|Modern Slavery Act Transparency Statement|Sitemap|About US| Contact US: help@patsnap.com


