Method for estimating wide-band harmonic phase and its indeterminacy based on NTN calibration
A phase and harmonic technology, applied in baseband system components, analog/digital conversion calibration/test, phase modulation carrier system, etc., can solve the problem of inability to accurately obtain broadband harmonic phase, and achieve the effect of robust estimation
- Summary
- Abstract
- Description
- Claims
- Application Information
AI Technical Summary
Problems solved by technology
Method used
Image
Examples
specific Embodiment approach 1
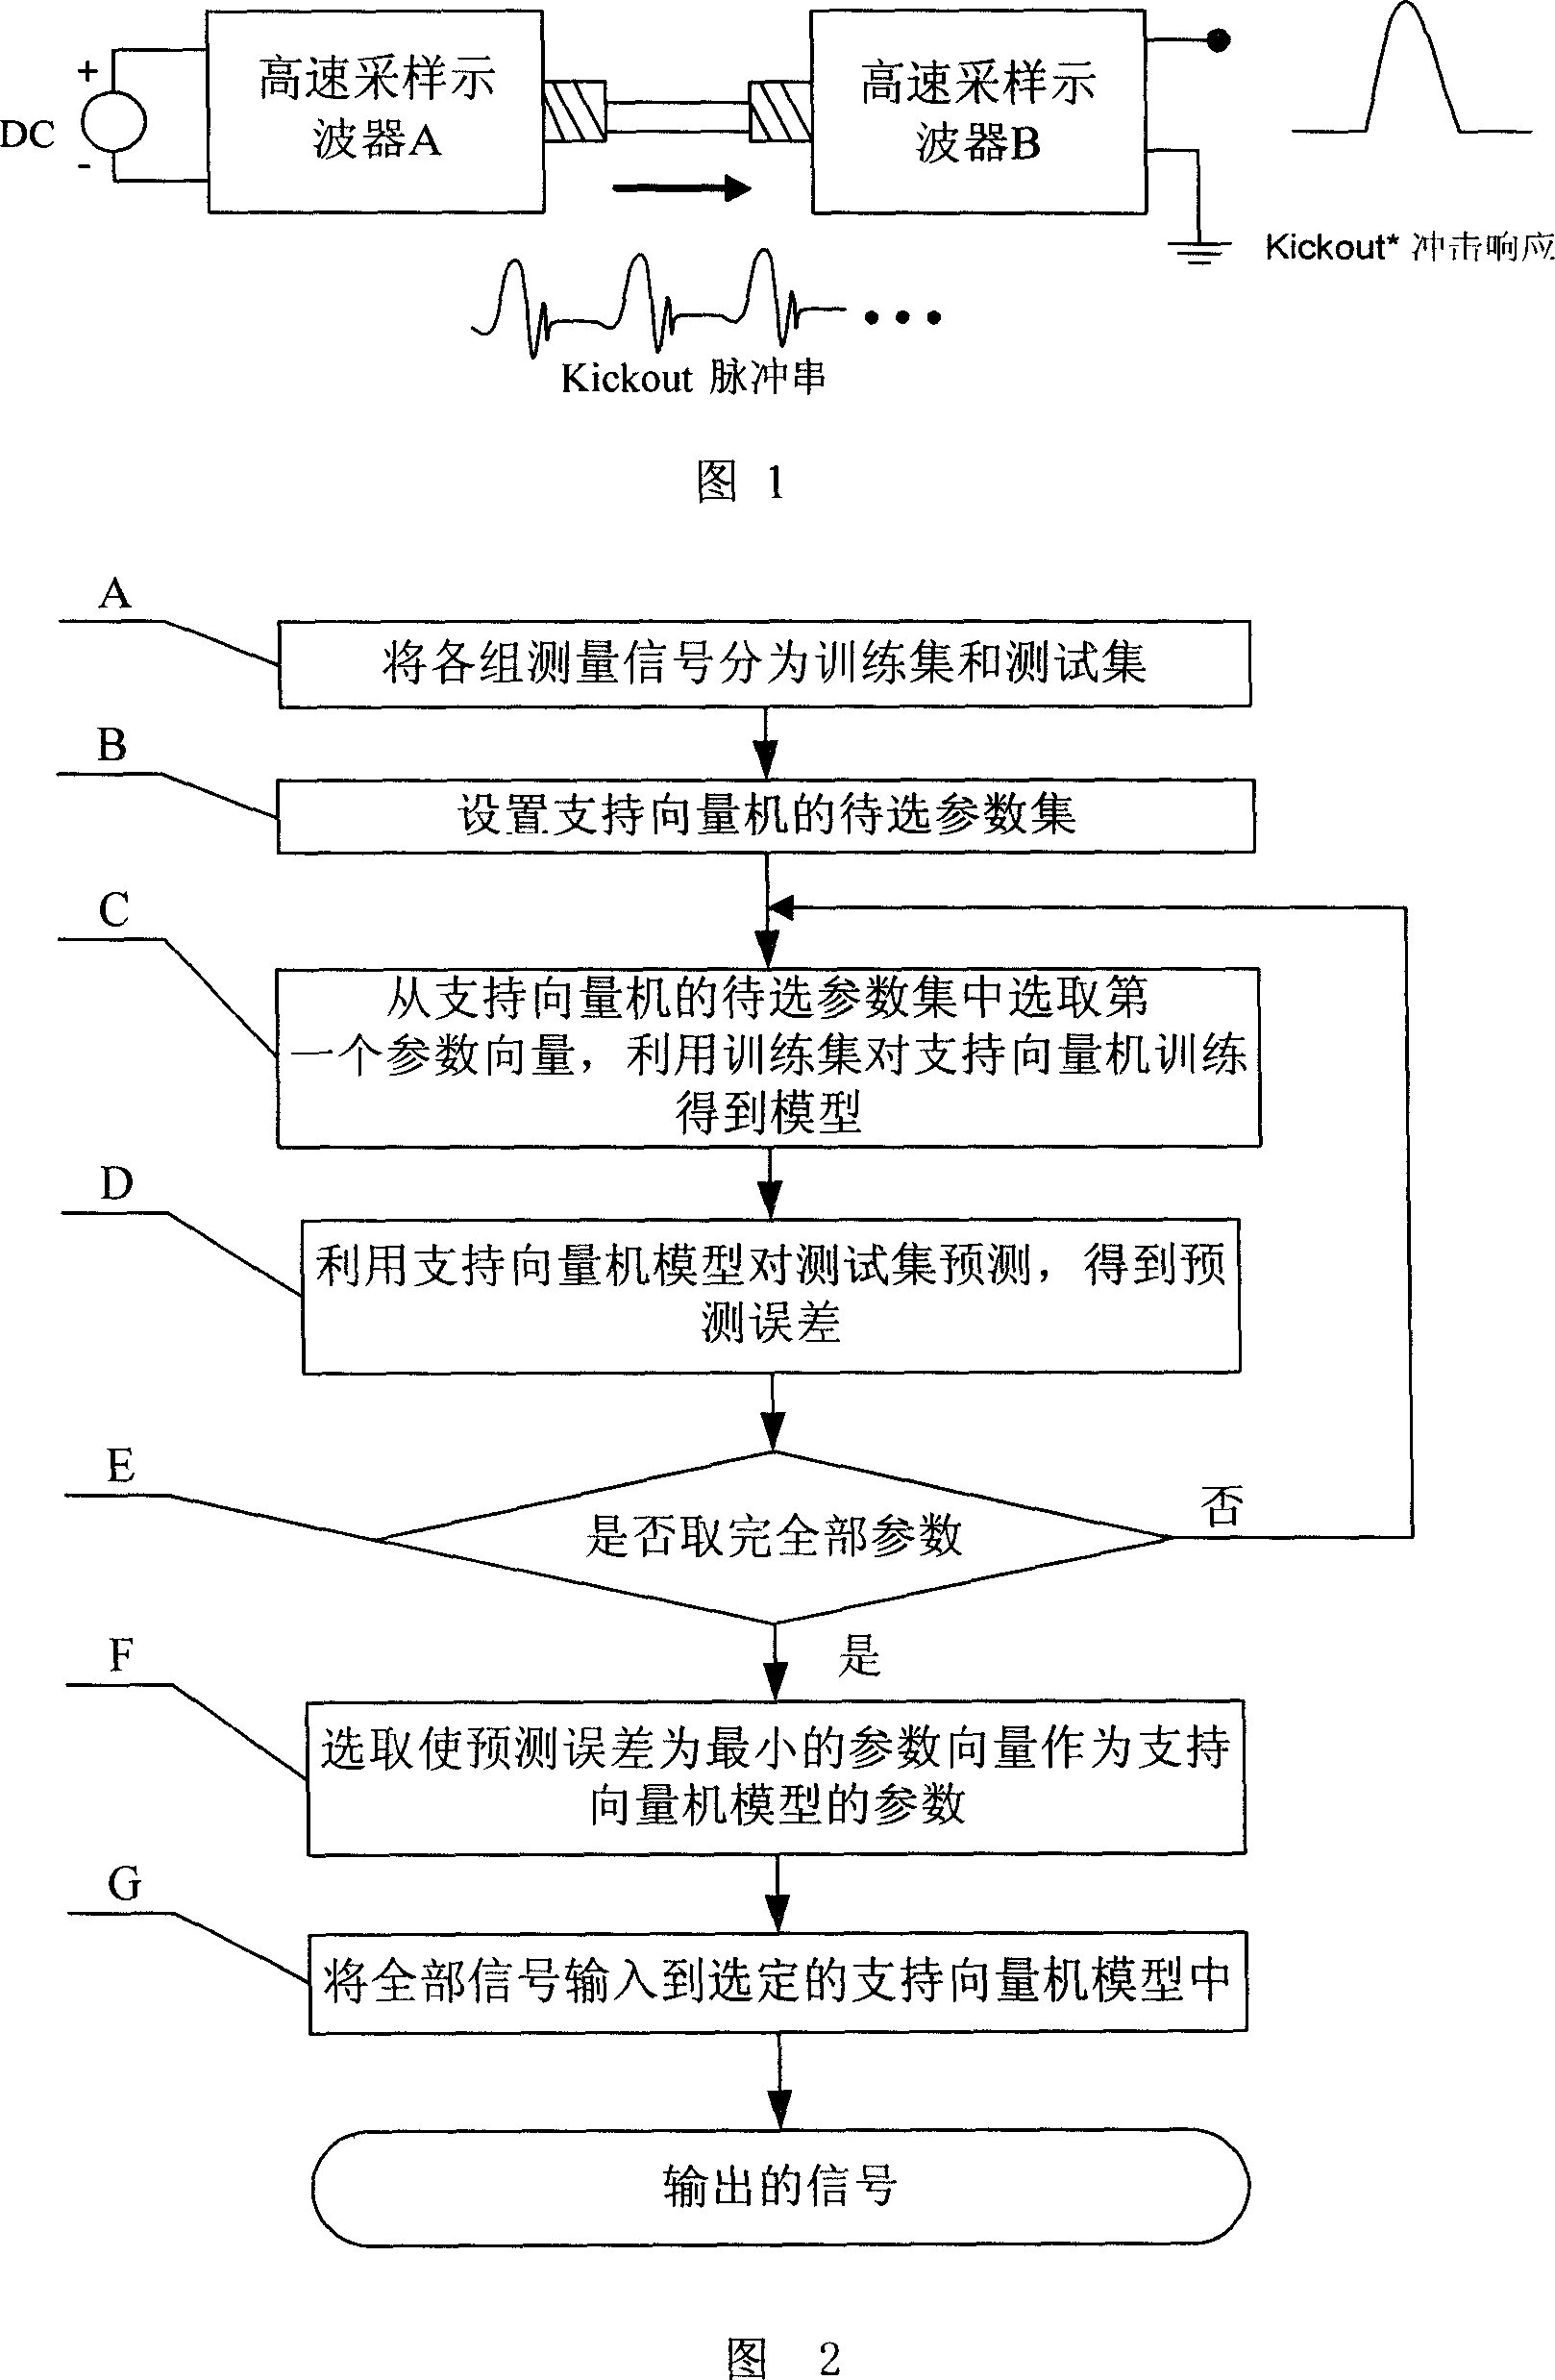
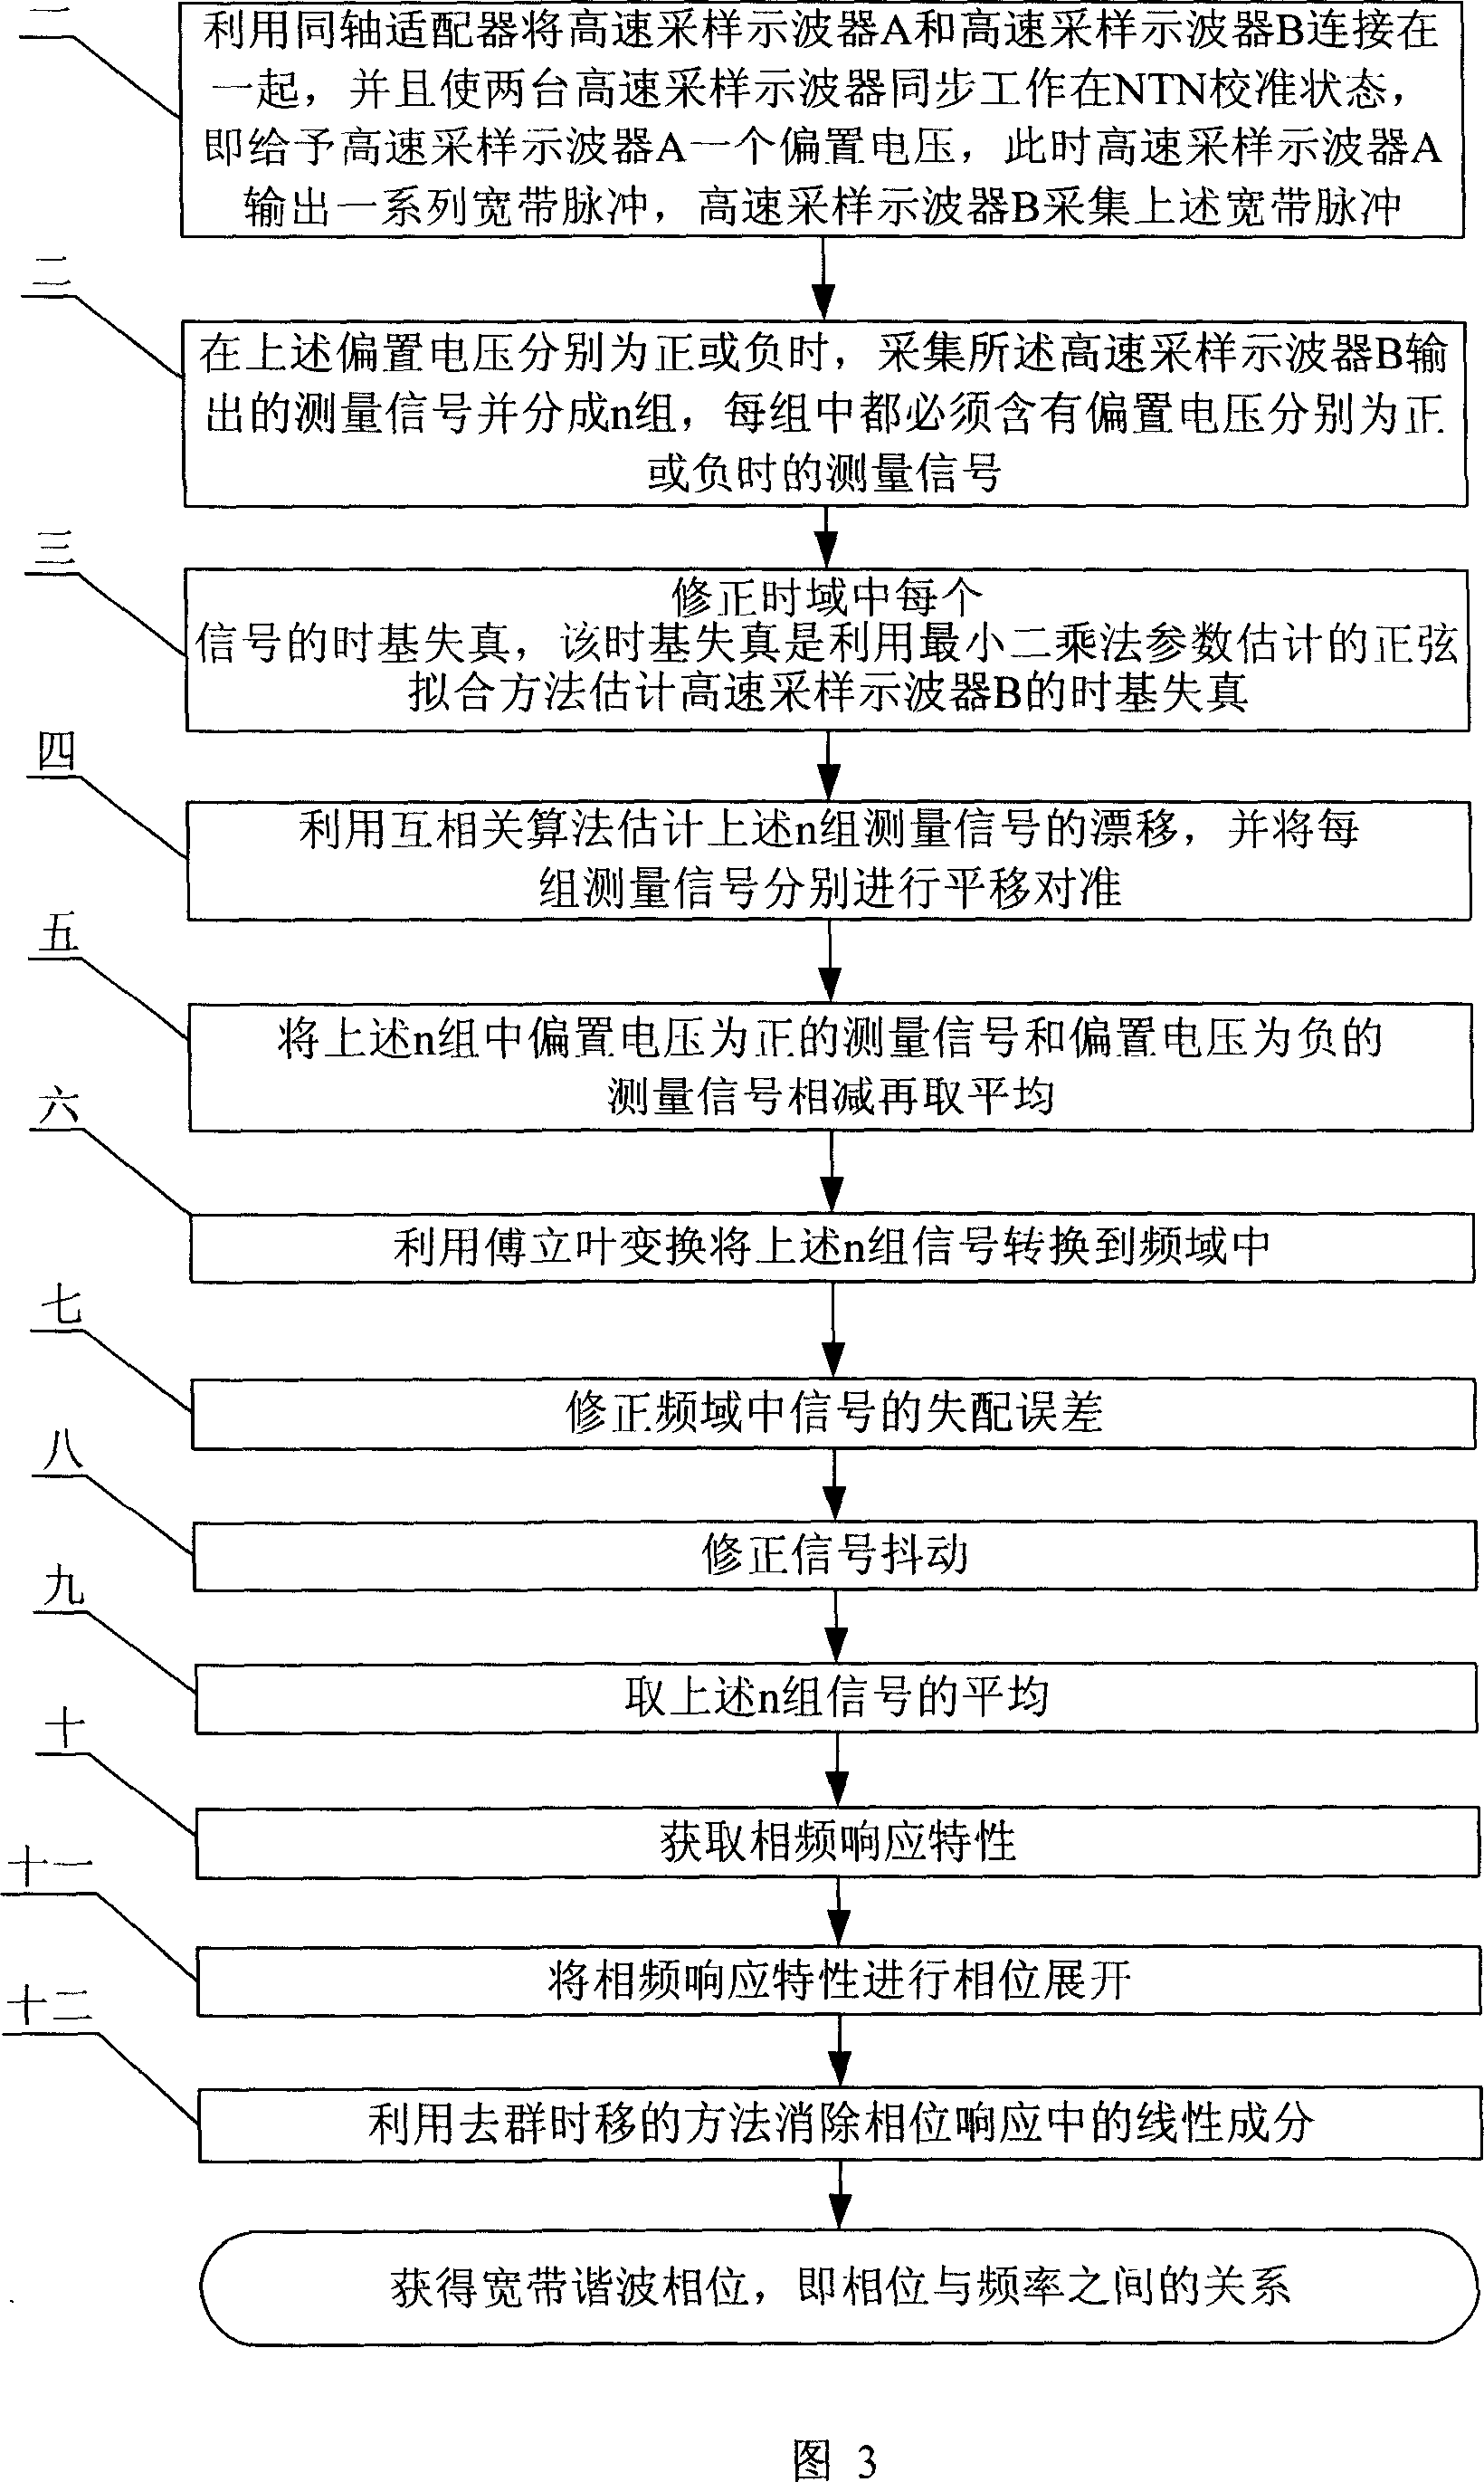
[0037] Specific embodiment one: as shown in Figure 1 and Figure 3, based on the accurate and robust estimation method of the wideband harmonic phase of NTN calibration technology, described estimation method is carried out in sequence according to the following steps:
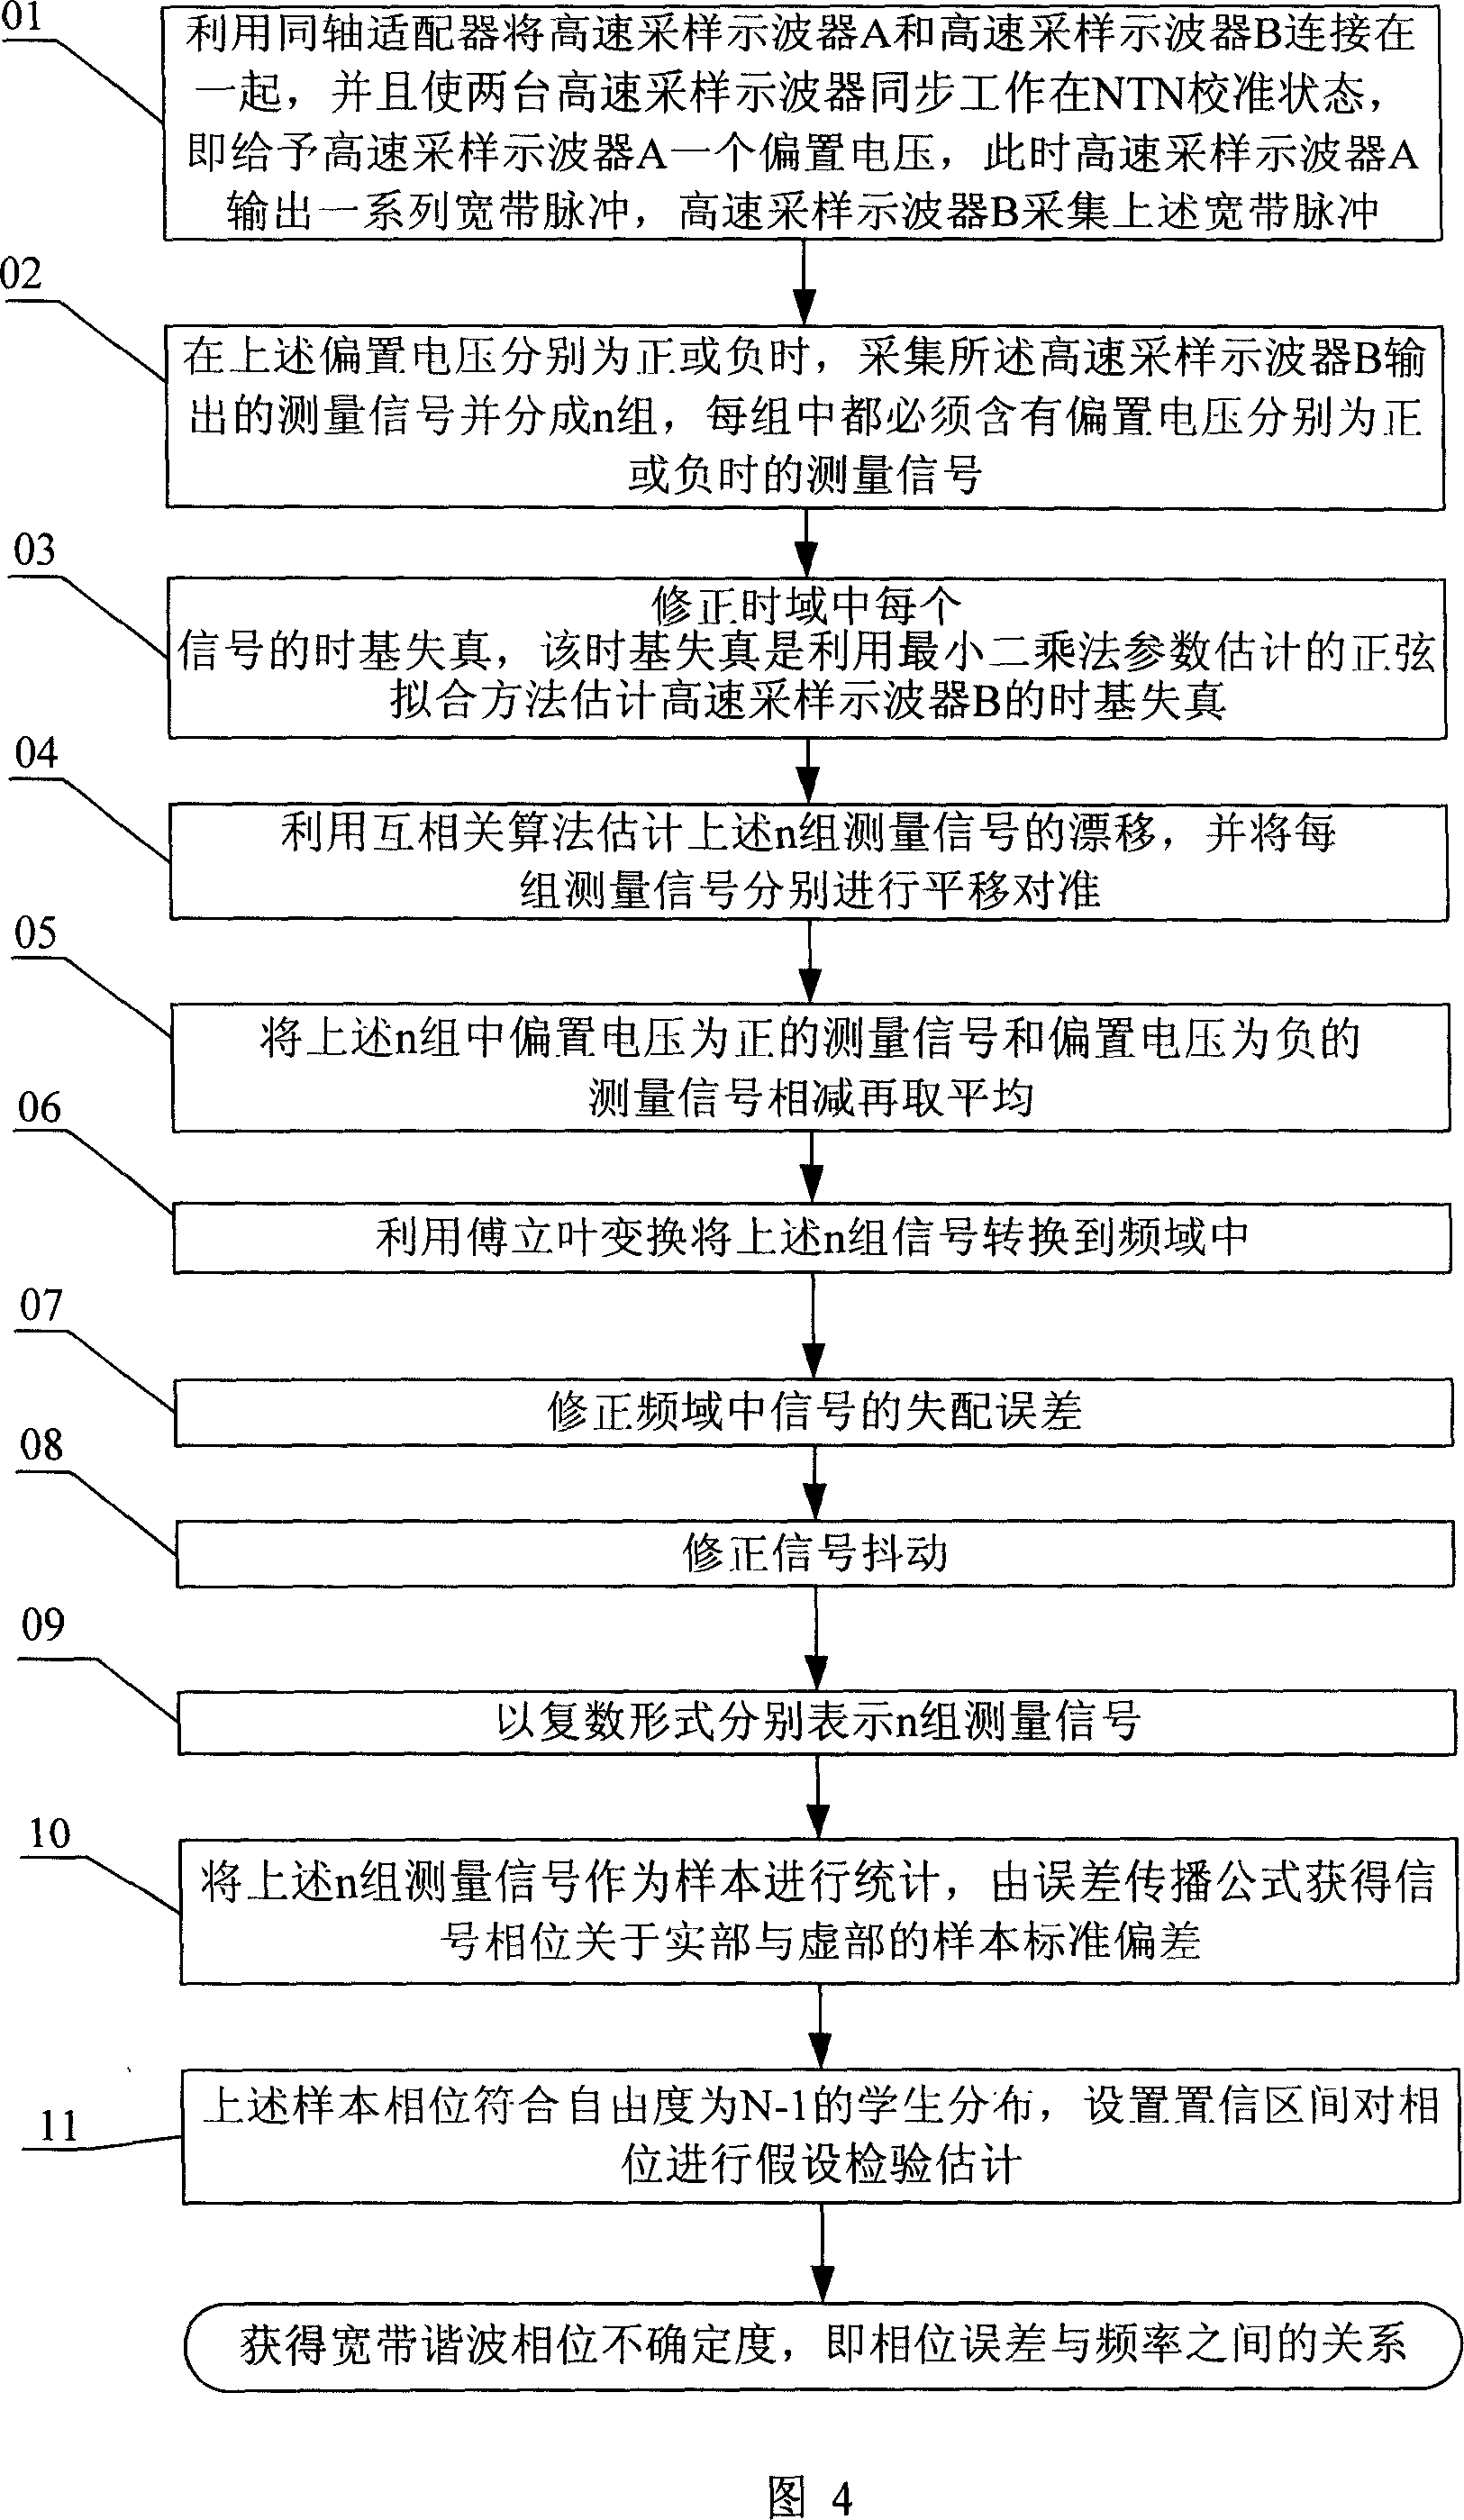
[0038] Step 1. As shown in Figure 1, use a coaxial adapter to connect high-speed sampling oscilloscope A and high-speed sampling oscilloscope B together, and make the two high-speed sampling oscilloscopes work synchronously in the NTN calibration state, that is, give high-speed sampling oscilloscope A a bias Voltage, at this time high-speed sampling oscilloscope A outputs a series of broadband pulses, high-speed sampling oscilloscope B collects the above-mentioned broadband pulses, high-speed sampling oscilloscope A and high-speed sampling oscilloscope B are exactly the same;
[0039] Step 2. When the above-mentioned bias voltages are respectively positive or negative, collect the measurement signals output by t...
specific Embodiment approach 2
[0058] Specific embodiment two: as shown in Figure 1 and 3, the difference between this specific embodiment and specific embodiment one is: step 4 utilizes the specific process of cross-correlation algorithm to carry out successively according to the following steps:
[0059] I. Select the first group of measurement signals as the reference signal;
[0060] II. Calculate the drift between each set of measurement signals and reference signals with a cross-correlation algorithm;
[0061] III. Estimate the drift between any two sets of measured signals;
[0062] IV. Calculate the weighted time base drift;
[0063] V. Estimate the average value of the time base drift of any two groups of measurement signals, as shown in the following formula:
[0064] d ^ kj = 1 2 ( 2 δ ^ ...
specific Embodiment approach 3
[0111] Specific embodiment three: as shown in Figure 1 to Figure 3, the difference between this specific embodiment and specific embodiment one or two is: as shown in Figure 2, use the support vector machine algorithm to process each group of measurement signals respectively The method proceeds as follows:
[0112] A. Divide each group of measurement signals into a training set and a test set;
[0113] B. Setting the parameter set to be selected for the support vector machine;
[0114] C. Select a parameter vector from the candidate parameter set of the support vector machine, and use the training set to train the support vector machine to obtain a model;
[0115] D. Use the support vector machine model to predict the test set and obtain the prediction error;
[0116] E, judging whether to get all the parameters; judging if so, then performing step F: selecting the parameter vector that makes the prediction error the smallest as the parameter of the support vector machine mo...
PUM
 Abstract
Description
Claims
Application Information
 - R&D
- Intellectual Property
- Life Sciences
- Materials
- Tech Scout
- Unparalleled Data Quality
- Higher Quality Content
- 60% Fewer Hallucinations
Browse by: Latest US Patents, China's latest patents, Technical Efficacy Thesaurus, Application Domain, Technology Topic, Popular Technical Reports.
© 2025 PatSnap. All rights reserved.Legal|Privacy policy|Modern Slavery Act Transparency Statement|Sitemap|About US| Contact US: help@patsnap.com


