Method for calibrating spectrophotometric apparatus
a spectrophotometric and apparatus technology, applied in seismology for waterlogging, instruments, testing dairy products, etc., can solve the problems of unreliable method, reagentless spectrophotometric apparatus calibration used to measure the concentration of analytes, and compromise specimen integrity, etc., to achieve simple and reliable results
- Summary
- Abstract
- Description
- Claims
- Application Information
AI Technical Summary
Benefits of technology
Problems solved by technology
Method used
Image
Examples
example 1
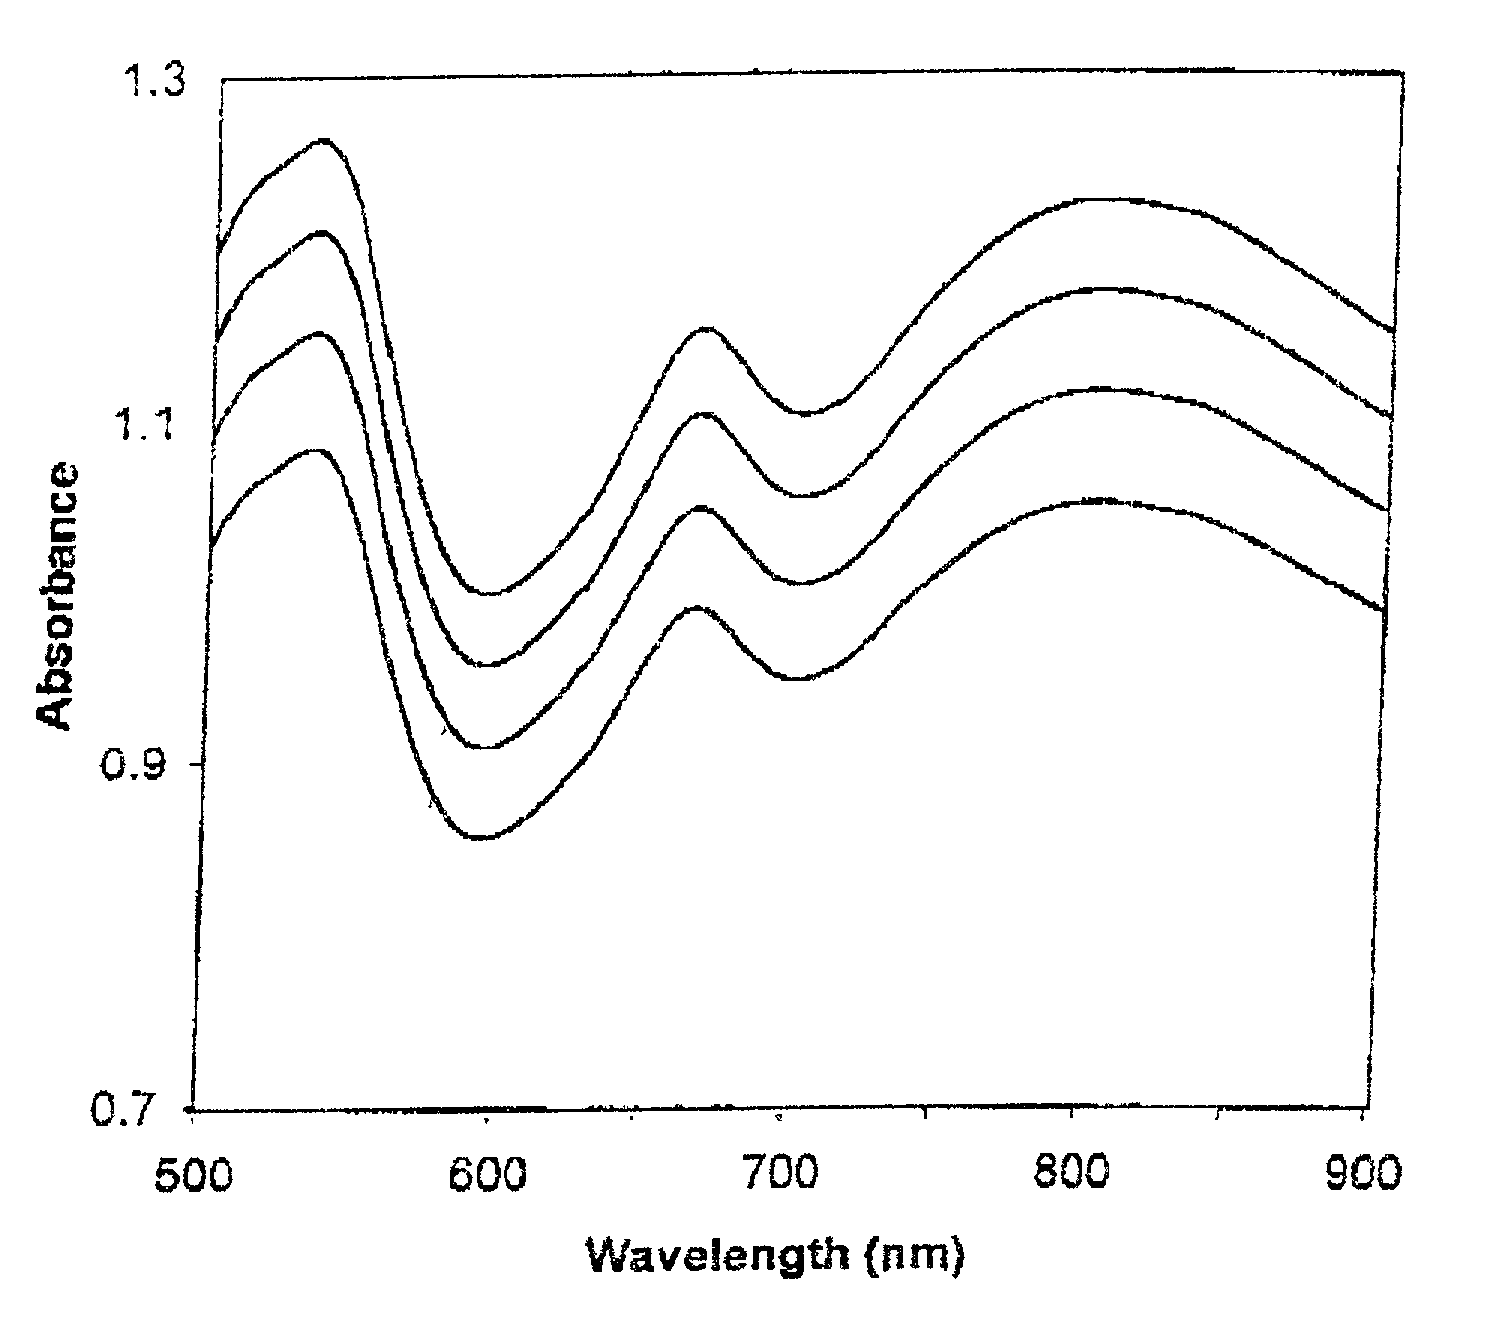
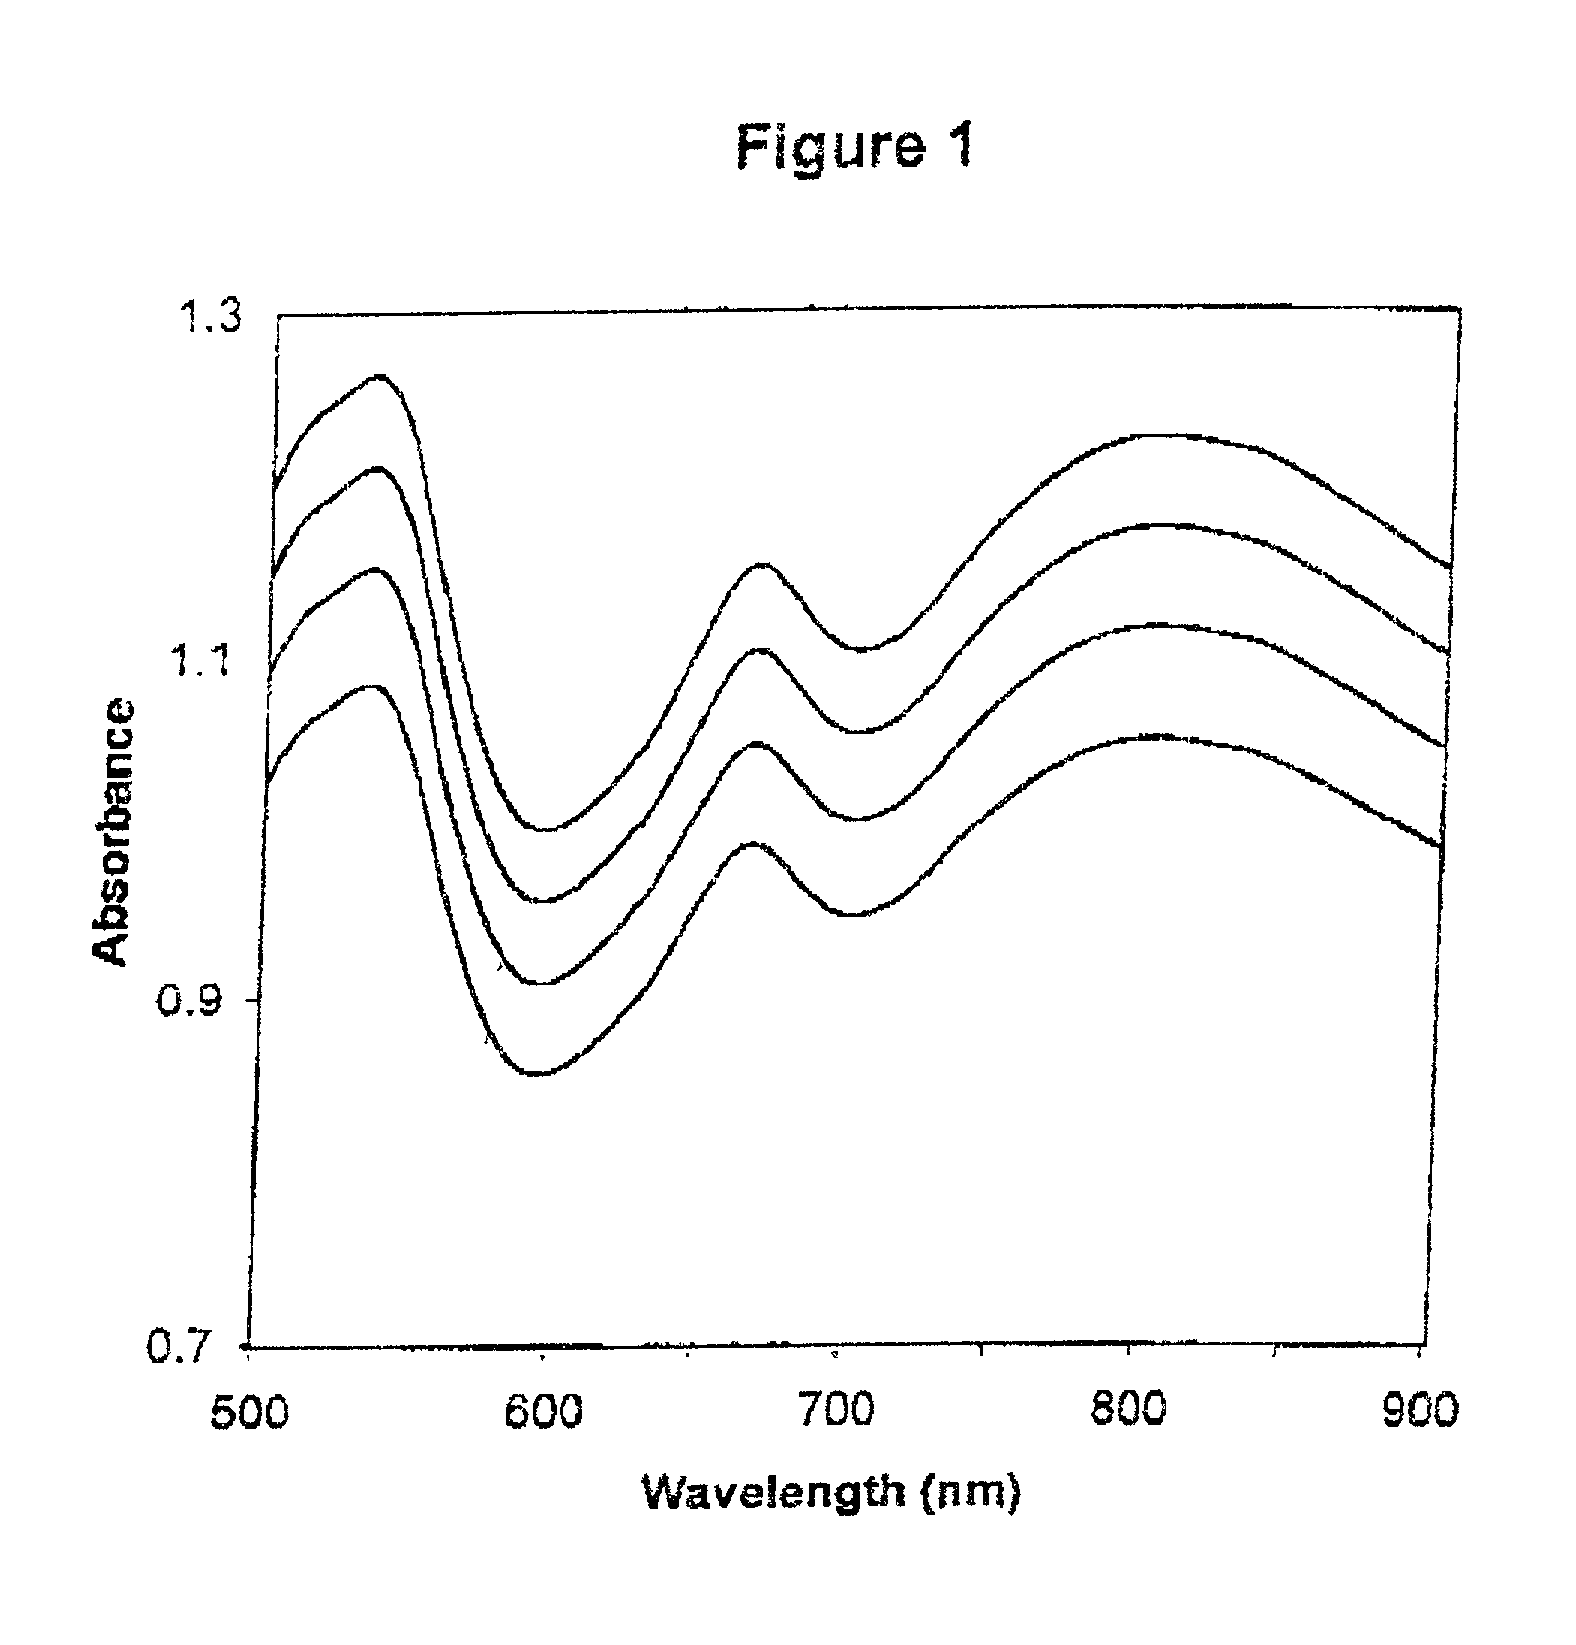
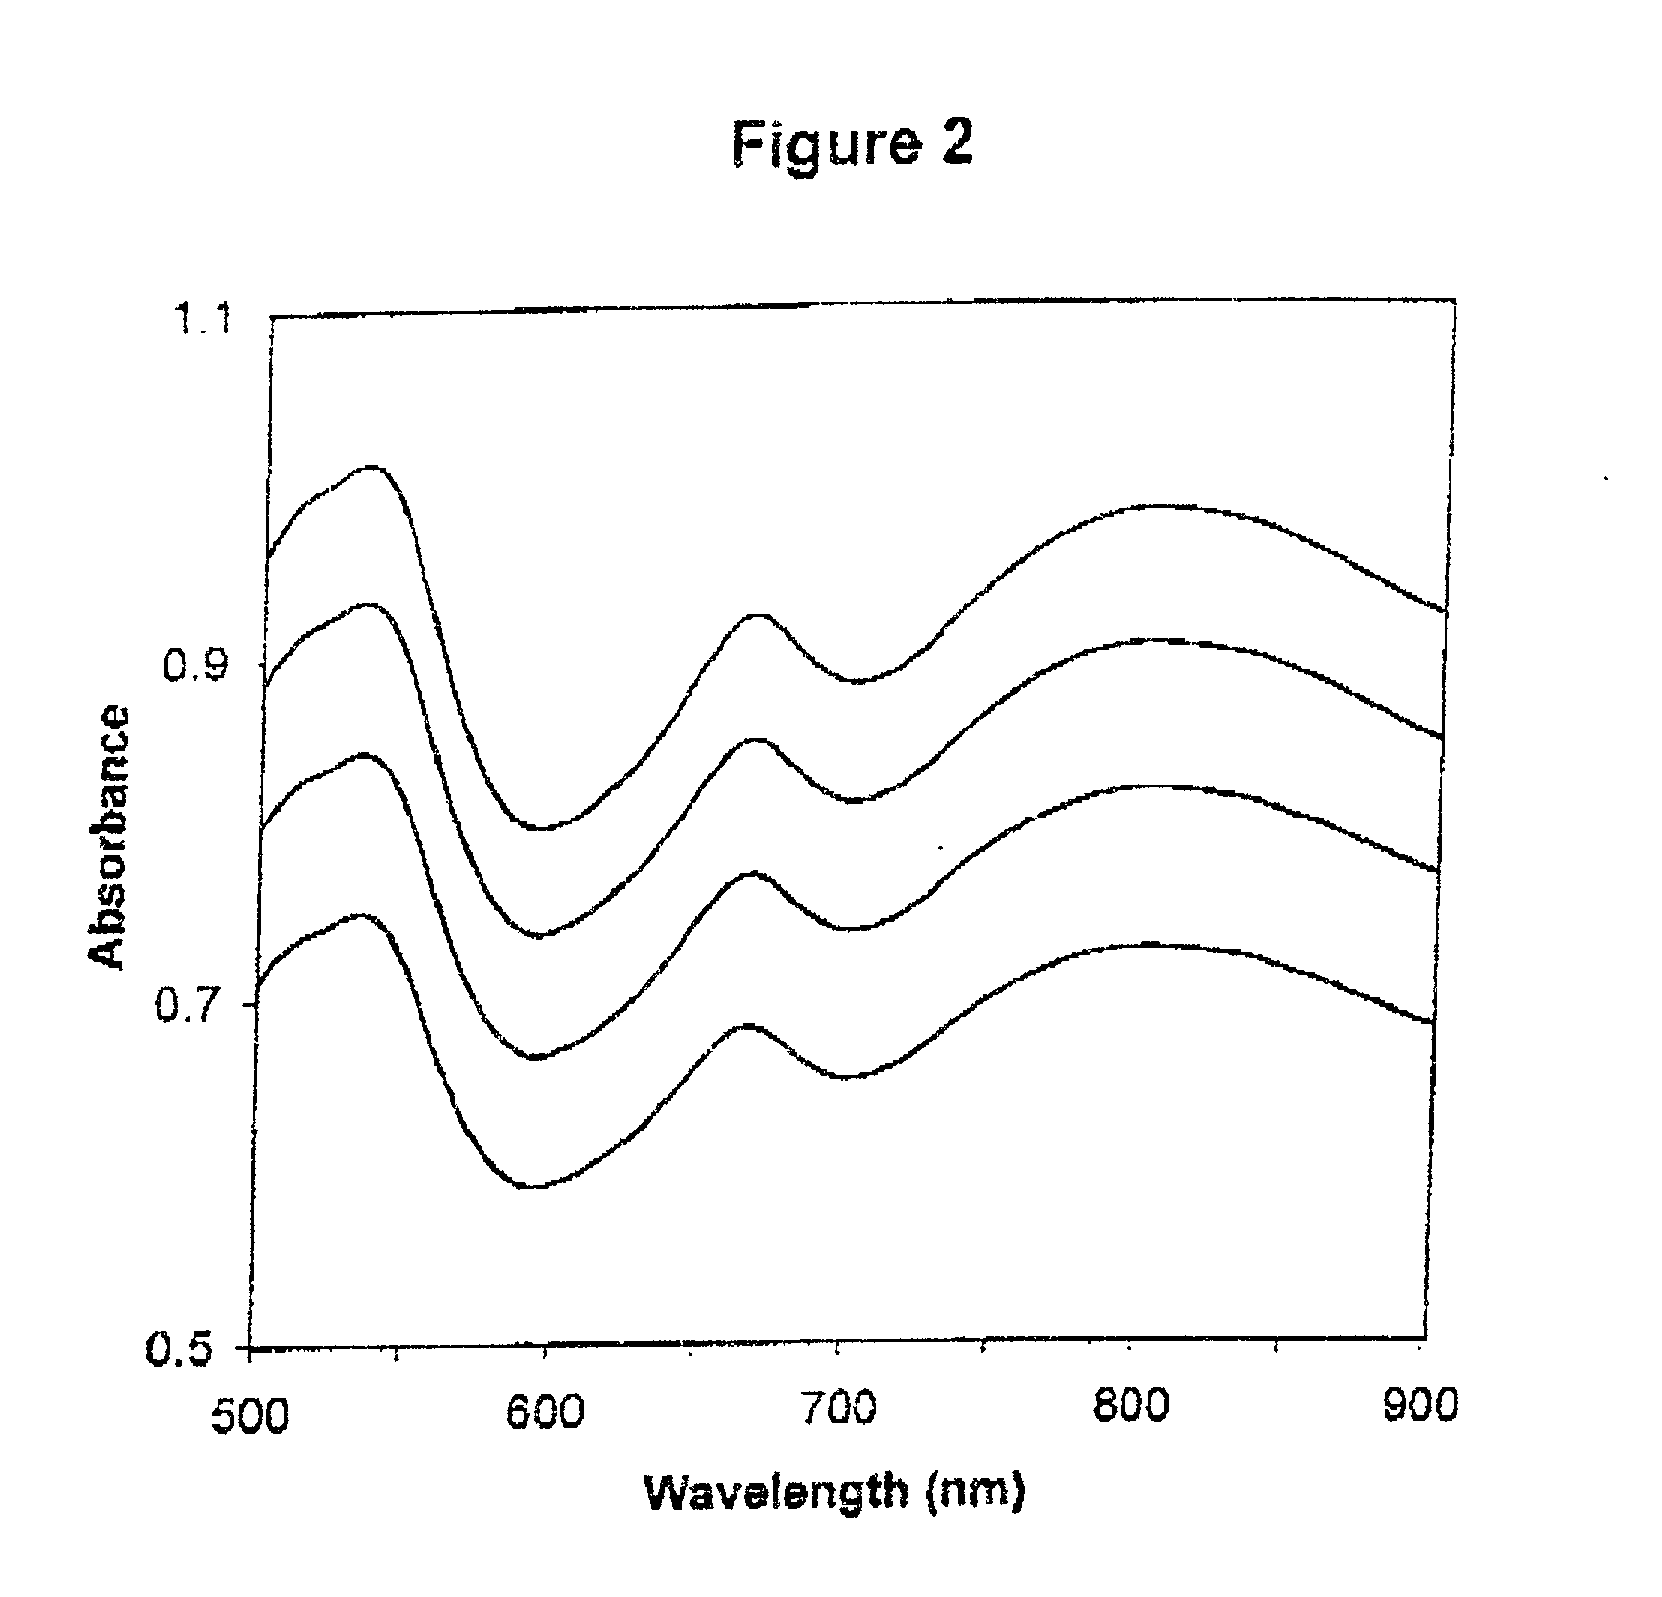
[0411] The absorbance spectra of four calibrators when tested on a first apparatus are shown in FIG. 1; the absorbance spectra obtained from a second apparatus are shown in FIG. 2. The first linear regression plots and equations for standard wavelengths 500 nm, 550 nm, 600 nm, 650 nm, 700 nm and 750 nm are shown in FIGS. 3, 4, 5, 6, 7, and 8 respectively. Table 1 shows the y-intercepts and slopes for the wavelengths chosen as examples.
1 TABLE 1 Wavelength (nm) y-intercept Slope R.sup.2 500 -0.796 1.464 0.99995 550 -0.801 1.465 0.99995 600 -0.664 1.464 0.99995 650 -0.744 1.466 0.99996 700 -0.732 1.466 0.99997 750 -0.785 1.467 0.99997
[0412] The slopes are very similar for the wavelength example shown in Table 1, but there are more significant differences for the y-intercepts. These numbers are very different from apparatus to apparatus. The large R.sup.2 values (very close to 1) indicates the high correlation between the absorbances of the two apparatuses, and hence the reliability of...
example 2
[0420] For illustration, a primary Hb calibration algorithm was developed for apparatus #1, (a "First Apparatus"), and the same calibration algorithm was applied to data generated from five other apparatuses (#2, #3, #4, #5 and #6, all of which are second apparatus). In this example, calibration between instruments is illustrated using the first derivative of the absorbance spectra.
[0421] The absorbance spectra for the same sample was shown for only three of the apparatus for clarity (#2, #4 and #6); they demonstrated the full range of variability in the absorbance spectra for a standard set of wavelengths for the six apparatus used, without photometric correction (FIG. 9). When the first derivative of absorbance was calculated and plotted (FIG. 10), most of the variability disappeared, especially at wavelengths 593 nm and 608 nm, which were used in the calibration algorithm for hemoglobin, shown below:
g / L Hb=-0.22-75.96.times.(1st derivative of absorbance at 593 nm)+81.45.times.(1s...
example 3
[0430] Upon examination of the spectra in FIG. 9, it may be seen that photometric correction would be necessary if the raw absorbances at any wavelength were used in the calibration algorithm. Upon examination of the first derivative of absorbance spectra of the same synthetic fluid tested on the same 3 different apparatus (#2, #4, #6) in FIG. 9, it is observed that there are no differences in the apparatus at 593 nm and 608 nm, using a standard set of wavelengths. It can be appreciated by those skilled in the art that the requirement of photometric correction depends on the required accuracy of the predicted analyte.
PUM
| Property | Measurement | Unit |
|---|---|---|
| wavelengths | aaaaa | aaaaa |
| wavelengths | aaaaa | aaaaa |
| wavelengths | aaaaa | aaaaa |
Abstract
Description
Claims
Application Information
 - R&D
- Intellectual Property
- Life Sciences
- Materials
- Tech Scout
- Unparalleled Data Quality
- Higher Quality Content
- 60% Fewer Hallucinations
Browse by: Latest US Patents, China's latest patents, Technical Efficacy Thesaurus, Application Domain, Technology Topic, Popular Technical Reports.
© 2025 PatSnap. All rights reserved.Legal|Privacy policy|Modern Slavery Act Transparency Statement|Sitemap|About US| Contact US: help@patsnap.com


