Method for sizing surface breaking discontinuities with ultrasonic imaging

a surface breaking and discontinuity technology, applied in the field of non-destructive testing of materials, can solve the problems of not working as well as still desired, radioactive contamination, and all discontinuities are actually detrimental to continued operation, so as to reduce the time required, reduce the amount of extraneous information, and reduce the adverse effects of background nois

Inactive Publication Date: 2003-05-15
ELECTRIC POWER RES INST INC
View PDF0 Cites 36 Cited by
  • Summary
  • Abstract
  • Description
  • Claims
  • Application Information

AI Technical Summary

Benefits of technology

0020] A first object of the invention is to reduce the time required to non-destructively test a material. A second object of the invention is to enable an inspector to accurately characterize reflectors by orientation, length, depth and profile, all with less adverse effects from background noise than heretofore available. A further object of the invention is to enable data to be collected and then analyzed at a later time period or by a plurality of inspectors. Yet another object of the present invention is to allow the inspector to gate data to particular ranges of interest, thereby limiting the amount of extraneous information being displayed in any given window. A still further object of the invention is to enable much more data to be displayed in a single window than was heretofore possible through a composite display and with visual amplitude representation.

Problems solved by technology

Ultrasonic examination is one such method which has been applied successfully, particularly with metal materials, though not as well as still desired.
However, placing or leaving a defective tube in operation in a nuclear power plant could result in radioactive contamination.
While discontinuities may require replacement of tubes, not all discontinuities are actually detrimental to continued operation.
With such timely detection and sizing of reflectors, the tubes will only be installed when satisfactory, and later replaced or taken out of service only when necessary.
Generally, a normal angle of incidence will result in reflection from the material back to the transducer, and further reflection from the transducer leading to a bouncing back and forth.
The tip signal is generally a weaker signal than the corner signal, and can be much more difficult to distinguish from background noise.
Nevertheless, and like the corner signal, there will be a time delay between generation of wave and receipt of echo which can be used to calculate the location of the tip.
Consequently, the prior techniques have not produced an intuitive and rapid sizing technique.
However, the examination has heretofore consumed more time and has been more difficult than desired.

Method used


Image

  • Method for sizing surface breaking discontinuities with ultrasonic imaging
  • Method for sizing surface breaking discontinuities with ultrasonic imaging
  • Method for sizing surface breaking discontinuities with ultrasonic imaging

Examples


Embodiment Construction

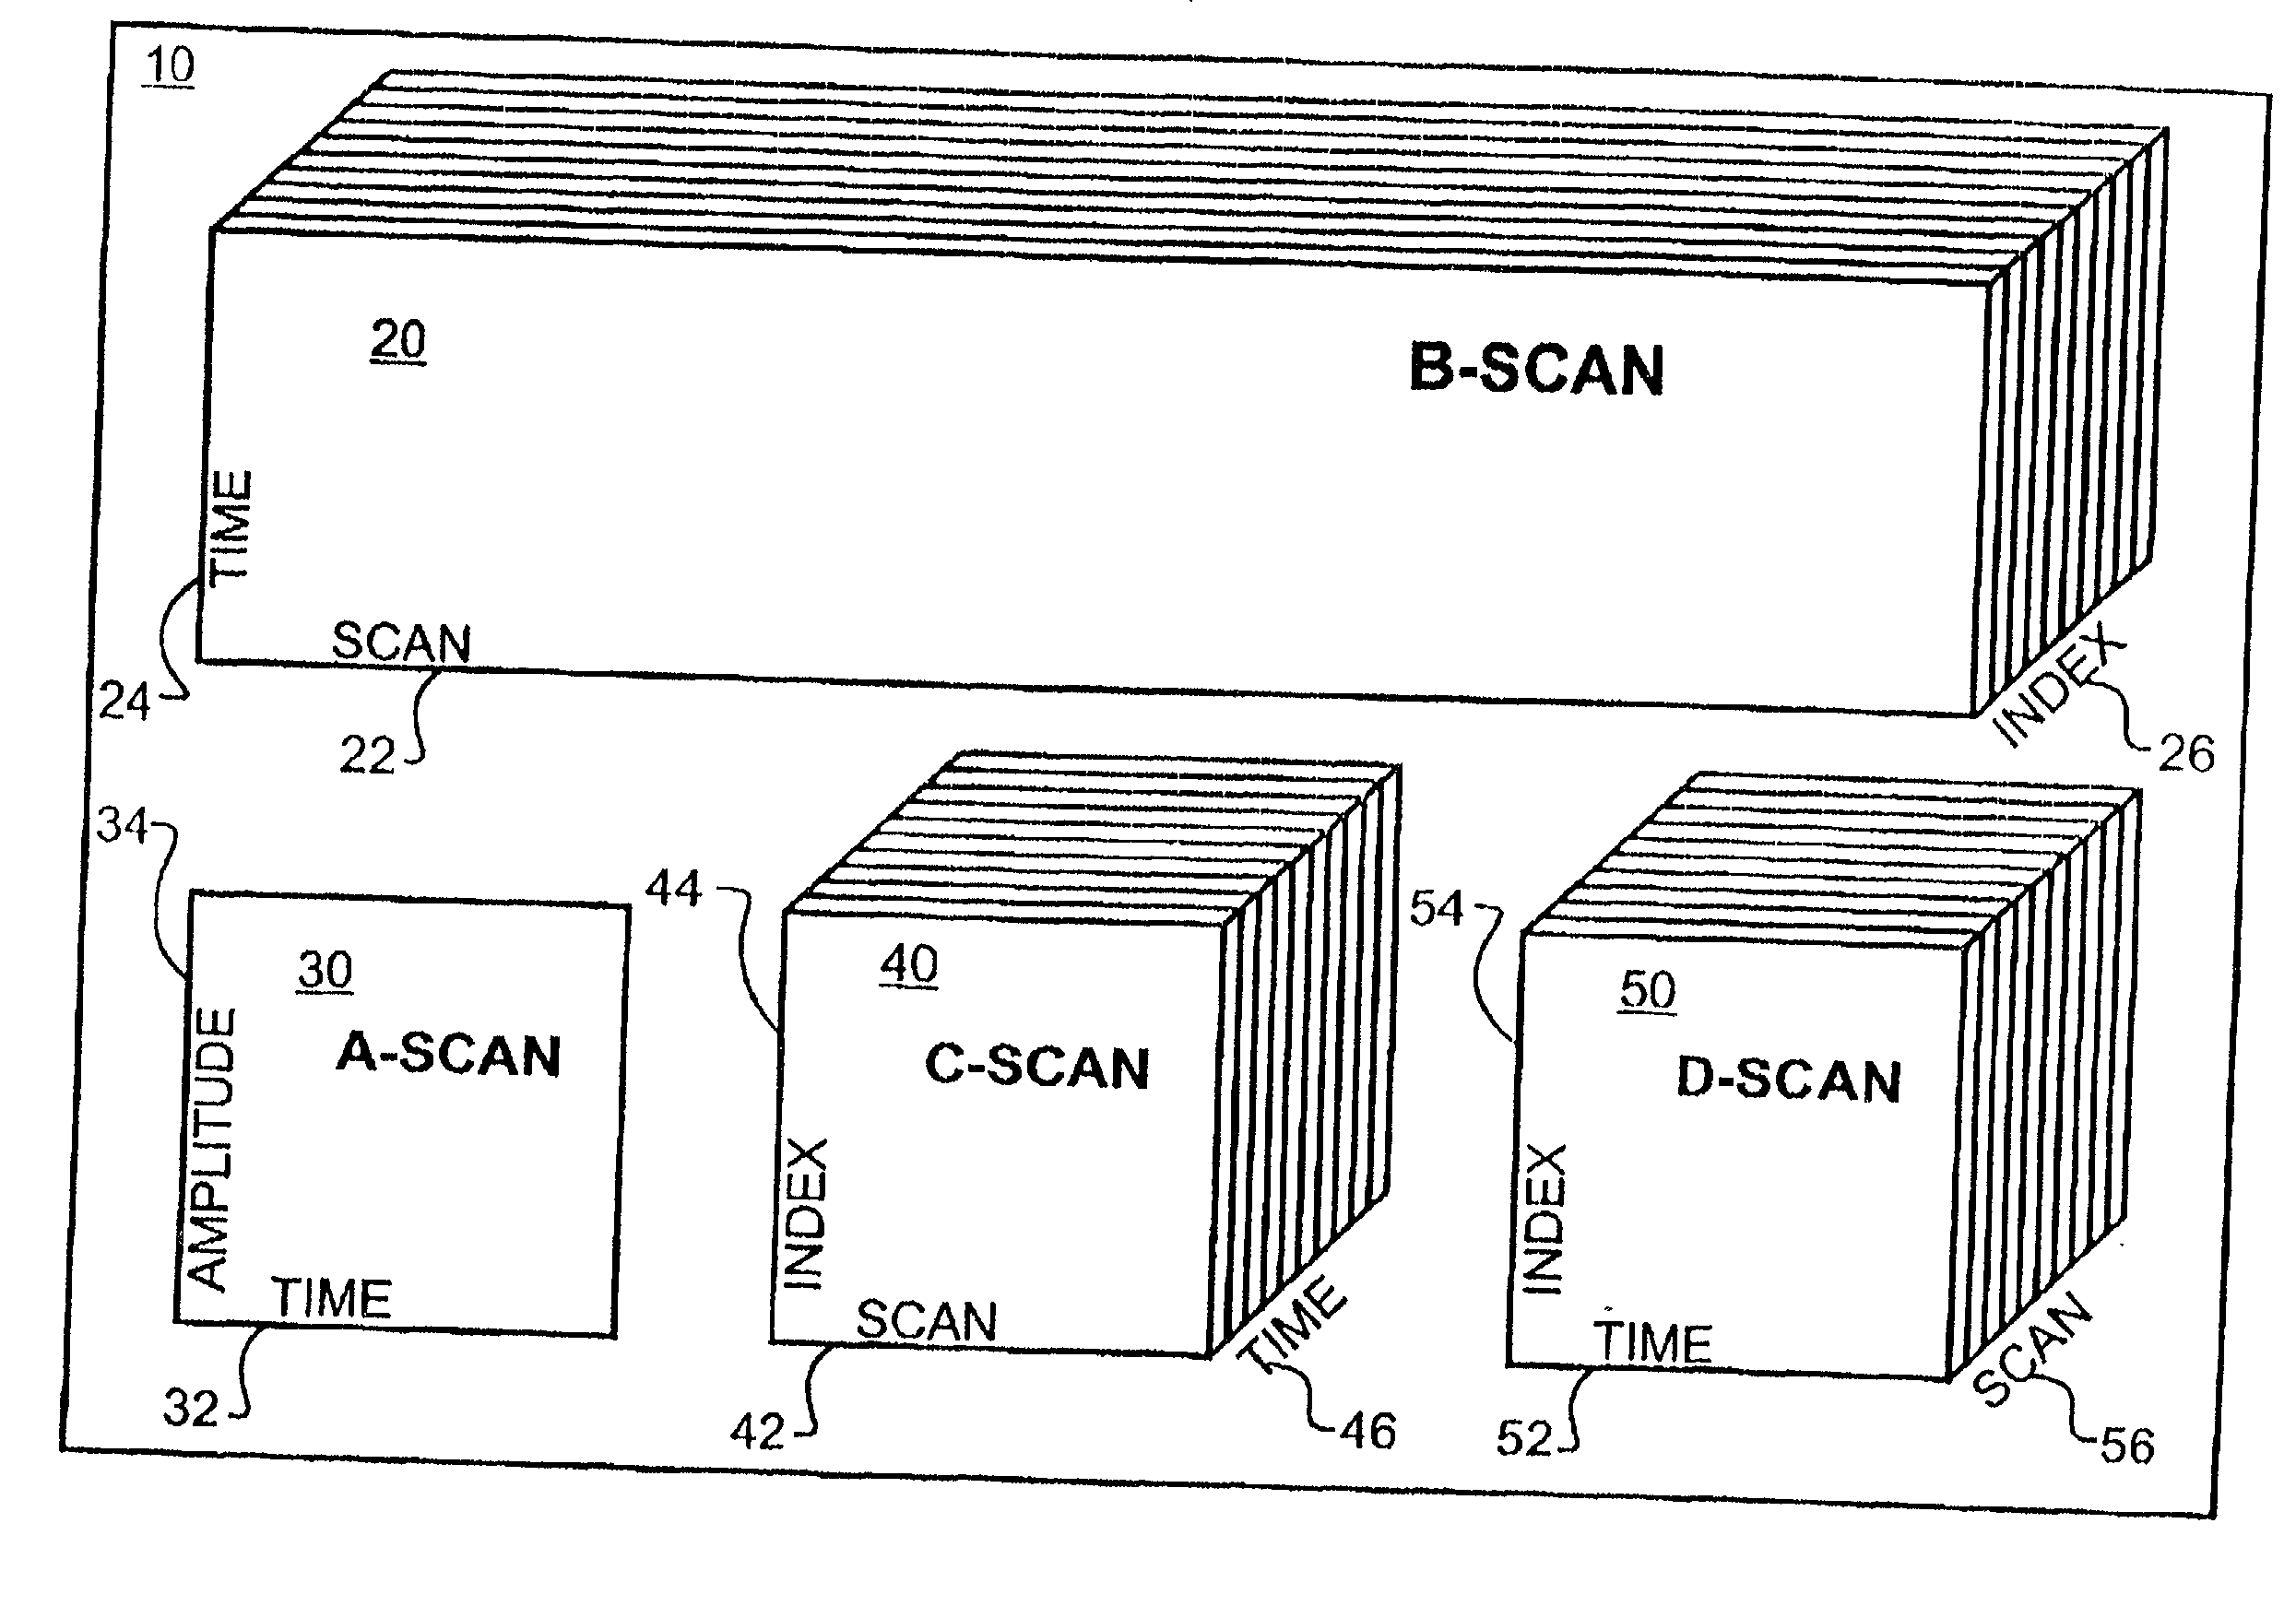
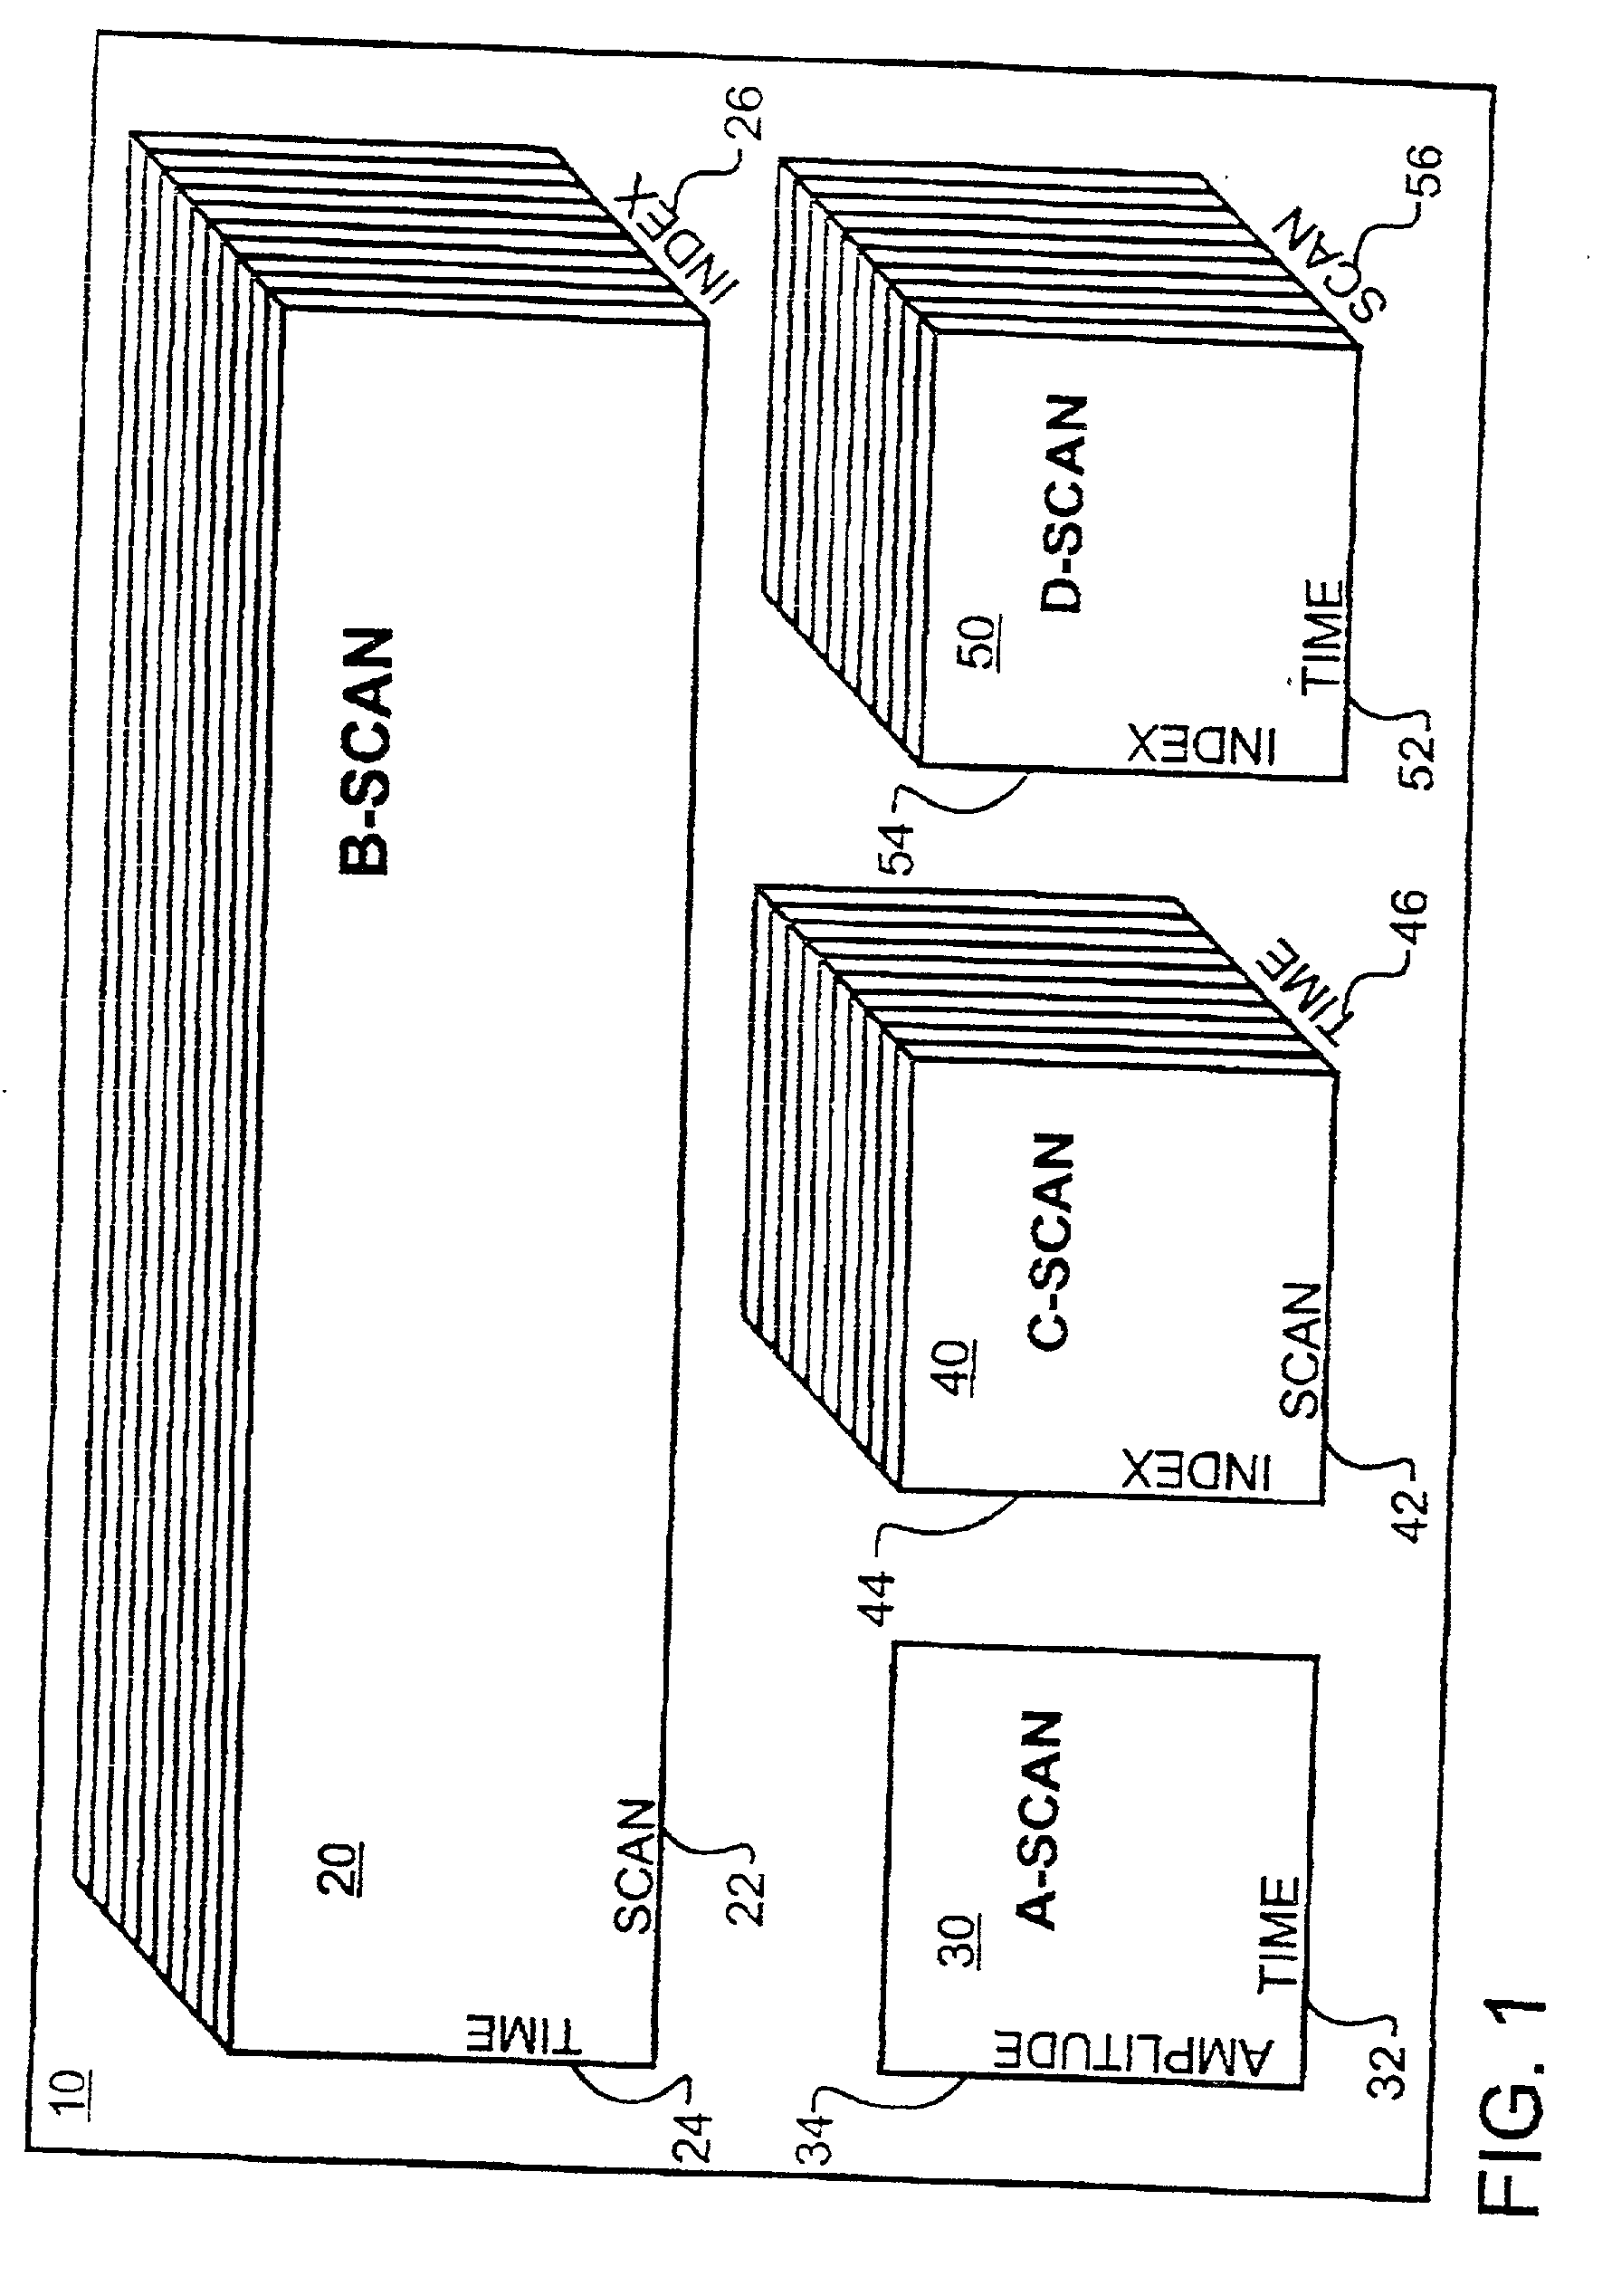
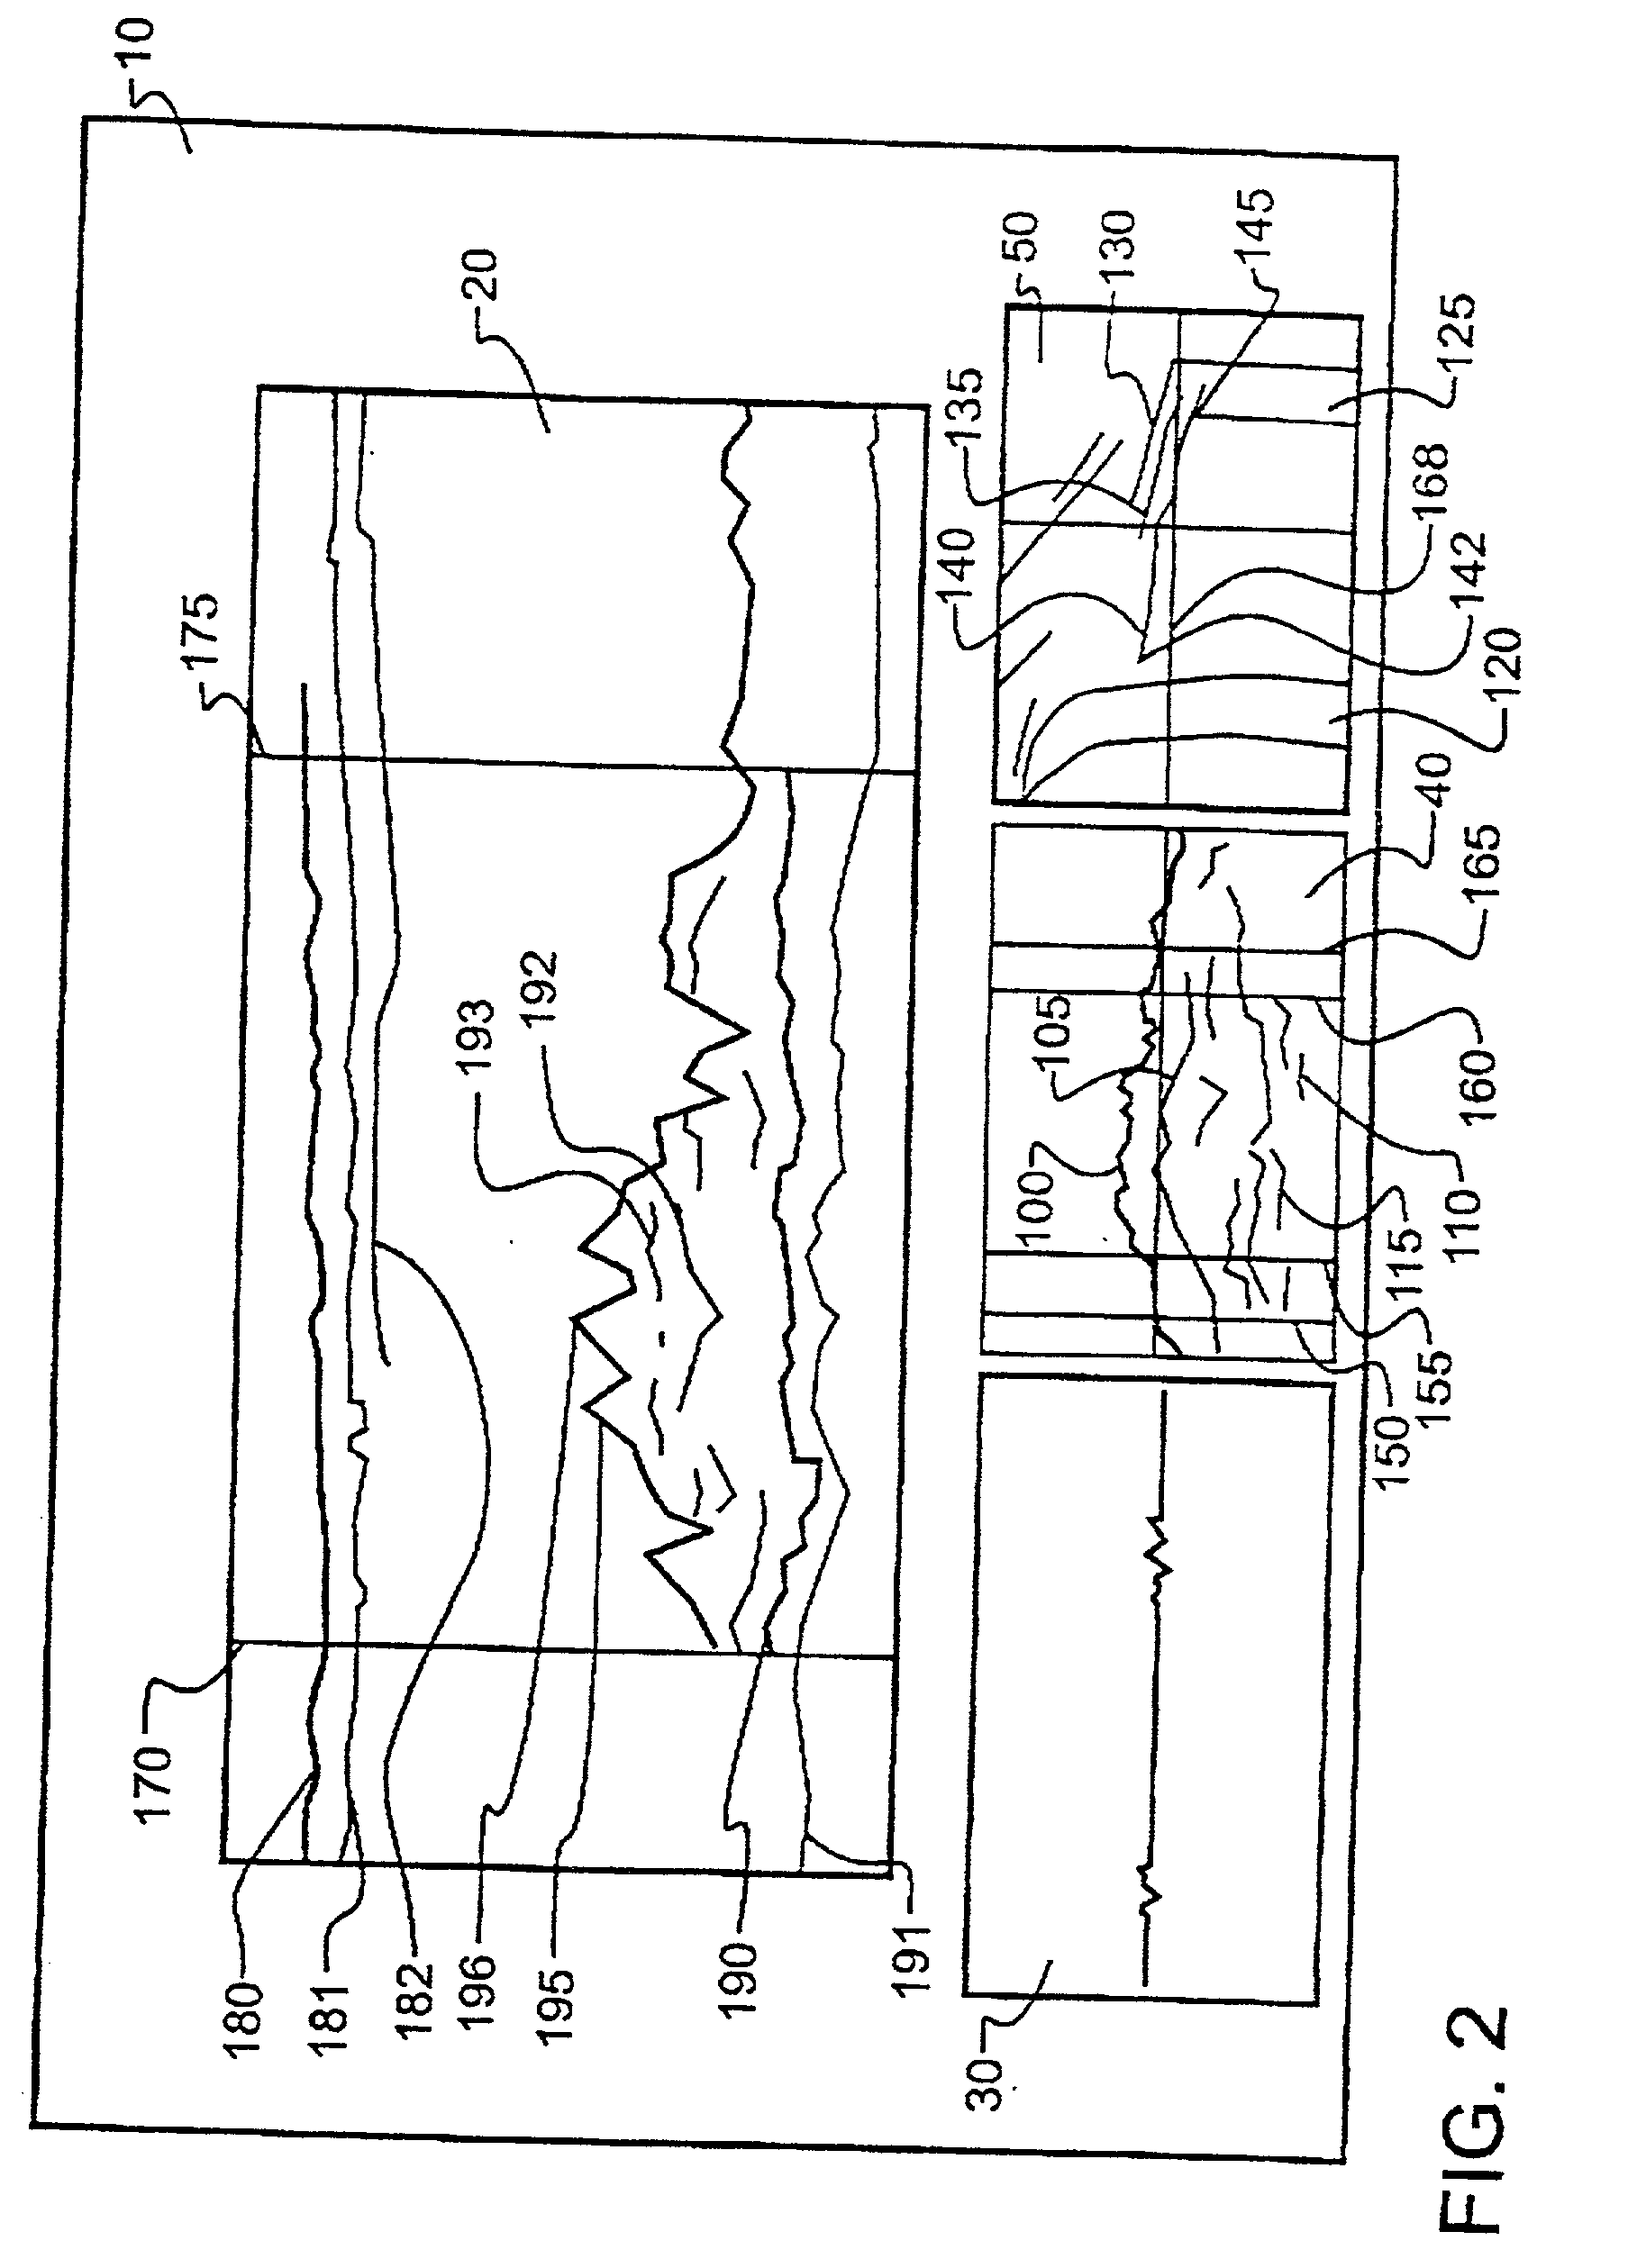
[0043] An Inconel tube having a 7 / 8" diameter, an 0.050" wall thickness, and a circumferential ODSCC of known size was scanned, using the circumferential direction as scan reference, and the length of the tube as the index reference. Ultrasonic RF data was collected from the tube using a 15 MHz forty-five degree focused search unit. The time gate used for production of the C-scan was adjusted to encompass the outside surface of the tube, and the results are illustrated in C-scan 40 of FIG. 2. Next, the index gates were adjusted in C-scan 40 to encompass the ODSCC, to produce a D-scan composite image 50 that presented the corner and associated tip signals for the entire ODSCC. An estimate was made, at that time, from the image displayed by D-scan 50, of the maximum overall depth of the ODSCC. The ODSCC was then profiled in B-scan 20 by moving index gate 168 into and through the entire ODSCC signal presented in D-scan 50. The maximum initial positive mode location of the tip signal an...


PUM

PropertyMeasurementUnit
thresholdaaaaaaaaaa
thresholdaaaaaaaaaa
ultrasonic echoaaaaaaaaaa

Abstract

Ultrasonic scan data is displayed within a display (10) and is arranged in a plurality of two and three-dimensional colored displays (20, 30, 40, 50). A C-scan display (40) is a composite plot of a region of interest using color to designate echo amplitude. The composite plot (40) is time-gated to limit the range of depths of data presented and thereby limit the plot to a tin section such as a surface. Surface breaking discontinuities (100) are visible as highly colored echoes within this C-scan display (40). Within C-scan display (40), once a discontinuity such as a reflector is detected, additional gates (150-165) may be set which permit other specialized displays such as D-scan (50) and B-scan (20) windows to portray the discontinuities. The D-scan plots index direction (54) against time (52), and readily displays circumferential reflectors (130-145) therein, while also enabling rapid estimation of the depth (142) of these reflectors. A B-scan plot (20) which enables fine profiling of reflectors may be a single pane taken at a single axial location determined by an index cursor (168), or may alternatively be a composite plot. Various modifications to the basic system are disclosed that further enhance the utility of the display (10).

Description

[0001] This application is a continuation-in-part of presently pending U.S. application Ser. No. ______, filed on ______, the contents which are incorporated herein by reference in entirety.[0002] 1. Field of the Invention[0003] The present invention pertains generally to the field of non-destructive testing of materials, and in one more particular manifestation to a method of examining conduits to more rapidly and precisely detect and measure flaws.[0004] 2. Description of the Related Art[0005] There are many industrial and commercial applications where a material is most desirably tested, prior to being placed in service or subsequent thereto. In such instances, non-destructive testing methods are required which enable rapid and reliable testing and evaluation. Ultrasonic examination is one such method which has been applied successfully, particularly with metal materials, though not as well as still desired.[0006] One particular industrial application where ultrasonic testing has...

Claims


Application Information

Patent Timeline
Patent Type & Authority Applications(United States)
IPC IPC(8): G01N3/00G01N9/24G01N19/08G01N29/06G01S15/89
CPCG01N9/24G01N19/08G01S15/8993G01N2291/015G01N2291/2632G01N2203/0064
Inventor KENEFICK, STEVEN A.HENRY, GARY L.
Owner ELECTRIC POWER RES INST INC
Why Eureka
Try Eureka